www.mojet.net
Needs Analysis Of Infographic Media Using
Technology for Learning Physics
Netty Apriyanti [1], Rafiza Abdul Razak [2], Mohd Shahril Nizam Shaharom [3], Suzieleez Syrene Abdul Rahim [4], Siti Hajar Halili [5]
http://dx.doi.org/10.17220/mojet.2020.01.004
[1] [email protected], University of Malaya, Malaysia [2] [email protected], University of Malaya, Malaysia
[3] [email protected], University of Malaya, Malaysia [2] [email protected], University of Malaya, Malaysia [2] [email protected], University of Malaya, Malaysia
ABSTRACT
This research aims to analyze the needs of infographic media for physics learning of the concept kinematics of rectilinear motions, especially for the concept of uniform rectilinear motion and accelerated uniform motion in Senior High School. This research was conducted to teachers, students, and document analysis, namely syllabus and list of instructional media at Senior High School in Sambas district using interview technique, observation, and documentation study. Researcher used triangulation and member check to ensure the validity of the findings of this study. The results based on document analysis showed that the lack of supporting books and no instructional media for the kinematics of rectilinear motions concept in selected schools and based on interviews to teachers and students that they are very interested in infographic learning media and are in need of infographic as a medium of Physics learning. The intended infographic media will be well packaged and accessible via facebook social media and backed up using smartphones as a learning tool for learners.
Keywords: Needs analysis, infographic, technology, Physics teacher
INTRODUCTION
The technological sophistication of the present condition affects the habits and culture of Indonesian education managed so far (Slamet, 2016). However, the reality of Indonesia's education is still categorized as low. In 2011, based on Progress International Reading Literacy Study (PIRLS) Indonesia was ranked 41 out of 45 countries (PIRLS Indonesia Team, 2016). Still in the same year, Indonesia is ranked 38th out of 42 countries in Mathematics and ranked 40th out of 42 countries for Science study from Trends in Mathematics and Science Study (TIMSS) followed by VIII students (Napilupulu, 2012). Selanjutya in 2012, Indonesia ranked second from bottom, which is 64 of 65 countries in international research Program for International Student (PISA) (Fitri, 2013). Even more concerning is that Indonesia is ranked the latest in educational research such as Learning Curve, Pearson in 2014, which is ranked 40 out of 40 countries (Pearson, 2014). Therefore, innovation is needed to improve education in Indonesia, especially in teaching and learning process.
The teaching of physics in high school (SMA) today has not achieved good results, especially education in Sambas areas still need to be improved, especially in the program of Natural Sciences (IPA) and more specifically on the subjects of Physics (Sambas District Education Office based on Exam decision National, 2013, 2014, 2015, 2016). For most students, Physics is one of the most difficult subjects (Baran, 2016,
www.mojet.net Rofalina, 2015, Welch & Walberg, 1972) and uninterested (Samudra, Suastra, & Suma, 2014; Tsai & Fu, 2016). According to Daniel (2004), the concept of 'Kinematics' and 'Dynamics' is a concept that is seen most problematic to Physics students based on an analysis conducted with a questionnaire delivered on the 'Cikgu Science' website from January 1998 to August 1999. This also applies today that there are still many students who fail to understand the concept of kinematics (Bollen, De Cock, Zuza, Guisasola & Kampen, 2016; Motlhabane, 2016).
In Physics teaching, students are required to understand the appropriate concepts of material contained in the applicable curriculum. In order not to cause a sense of saturation of learning and referring to the curriculum 2013 current teaching process in Indonesia, it takes the creativity of teachers in strategizing and planning teaching models in order to foster the creative thinking ability of students, work and be scientific which is an important aspect that must be owned by students.
The fact that occurred in the field, the process of teaching and learning in Physics learning on the habit is run by conventional methods that are only done by relying on lectures (Apriyanti, Umar, & Tandililing, 2015). This makes the teacher's function the only source of learning and indirectly makes it difficult for students to get good learning outcomes in building knowledge to make learning meaningful. In addition, students also feel bored if treated as passive respondents who only get knowledge from teachers only (The National Foundation for Educational Research, 2011). This is contrary to Hofkins (2014) which states that students need space to think, to cultivate creativity, and to be themselves.
The learning process requires the arrival of knowledge or information to students. The information or content of the lesson can use media (Hashim, 1997, p.4; Haq, 2017). Sadiman et al. (2012, p.11-12) states learning activities are essentially a process of communication, ie as a process of delivering messages from a message source through a particular medium to the recipient of the message. Messages to be communicated in the form of teaching content and upbringing that is in the curriculum poured by teachers or other sources into the symbols of communication both verbal symbols (oral or written words) as well as non-verbal or visual symbols.
Compared with other subjects that curriculum in high school level, science curriculum (Phisics) felt very quickly caused by the impression of the development of science and technology. The use of technology in education may make the teaching of the students more engaging, interesting and easy (Broadie, 2003; Siraj & Alias, 2006). In addition, the visual characteristics of some technologies can help learners understand concepts and principles easily and meaningfully (Funkhouser, 1993). Rather than some of these studies, clearly shows the impression of integrating technology in the teaching of Physics is very meaningful.
The education system in Indonesia generally still uses visual learning media. Visual is one of the most important forms of information presentation (Yildirim, 2016). The use of interesting learning media in addition can be used to improve student motivation in learning, of course, the use of media will also stimulate students' visual spatial intelligence. In addition, visuals also allow situations to be displayed and information to be presented in an organized manner using visual components (Yildirim, Celik and Aydin, 2014). With the rise of the visual culture of the web, images, photos and videos into social information forms to share and have been circulating (Kern, 2013; Rainie, 2012; Walter, 2012). Until recently, educational researchers are still investigating the right kind of media and most visualization to be used in supporting learning in order to improve understanding (Lyra et al., 2016).
The infographic media to be built is in the form of a visual for the native digital generation that tends to prefer visual objects rather than writing (Maryani, 2017). Wulandari (2013, p.34) states the generation that was born and raised in the era of dominance of Information and Communication Technologies (ICT) use called digital native generation. The digital native generation is a very shrewd generation, familiar in the use and operation of tools called ICT. Furthermore, also stated that the behavior and character of the digital generation is very different from previous generations, especially the ability to use ICT and behavior in seeking informations.
Infographics are often referred to as information illustrations (Glasgow, 1994, p.7). Meanwhile, according to Newsom & Heynes (2004, p 236) infographic is a visual representation of information, data or science graphically. This graph shows complicated information briefly and clearly. Infographics can help
www.mojet.net students who find it difficult and tired to read books because of their over-written content (words). Meanwhile, if you only rely on viewing the picture alone, students actually difficult to understand not even understand the concept presented by the image. Teachers should strive to successfully get the attention of the students to be willing to understand the material or concept to be conveyed. Krum (2013) notes that infographic readers hope to see visualizations for faster learning and less text in infographics. This is because infographics can explain materials or method that are too boring if described with sentences and are incomplete if explained through a photo only.
As McCawley (2009) argues, that through needs analysis, educators will have three important things: (1) helping to verify and describe the current state; (2) describes how a program can meet its needs; and (3) describe the desired impact through the implementation of a program. At this time, although the use of computers and mobile technology is increasing in the field of education (McNeil & Borg, 2018), there are still few educators (Ertmer, 2005) and students (Aagaard, 2015) who take advantage of the ease of computers as educational media, such as the use of smartphones and computer laboratory in schools less optimum and multifunctional devices that support learning (Pegrum, 2016). Stiggins (2010) states teachers report that they need more practice in teaching. Rather, it takes skill to implement impressive teaching and learning, especially in the development of learning media utilizing computer technology. There are differences in the role and science between teachers and computer experts, so that teachers who master the lesson material generally less able to present the form of teaching in computers and print media, while computer experts who are able to realize everything in the computer usually do not master the lesson.
Grabe & Grabe (2004), Keengwe & Anyanwu (2007), and Roblyer (2006) stated that prior to integration of the technology, teachers need to analyze technological conformity with learning materials and student characteristics such as age and learning style. This is supported by the study of Trikusyanti & Ruwanto (2010) on analyzing the content of computer-based teaching media on the expenditure of Information Technology and Communication Center of the Ministry of National Education (pustekom depdiknas) (not teachers of the field of study) and deciding that the teaching medium analyzed contains many false concepts so it is not worth using as a medium of instruction in school because it is very much confusing the students. In studying the Physics, the students needs to understand the concept correctly because the material presented in a row with prerequisite prior knowledge of the concept.
Based on the description above, the analysis of the need for infographic learning media that utilizes computer technology needs to be done to see the level of its needs as a learning medium that can be used in learning physics in high school. There is an increasing need to study what promotes and inhibits student's learning practices (Bruno & Dell’Aversana, 2018). In this study, a needs analysis was carried out for students and teachers of Physics in Sambas District High School.
RESEARCH METHOD
This research is needs analysis phase. It is first phase of design and development reseach (DDR) by Richey and Klein (2007) which consists of three phases. The research method used in this study is a qualitative method with the need analysis of the McCawley model (2015). The selection of this model because this need analysis model is the most complete stages and systematic so that each stages can be done by researchers in an organized manner. Instruments used in this study are interview guides, observation sheets and document analysis. Data collection techniques in research through direct observation and semi-structured interviews and document studies (Bogdan & Biklen, 1982).
Research Design
This research is used needs analysis method by McCawley (2015) with six steps. The steps are write objective, select audience (populations of research), collect data, select audiences (sample of research), pick intruments research, and analyze data. In this research, the sample was chosen by purposive sampling. Sugiyono (2012) states that purposive sampling is a technique of determining research with certain considerations that aims to obtain data obtained more representative. Meanwhile, according to Creswell
www.mojet.net (2014), in purposive sampling, researchers deliberately select individuals and/or locations to study or understand a phenomenon. Schools selected to observe Physics teachers who are in the process of teaching and document analysis is one of the first junior high schools in Sambas District and was chosen because of the consideration that the school had experienced a fire in 2013 so that the medium of learning available in schools is very small and may not even have media learning. To observe the process of teaching and learning in the classroom, researchers asked two physics teachers who became observers. The selection of a sample of three teachers representing Sambas district teachers is, in consideration, a teacher who is a National Physics, Physics Olympiad champion, a teacher who is expert in using computer technology and teaching subject teachers who teach at designated schools.
Data Analysis
The instruments used in this research were interview guides, observation sheets, and document analysis. All items in the instrument used in this study are determined by validity by two experts. They are lecturers who are experts in Physics education and teaching technology. For the purpose of determining reliability, the Cohen Kappa Index analysis (Cohen, 1968) was used to determine the level of approval of the unit of analysis with the theme under study. Next, the researcher calculated the approval value (Cohen Kappa Index) of the forms received from the experts. Approval values are calculated based on the following formula:
Source: Cohen (1968)
Annotation:
K = value of Kappa coefficient fa = frequency of approval
fc= frequency for 50 percent approval expectations
N = the number of units tested for value
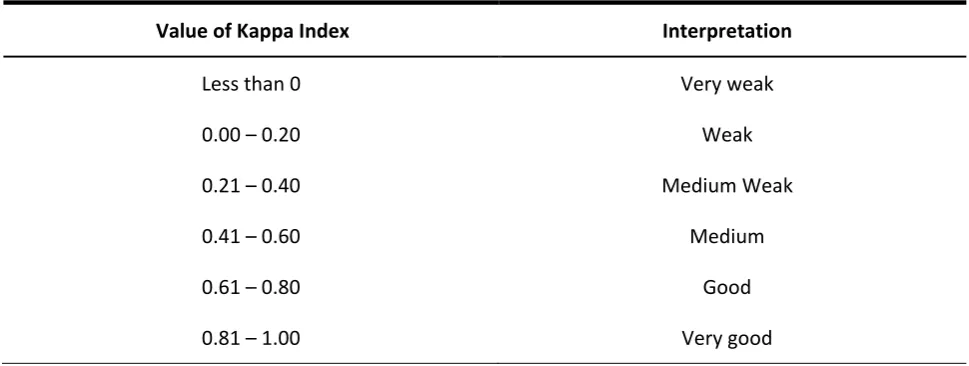
To determine the degree of Kappa approval, the values recommended by The Kappa Index value and its interpretation are used (Landis and Kosh, 1977), as shown in Table 1.
Table 1: The Kappa Index value and its interpretation (Landis & Kosh, 1977)
Value of Kappa Index Interpretation
Less than 0 Very weak
0.00 – 0.20 Weak
0.21 – 0.40 Medium Weak
0.41 – 0.60 Medium
0.61 – 0.80 Good
0.81 – 1.00 Very good
After data has been collected through needs analysis through interview guides, observation sheets, and documents analysis, the next step is to perform data analysis. However, before the analysis was
𝐾𝐾 =𝑓𝑓𝑎𝑎 − 𝑓𝑓𝑐𝑐
𝑁𝑁 − 𝑓𝑓
www.mojet.net conducted, the researcher summarized the data that may be so much to present more structured information and thus could be used as a backup evidence in conclusion (Khan, 2009, p.37). Ali (2010, p.322) states that the data gives meaning, then in the analysis carried out steps, namely grouping data, exposing data, and make conclusions. Data analysis is done by compiling data, exposing it into units, compiling into patterns, choosing which data are important and which will be learned and making conclusions (Ali & Saud, 2013).
Data analysis conducted in this research is with qualitative approach. The collected data was analyzed by a qualitative approach by Miles and Huberman (1994). For the interview of this need analysis, the data were analyzed thematically and then transcribed with the help of Microsoft Word and Microsoft Visual Basic with the aim of identifying the topics covered in the phenomenon that occurred (Boyatzis, 1998; Watts, Todd, Mulhearn, Medeiros, Mumford, & Connelly, 2016). It was be done with the aim of identifying the patterned topics in the phenomenon (Boyatzis, 1998; Watts, Todd, Mulhearn, Medeiros, Mumford, & Connelly, 2016). In addition, interview data and documents are described as descriptively descriptive.
Thematic analysis is a qualitative data analysis technique that achieves the research objectives. The steps of applying thematic analysis as proposed by Guest, MacQueen, & Namely (2012) includes six things, namely;
1. Collect and identify the data. 2. Generate initial code. 3. Create a theme.
4. Define the theme that has been generated 5. Rename and set the theme
6. Create a report by them generated as research findings.
The six steps listed above are used to analyze raw data obtained from interviews conducted with study participants. Specifically to generated initial code, the open code was used to code the interview data because the researcher made the code based on the words in the transcript of the interview after reading and understood the meaning of the respondent (Khandakr, 2009).
Sugiyono (2012, p.368) stated that the credibility test of data or trust on qualitative research data is done by extension of observation, increasing perseverance in research, triangulation, conversation with field expert, negative case analysis and member check. Researchers use triangulation and member check techniques to ensure the validity of this research by collecting all respondents in a forum to determine the information to be used in report writing in accordance with what is intended by the source data or information giver.
Limitations
This research is corresponding to samples research cooperation, due to the fact is the data that was collected from them be used for research foundation in needs analysis of infographic as instructional media and for next research (infographic media design and development). The validity of this research is according to cooporation with samples when observation, interview, and study of documents. The variety of samples research that some students and teachers found it rather difficult to discuss their expectations of the needs analysis of infographics. At time they came up with different reasons, explenations, and hopes that challenging to elaborate further. Other limitation is the subject in this research is about rectilinear motion kinematics concept for senior high school.
FINDINGS
The study was conducted on July to September 2017, covering document studies on high school curriculum, high school physics syllabus and media supporting Physics learning process. Through this activity the following information is obtained: 1) High school curriculum used on that date is the curriculum 2013, 2) In the syllabus of high school physics subjects especially on Core Competencies (known as KI) 3: Understanding, applying, analyzing factual, conceptual, procedural knowledge based on his knowledge about
www.mojet.net science knowledge, technology, arts, culture and humanities with the insights of humanity, nationality, state, and civilization on the causes of phenomena and events, and applying procedural knowledge to specific areas of study in accordance with their talents and interests to solve problems and Basic Competencies (known as KD) 3.3: Physical quantities in a rectilinear motion with constant velocity and rectilinear motion with constant acceleration. From the literature review, it is known that the basic competence is the basic essence of basic physics and must be mastered by the students because it is needed in the next concept which requires the earnest attention of the students to understand the concept more easily, and 3) The result of the analysis media that support the process of learning Physics in the school, it is known that the available Physics learning media is very minimal, even no images or other visual media that can be used to support learning Physics.
Observations were made to Physics students and teachers teaching in the classroom. Items contained in the student's observation sheet are divided into four themes, namely: 1) interest/motivation learning Physics; 2) active learning Physics; 3) learning media; and, 4) Physical content / concepts. Furthermore the items contained in the teacher's observation sheet is divided into two themes, namely the learning process and the use of instructional media. Observations have been made on the Physics learning process can be seen in Table 2 and Table 3.
Table 2. Observation data to students in Physics learning process
Themes Observation Results
Student interest/motivation Students look tense, disinterested, do other work that interrupts the teaching and learning process, and are not excited
Active learning Physics Students look bored, inactive, and do not ask and or respond to what the teacher says
Instructional media Students appear less interacting with learning resources, such as reading a book when the teacher asks (but there are still many students who do not care about the teacher's questions) and many students do not use and interact with the media
Table 3. Observation data to teachers in Physics learning process
Themes Observation Results
Learning process Teachers do not motivate and attract the attention of students to follow the learning of Physics well, the learning is not varied (monotonous), and the teacher does not provide opportunities for students to interact with the media
Use of instructional media Teachers do not prepare and use instructional media during the learning process
The fact that occurs at the time of observation is caused by several factors such as: (1) because the applied learning strategy tends to use the traditional or expository approach as a whole with lecturing methods that emphasizes teacher centered learning, (2) lack of media utilization that can increase the enthusiasm and interest in student learning, especially Physics learning media.
Interviews conducted to students and teachers Physics is in dept interview or commonly referred to in-depth interviews with semi-structured interview techniques. The interview data was recorded and then transcribed using Microsoft Word 2010 software thematic, then coded with Microsoft Visual Basic to create categories based on interview data. From these categories, there is a subtheme. Then, similar subthemes are grouped into themes. Furthermore, based on the results of the interview analysis to the students, there are
www.mojet.net five themes: 1) Physics learning problems, 2) Learning media in Physics teaching and learning, 3) Facebook for education, 4) Benefits of smartphones for learning, and 5) Infrastructure learning needs media.
The data obtained from interviews conducted to six students of natural sciences states that they feel bored with the lessons of Physics are always taught by lecturing methods and want learning with visual learning media in accordance with learning styles and concepts to be learned. Here is a supportive opinion about limited time for the Physics teaching process.
Oh, I mean learning methods are always used by teachers with lectures and textbooks. (AS3-P2L18)
Yes, because the teacher explained more lectures, because it would make the students sleepy. (AS2-P1L11)
In addition, students or teachers never use the media in the learning process, they find it difficult to understand and complete the kinematics of rectilinear motions concept. They do not have learning media that can be used independently, and can be used to study anywhere and anytime.
I have no other media to learn. I am currently learning from a student activity sheet, Madam. (AS2-P2L40)
No. In conveying the concept of rectilinear motion kinematic, the teacher did not use the media. Maybe because there is no learning media, Madam. (AS2-P2L4)
Furthermore, they also really want their smartphones to be used for learning (educational function) and also strongly agree if the concept of kinematics of rectilinear motions is packed well and can be accessed through social media, such as facebook. Here is a supportive opinion about using facebook and their smartphone for educational function by students.
In my opinion, if the concept of rectilinear motion kinematic that we can access through social media will be able to facilitate learning if what teachers in the field of teaching can not understand. (AS1-P3L36)
Yaaa as I mentioned before, Madam. Because facebook is very accessible. It makes learning more flexible, Bu. (AS2-P3L35)
Yes, because where I am, there is also my smartphone, so if a smartphone is used as a learning medium, it will make my learning more flexible. It's up to me to determine where and where to learn, Madam. (AS1-P4L10) Oh yes, learning with smartphone makes me more flexible. I am free to determine my time and place to study. (AS2-P3L42)
Students are very interested and are in need of infographics to learn the concept of kinematics motion with the infographics that contain graphics, images with interesting colors and given a description, and can cause their motivation. They argue that students more easily understand the lessons through visual media and the proposed infographic media should try to be made to facilitate them in studying physics.
The infographic media offered is very interesting, so it can make me more excited to learn Physics, of course, because of the colorful and interesting images and graphics. Visual media such as this infographic corresponds to our learning style and the concept of movement. With visual media displaying images, concept rectilinear motion kinematic can be analyzed well. In this way, we hope our brains are not burdened anymore, if studying with too many sentences. (AS1-P4L44)
The conclusion that can be made from the interview result to the students is the all of students needs the infographic so that the students is easy to understand the concept of kinematics of rectilinear motion
www.mojet.net and so that the learning method becomes interesting, so the students are fun to learn because in the present time using the lecture method will make the students feel bored and bored. Students also need a medium that can help them learn at home so that they can easily determine the time and place to learn, so learn more flexible for example by using a smartphone. In addition, students also need an interesting visual media to motivate them to study hard physics. Students are more interested in new learning methods so that teachers or researchers are required to give birth to new innovations in teaching and learning activities so that the interests and spirit of students grow in the subject of physics is known for the most difficult subjects. For example the visual media, the infographic is proclaimed, because students prefer to see interesting pictures.
Based on data of the interview analysis to the students, there are six themes: (1) Physics teaching problems, (2) Learning media in Physics teaching and learning, (3) Constraints in learning media, (4) Facebook for education, (5) Smartphone learning benefits, and (6) Infrastructure learning media needs.The description of the experiences of teachers teaches the concept of rectilinear motion kinematics that all teachers who were respondents claimed to have taught the concept and almost all teachers claim always have difficulty. From the data that can be obtained, teachers rarely do not even use the media in learning and all teachers agree that the concept of kinematics of rectilinear motions are very suitable to be taught with the help of visual media.
The difficulty I feel is that I have difficulty visualizing or showing directly about the movement of the object and direction of velocity and acceleration. (A1-P1L37)
The difficulty I feel ... eee ... Media limitations. To be honest, I feel the media need to help me and my students in the learning process. (A3-P1L12)
Our school has no Physics learning media, especially kinematics of rectilinear motion. Even the media in the form of images is not there anymore. (A3-P1L13)
Because the concept of kinematic motion is an important concept, especially regarding motion. Observations made by students in observing direction and magnitude of velocity or acceleration must be clear and accurate. Therefore, the learning media needs to be able to explain it, with visual media. (A1-P4L18)
All teachers also agree if the smartphone is used as a learning tool for students and social media such as facebook is used to facilitate students access infographic media. One of the teachers who became the respondents argued that during this smartphone is only used for social media only and it means less educative, so with the smartphone as a tool for learning is a brilliant design and excellent because it can take advantage of smartphones in education. Other teachers also believe that all students often interact with facebook so that by using a smartphone can facilitate students in accessing the learning media that will be disseminated through the facebook.
Yes because my students will be very easy to access. Maybe not just my students, others will also be easy to access. So, sharing their knowledge is very simple and can be wider. (A2-P4L33)
Yes, because I believe my students have such applications and often interact, I mean they often use facebook. In addition, I believe in using smartphones, learning will become more flexible, in the sense that students can learn anywhere and anytime. (A1-P4L5)
I think, if a smartphone is used as a tool for learning, then the learning done by the students will be more flexible. Students are free to determine their time and place to study. I say this is based on my experience of always bringing my smartphone wherever I go, so I mean to my students. (A3-P210)
Teachers also emphasize that they are in need of infographic media because the kinematic concept is a concept related to motion so that its movement is difficult to observe directly. They need a medium that
www.mojet.net can show and describe the movement of an object well and suggest that it should follow the scientific approach in presenting the kinematic of rectilinear motions concept.
In my opinion, infographic media is indispensable and can be developed and accessed through social media so students can access it via their smartphones easily. Ehmmm ... facebook, social media that has been mentioned, yes facebook. (A1-P6L13)
As I mentioned earlier, if graphical information is composed of drawings and graphics, students would prefer it, and I hope this infographic media can help and facilitate my students to understand the concept of a straight line kinematic. So, we really need it. (A2-P6L30)
Overall, the results of publication to all teachers who became respondents found that infographic media is very necessary and feasible to be developed, especially for the lesson of Physics on the concept of kinematics motion. Because in general the package book that discusses the material, contains too many texts or sentences that can make students' cognitive loads heavier. With this infographic I hope to reduce the cognitive load of students and students can easily understand the concept. In addition, high school students are Z generation who love visual.
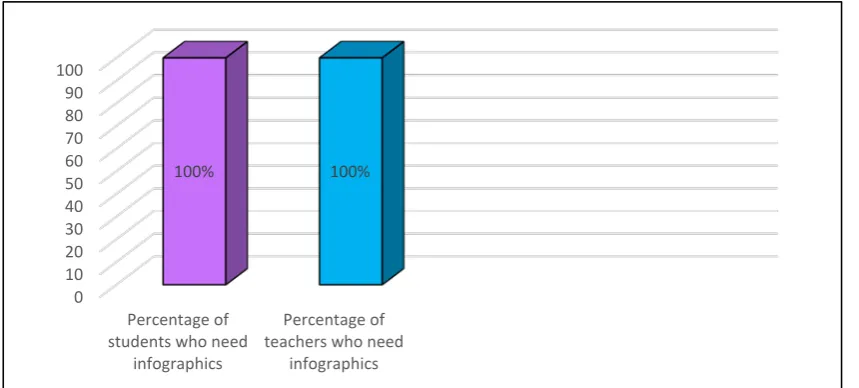
Based on the results of interviews on the analysis of needs, all students and physics teachers stated that they really needed infographic media. Visualization analysis of infographic media needs based on interviews to students and teachers shown in Figure 1.
Figure 1. Visualization analysis of infographic media needs based on interviews to students and teachers
DISCUSSION AND CONCLUSION
Discussion
Infographics are a new medium for them, which makes them curious and very happy with the idea of applying infographic media in learning, especially Physics lessons. This makes all of teachers in desperate need of infographic media in Physics learning. They hope that this infographic media should be developed and developed in order to support and provide more understanding to the students. If the students are already familiar with the concept presented, then this certainly affects the achievement of student learning in Physics lessons.
Other data in this study is the list of smartphone ownership and the tendency of students in using social media. Of the four classes of natural sciences examined, it turns out there is one class that all students have smartphones and social media used by all students ie social media facebook. This is very important to
0 10 20 30 40 50 60 70 80 90 100
Percentage of students who need
infographics
Percentage of teachers who need
infographics
100% 100%
www.mojet.net know because according to the results of interviews to students, they strongly agree if their smartphone used as a tool to learn and use social media facebook to facilitate them to access the infographic. Based on this data, planned infographic media can be packaged according to the smartphone screen and circulated using the facabook media.
From the data also states that the use of computers in learning has not been optimal or in other words, the role of technology/Information & Communication Technology (ICT) has not been a part in Physics learning. This is contrary to the curriculum demanded by the government which states that the learning process in the curriculum 2013 lays the subjects of ICT as a means of learning in all subjects that is integrated in all subjects (Simanjuntak, 2013). Deservedly technology is integrated into the curriculum in all rankings (Adams, 2016; Cherup, 2004; Passey & Samways, 2016).
The descriptions of teacher interviews and students' outcomes state that they need infographic media and agree that the concept of kinematics of rectilinear motions is best suited to be taught with the help of visual media. This is consistent with research conducted by Yildirim, Celik, & Aydin (2014) which states that visuals also allow situations to be displayed and information to be presented in an organized manner using visual components.
Information and communication technologies are involved in all aspects in a very intensive and interesting way based on their status as objects and media (Silverstone & Hirsch, 2003, p.21). Infographics are a new medium known to the respondents, which is a combination of interesting graphs, drawings and colors, which can be applied in physics teaching the concept of kinematics of rectilinear motions, since most textbooks of Physics lessons are dominated by text only and practice questions about this concept are often related to graphs. Respondents were eager to use infographics to facilitate them in understanding a concept and this was confirmed by Noh & Son (2015), which states that infographics can improve students' understanding in schools, both scientific concepts and communication skills by enhancing the ability of visual thinking, which has a positive impression on achievement and attitude toward academic science.
Learning by using infographic media that will be designed and developed using a smartphone as a learning tool and social media facebook as a means to access the media will enable students to get the media. This makes learning Physics more flexible and provides opportunities for students to learn independently. Students need a medium that can replace the role and function of teachers as the only source and learning media that can be used independently, enjoy, anytime, anywhere and complete (Apriyanti, Umar, & Tandililing, 2015).
Conclusion
Based on observation data, document analysis, and interviews show that there are still difficulties in learning and teaching experienced by students and teachers of Physics on the concept of linear motion kinematics. In addition, there is no learning media for Physics that can be used to support the teaching and learning process of Physics. Infographics are new media developed with computer technology, where interesting combinations of graphics, images and colors can be applied in teaching Physics, because most Physics lesson text books are dominated by text only and practice questions about Physics concepts are often associated with graphs. Therefore, based on data analysis on media infographic needs in Physics learning, it can be concluded that all Physics students and teachers in Sambas District really need technology-assisted infographic media in the teaching and learning process specifically for teaching. the concept of square motion kinematics. This must be considered for smoothness and facilitating the learning of Physics in high school.
Infographic media required is an infographic that can be displayed with a smartphone because the smartphone will be a tool for students to learn independently and make learning more flexible, because it can be implemented anywhere and anytime. For the purposes of this paper, smartphone assisted learning is understood as a place where work is seen as an activity that does not have to be tied to a specific place to influence dynamic and mobile work life (Skogland, 2017). Infographics will be disseminated through social media, namely facebook so that students are easy to get the infographic.
www.mojet.net
Suggestions
From the research that has been done, there are some findings that can be used as a reference in the development of Physics learning media. Infographic media should be developed to facilitate students in understanding the concept of kinematics of rectilinear motion. The suggestions in this research is the need analysis for infographic media on Physics learning can be done to students and teachers to identify the integration of technology in the learning media needs and adjust the learning styles of learners. For other research, in order to analyze the needs of this infographic media with different methods and respondents, as well as doing further research that is developing infographic media to help high school students in Physics learning especially the concept of kinematics of rectilinear motion. It is expected that this media can be used as an alternative media by teachers and or students to facilitate the students in understanding the concept.
ACKNOWLEDGEMENTS
This paper is based on a research “Development of infographic media for learningkinematics of rectilinear motions concept instudents senior high school in Indonesia” funded by Indonesia Endowment Fund for Education (LPDP).
REFERENCES
Aagaard, J. (2015). Drawn to distraction: a qualitative study of off-task use of educational technology. Computers & Education, 87, 90-97. https://doi.org/10.1016/j.compedu.2015.03.010
Adams, S. C. (2016). Improving Teacher Comfort Levels and Self-Efficacy with Technology Integration and Application of Technology into the Elementary Education Curriculum through the Tech Buddy Program (Doctoral dissertation, Lindenwood University). Retrieved April 3, 2017, from
http://search.proquest.com/openview/d27a718ce36b3fdf9fbf63c177677b10/1?pq-origsite=gscholar&cbl=18750&diss=y
Ali, A. B., & Saud, M. D. M. S. B. (2013). Fasa Awal: Pembentukkan Kerangka Pembinaan Modul Bahasa C Berteraskan Model Integrasi Pembelajaran Berasaskan Masalah dan Pendidikan Berteraskan Kompetensi. Retrieved March 4, 2017, from http://www.fp.utm.my/epusatsumber/listseminar/ medc2012/pdf/102.pdf
Ali, M. (2010). Metodelogi dan aplikasi riset pendidikan. Bandung: Universitas Pendidikan Indonesia.
Apriyanti, N., Umar S., & Tandililing E. (2015). Pengembangan media pembelajaran fisika untuk perolehan belajar konsep kinematika gerak lurus di kelas X SMA. Jurnal Pendidikan dan Pembelajaran, 4(3). Baran, M. (2016). An Analysis on High School Students' Perceptions of Physics Courses in Terms of Gender (A
Sample from Turkey). Journal of Education and Training Studies, 4(3), 150-160. https://doi.org/10.11114/jets.v4i3.1243
Bogdan, R.C., & Biklen, S.K. (1982). Qualitative research for education : An. introduction to theory and methods. Boston: Allyn and Bacon, Inc.
Bollen, L., De Cock, M., Zuza, K., Guisasola, J., & van Kampen, P. (2016). Generalizing a categorization of students’ interpretations of linear kinematics graphs. Physical Review Physics Education Research, 12(1), 010108. https://doi.org/10.1103/PhysRevPhysEducRes.12.010108
Boyatzis, R. E. (1998). Transforming qualitative information: Thematic analysis and code development. Sage. Broadie, R. (2003). Measuring impacts and benefits of ICT-for-learning. Computer Education, 105, 3-khaus (1972). Meaning of Physics. In Druxes, H., Born G., & Siemsen, F. (1986). Kompedium Didaktik Fisika. Bandung: Remadja Karya.
Bruno, A., & Dell’Aversana, G. (2018). Reflective practicum in higher education: the influence of the learning environment on the quality of learning. Assessment & Evaluation in Higher Education, 43(3), 345–358.
www.mojet.net https://doi.org/10.1080/02602938.2017.1344823
Cherup, S. M. (2004). Integrating technology into teacher education. Dlm Kalantzis, M., & Cope B, p.54. The Eleventh International Literacy and Education Research Network Conference on Learning. Australia: Common Ground Publishing.
Cohen, J. (1968). Weighted Kappa – a nominal scale aggreement with provision for scaled disagreement or partial credit. Psychological Bulletin, 70: 213-220. In Zamri Mahamod & Noriah Mohd Ishak. 2003. Analisis Cohen Kappa dalam penyelidikan bahasa – satu pengalaman. Kertas Kerja Seminar Penyelidikan Guru Peringkat Kebangsaan. Anjuran Bahagian Pendidikan Guru, KPM.
Creswell, J. W. (2014). Researh design: Qualitative, quanitative, and mixed methods approaches (4rdEd.). Los Angeles, CA: Sage Publications, Inc.
Daniel. E. G. S. (2004). Penggunaan laman Web pakar: masa depannya dalam pendidikan Sains. Dlm. Idris, N., Daniel, E. G. S, & Saat, R. M., Teknologi dalam pendidikan Sains dan Matematik (p.93-120). Kuala Lumpur: Universitas Malaya.
Dinas Pendidikan Kabupaten Sambas Indonesia. 2016. Hasil ujian nasional mata pelajaran Fisika selama empat tahun terakhir. Sambas: Disdik Sambas.
Ertmer, P. A. (2005). Teacher pedagogical beliefs: The final frontier in our quest for technology integration?. Educational technology research and development, 53(4), 25-39. https://doi.org/10.1007/ BF02504683
Fitri (Desember 5, 2013). Skor PISA: Posisi Indonesia nyaris jadi juru kunci. Kementrian Riset, Teknologi, dan Pendidikan Tinggi (RISTEKDIKTI). Retrieved January 15, 2017, from http://www.kopertis12. or.id/2013/12/05/skor-pisa-posisi-indonesia-nyaris-jadi-juru-kunci.html
Funkhouser, C. (1993). The influence of problem-solving software on student attitudes about mathematics. Journal of Research on Computing in Education, 25(3), 339-346. https://doi.org/10.1080/08886504.1993.10782055
Glasgow, D. (1994). Information Illustration. Addison: Wesley Publishing Company.
Grabe, M., & Grabe, C. (2004). Integrating technology for meaningful learning (4th ed.) Boston, MA: Houghton.
Guest, G., MacQueen, K. M. & Namey, E. E. 2012. Applied Thematic Analysis. SAGE Publications. Hashim, Y. 1997. Media pengajaran untuk pendidikan dan latihan. Shah Alam: Fajar Bakti Sdn. Bhd.
Haq, A. A. J. (2017). Penerapan model cooperative learning tipe picture and picture menggunakan media audio visual untuk meningkatkan hasil belajar siswa mengenai menghargai keragaman suku bangsa dan budaya (Penelitian Tindakan Kelas pada Pelajaran Ilmu Pengetahuan Sosial Kelas V SD Negeri Gentra Masekdas Bandung) (Doctoral dissertation, FKIP UNPAS).
Henderson, A. H. (1992). Technology and teacher education: Paradigm shift in instruction? In D.Carey, R. Carey, D. A. Willis, and J. Willis (Eds.)Technology and teacher education 1992 (pp. 612-615). Charlottesville, VA: Association for the Advancement of Computing in Education.
Hofkins, D. (2014). Schools and students need more space to foster creativity. Zurich School Competition. Retrieved November 1, 2016, from https://www. theguardian.com/teacher-network/zurich-school-competition/school-students-creativity-school-wed-like-competition
Keengwe, J. & Anyanwu, L. O. (2007). Computer Technology: infused learning enhancement. Journal of Science education and technology, 16(2), 387-393. https://doi.org/10.1007/s10956-007-9067-1 Kern, E. (2013). Three truths about the visual web we can learn. We heart it. GigaOM. Retrieved January 12,
2017 from https://gigaom.com/2013/07/02/three-truths-about-the-visual-web-we-can-learn-from-we-heart-it/
Khan, A. R. A. M. (2009). Guru sebagai penyelidik. Kuala Lumpur: PTS Professional.
www.mojet.net Krum, R. (2013). Cool infographics: effective communication with data visualization and design. John Wiley
& Sons.
Landis, J. & Kosh, G.G. 1977. The measurement of observer agreement for categorical data. Biometrics, 33:159-174. In Zamri Mahamod & Noriah Mohd Ishak. 2003. Analisis Cohen Kappa dalam penyelidikan bahasa – satu pengalaman. Kertas Kerja Seminar Penyelidikan Guru Peringkat Kebangsaan. Anjuran Bahagian Pendidikan Guru, KPM.
Lyra, K. T., Isotani, S., Reis, R. C., Marques, L. B., Pedro, L. Z., Jaques, P. A., & Bitencourt, I. I. (2016, July). Infographics or graphics+ text: which material is best for robust learning?. In 2016 IEEE 16th International Conference on Advanced Learning Technologies (ICALT) (pp. 366-370). IEEE. 10.1109/ICALT.2016.83
Maryani, E. (2017). Peningkatan Kualitas Pelayanan Perpustakaan Untuk Digital Native Generation (Perspektif Perubahan Karakter Pemustaka di Era Digital). Prosiding Komunikasi, 1(1). Retrieved June 2, 2017, from http://jurnal.fisip.unila.ac.id/index.php/prosidingkom/article/viewFile/236/137
McCawley, P. F. 2015. Methods for Conducting an Educational Needs Assessment: Guidelines for Cooperative Extension System Professionals. Moscow: University of Idaho.
McNeil, J., & Borg, M. (2018). Learning spaces and pedagogy: Towards the development of a shared understanding. Innovations in Education and Teaching International, 55(2) 228–238. https://doi.org/10.1080/14703297.2017.1333917
Miles, M. B., & Huberman, A. M. (1994). Qualitative data analysis: An expanded sourcebook. 1994. Beverly Hills: Sage Publications.
Motlhabane, A. (2016). LEARNER'S ALTERNATIVE AND MISCONCEPTIONS IN PHYSICS: A PHENOMENOGRAPHIC STUDY. Journal of Baltic Science Education, 15(4).
Napilupulu, E. L. (December 14, 2012). Prestasi Sains dan Matematika Indonesia menurun. Kompas_Edukasi. Retrieved January 15, 2017 from http://edukasi.kompas.com/read/2012/12/14/09005434/Prestasi. Sains.dan.Matematika.Indonesia.Menurun
Newsom D., & Haynes J. (2004). Public Relations Writing: Form and Style. Boston, MA : Wadsworth Cengage Learning, c2011.
Noh, S. M., & Son, J. (2015). The Effect of Physics Instruction Using Infographics Based on Visual Thinking in High School. Journal of The Korean Association For Science Education, 35(3), 477-485. https://doi.org/10.14697/jkase.2015.35.3.0477
Passey, D., & Samways, B. (Eds.). (2016). Information Technology: supporting change through teacher education. Springer.
Pearson. 2014. The Learning Curve: League Table. Retrieved January 15, 2017, from http://thelearningcurve.pearson.com/2014-report-summary/
Pegrum, M. (2016). Future directions in mobile learning. In D. Churchill, J. Lu, T. K. F. Chiu, & B. Fox (Eds.), Mobile learning design: Theories and application (pp. 413–431). Singapore: Springer. https://doi.org/10.1007/978-981-10-0027-0_24
Rainie, L. (2012). Photos and videos as social currency online. Report: Pew Internet & American Life Project. Retrieved January 12, 2017 from http://pewinternet.org/Reports/2012/Online-Pictures/Main-Findings
Richey, R. C., & Klein J. D. (2007). Design and development reseach: methods, strategies, and issues. London: Lawrence Erlbaum Associates.
Roblyer, M. D. (2006). Integrating educational technology into teaching (4tn ed.). Upper Saddle River, NJ: Prentice.
Rofalina, F. (2015). Infografik: Pelajaran Paling Disukai dan Dibenci Siswa Indonesia. Zeius Blog. Retrieved October 5, 2016, from https://www.zenius.net/blog/ 7657/pelajaran-favorit-dibenci-siswa-indonesia
www.mojet.net Sadiman, A. S., Raharjo R., Haryono A., & Rahardjito (2012). Media pendidikan: Pengertian, pengembangan,
dan pemanfaatannya. Jakarta: Raja Grafindo Persada.
Samudra, G. B., Suastra, I. W., & Suma, K. (2014). Permasalahan-Permasalahan yang Dihadapi Siswa SMA di Kota Singaraja dalam Mempelajari Fisika. Jurnal Pendidikan IPA, 4(1).
Skogland, M. (2017). The mindset of activity-based working. Journal of Facilities Management, 15(1), 62–75. https://doi.org/10.1108/JFM-05-2016-0016
Silverstone, R. & Hirsch, E. (2003). Consuming technology media and information in domestic spaces. London: Routledge.
Simanjuntak, D. (2013). Peranan Teknologi Informasi dan Komunikasi dalam Kurikulum 2013. Jurnal Pendidikan Penabur, 78. Retrieved June 2, 2017, from http://bpkpenabur.or.id/wp-content/uploads/ 2015/10/jurnal-No21-Thn12-Des 2013.pdf#page=85
Siraj, S., & Alias, N. (2006). Malaysian secondary students’ preference in learning physics: Implication to the teaching strategies. The International Journal of Learning, 10, 3559-3572. Retrieved September 29, 2016, from http://www. Learning-Journal.com
Slamet, S. (2016). Memperkokoh Jalinan Tripusat Pendidikan (Keluarga, sekolah, masyarakat) Dalam Membangun Manusia Indonesia Seutuhnya.
Stiggins, R. J. (2010). Conquering the formative assessment frontier. In J. H. McMillan (Ed.), Formative classroom assessment (pp. 8-28). New York, NY: Teachers College, Columbia University.
Sugiyono (2009). Metode Penelitian Bisnis (Pendekatan Kuantitatif, Kualitatif, dan R&D). Bandung: Alfabeta. Sugiyono (2012). Metode Penelitian Pendidikan Pendekatan Kuantitatif, Kualitatif dan R&D. Bandung:
Alfabeta.
The National Foundation for Educational research [NFER] (2011) Exploring young people’s views on science education. London: Wellcome Trust.
Tim PIRLS Indonesia. 2016. Survey internasional PIRLS. Kementerian Pendidikan dan Kebudayaan. Retrieved January 15, 2017, from http://litbang.kemdikbud. go.id/index.php/survei-internasional-pirls
Trikusyanti, R. N., & Ruwanto, B. (2010). Analisis Isi Media Pembelajaran Berbasis Komputer Produksi Pustekkom Depdiknas. Retrieved September 8, 2016, from https://scholar.google.co.id/scholar?hl= id&q=Analisis+Isi+Media+Pembelajaran+Berbasis+Komputer.doc&btnG=
Tsai, K. F., & Fu, G. (2016). Underachievement in Gifted Students: A Case Study of
Three College Physics Students in Taiwan. Universal Journal of Educational Research, 4(4), 688-695. DOI: 10.13189/ujer.2016.040405
Walter, E. (2012). The rise of visual social media. Fast Company, August 28. Online: http://www. fastcompany.com/3000794/rise-visual-social-media
Watts, L. L., Todd, E. M., Mulhearn, T. J., Medeiros, K. E., Mumford, M. D., & Connelly, S. (2016). Qualitative Evaluation Methods in Ethics Education: A Systematic Review and Analysis of Best Practices. Accountability in Research, (just-accepted).
Welch, W. W., & Walberg H. J. (1972). A National Experiment in Curriculum Evaluation. American Educational Research Journal 9(3), pp. 373-383. Retrieved October 5, 2016, from http://www.jstor.org/ stable/pdf/1161753.pdf https://doi.org/10.3102/00028312009003373
Wulandari, E., & Sukirno, S. (2012). Penerapan Model Cooperative Learning Tipe Student Teams Achievement Division (Stad) Berbantu Media Monopoli Dalam Peningkatan Aktivitas Belajar Akuntansi Siswa Kelas X Akuntansi 2 Smk Negeri 1 Godean Tahun Ajaran 2011/2012. Jurnal Pendidikan Akuntansi Indonesia, 10(1).
Yildirim, S., Yildirim, G., Celik, E. & Aydin, M. (2014). Student opinion about infographics design process. Journal of Research in Education and Teaching, 3(4), 247-255.
www.mojet.net Yildirim, S. (2016). Infographics for Educational Purposes: Their Structure, Properties and Reader Approaches.
TOJET: The Turkish Online Journal of Educational Technology, 15(3).