Dynamic Image Stitching for Panoramic Video
Jen-Yu Shieh
*, Yu-Ching Liao,
Guo-Jyun Lioao, and
Yu-Ting Liou
Department of Electro-Optics Engineering, National Formosa University, Yunlin County, 632, Taiwan.
Received 23 January 2014; received in revised form 13 June 2014; accepted 19 July 2014
Abstract
The design of this paper is based on the Dynamic image titching for panoramic video. By utilizing OpenCV
visual function data library and SIFT algorithm as the basis for presentation, this article brings forward Gaussian
second differenced MoG which is processed basing on DoG Gaussian Difference Map to reduce order in synthesizing
dynamic images and simplify the algorithm of the Gaussian pyramid structure. MSIFT matches with overlapping
segmentation method to simplify the scope of feature extraction in order to enhance speed. And through this method
traditional image synthesis can be improved without having to take lots of time in calculation and being limited by
space and angle.
This research uses four normal Webcams and two IPCAM coupled with several-wide angle lenses. By using
wide-angle lenses to monitor over a wide range of an area and then by using image stitching panoramic effect is
achieved. In terms of overall image application and control interface, Microsoft Visual Studio C# is adopted to a
construct software interface. On a personal computer with 2.4-GHz CPU and 2-GB RAM and with the cameras fixed
to it, the execution speed is three images per second, which reduces calculation time of the traditional algorithm.
Keywords: image stitching, panoramic image, image matching, SIFT algorithm, OpenCV visual function library
1.
Introduction
Currently, video conferencing with panoramic function is rarely observed on the market. Normally, projects that promote
panoramic view conference are usually achieved by camera equipped with stepping motor that can conduct 360 degree circular
movement. Even though with 360 degree movement any given corner in the conference venue can be seen, but the limitation of
one camera making it to be restricted to around 40 degrees. At the same time, the other 320 degree parameter cannot be
observed instantaneously. In the turning process of the camera, the observing person can sometimes suffer from visual dizziness,
tiredness and various other defects. To improve on such imperfection, this system brings forward the utilization of 1 ~ 6
wide-angle cameras to observe the entire venue of the conference. Six dynamic cameras with image stitching software can
achieve the effect of panoramic vision and provide a panoramic display. A number of cameras required can also be adjusted to
follow the actual seating arrangement. Not only the panoramic video conferencing have the effect of presence, simple operation
and management, but most importantly, the construction cost is far lower than the panoramic view video conferencing product
from other providers.
*Corresponding author. E-mail address: [email protected]
2.
Mechanics of Static Imagery
2.1. Preface
To make the dynamic image stitching technology from happening it is necessary to start from static image stitching,
finding highly stable method that is not affected by outside source to suit dynamic image stitching. The purpose of this section
is to prove that the use of Scale Invariant Feature Transform (SIFT) method is enough to cater the variation in human movement
image during video conferencing, then conduct matching based on the matched feature points between images and then stitching
them.
2.2. System framework
(1) Hardware requirement: two video conferencing video and two customized support bracket structure. The cameras are
supported by two customized bracket supports. The base of the supports is circular and the distance between the two is 3 to
5 centimeters in distance to conduct filming and reserve around 10 to 15% image overlap, which would allow a maller
likelihood for error.
(2) Software requirement: Microsoft Visual Studio C#.
2.3. The theoretical foundation of feature description of SIFT algorithm
SIFT (Scale Invariant Feature Transformation) is an algorithm of computer vision for the detection of partial
characteristic of the image described. It is brought forward by David Lowe [1], and it searches for the extreme points in the
spatial scale and bring forward its position, scale, and rotation invariants. The purpose of the SIFT is to improve the corner
detection method [2] brought forward by Chris Harris and Stephens, which cannot solve the shortcoming of scale invariability.
With this method, all calculation is established within the scale space, with four categorization procedures:
(1) Detecting extreme value within the scale space
Using the scale space brought forward by Witkin [3] in 1983 which has the implication of simulating the change in
distance, allowing single image file to be transformed into more identifiable data which can be used to find stronger features.
Koenderink[4] (1984) and Lindegberg[5] (1994) have broughtforward the function of Gaussian scale space, with scale space
function L as follows:
(1)
(2)
where, * is convolution, l(u,v) is the image input, is a parameter of Gaussian function, the larger this value, the more
fuzzy the image will become. u is the horizontal more fuzzy the image will become. u is the horizontal coordinate and v is the
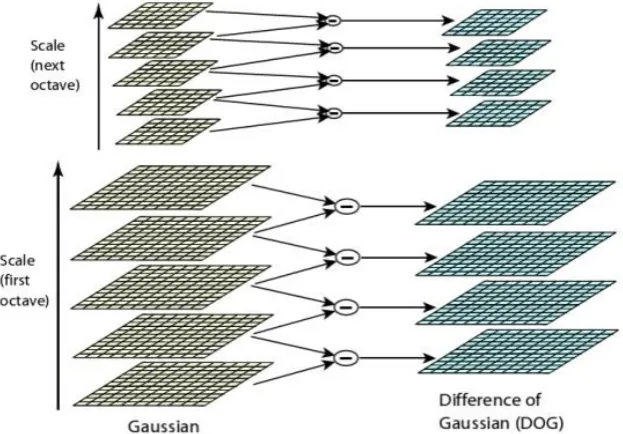
vertical coordinate of the image. To construct a dimensional space, the method of realization is Difference of Gaussian Filter
(DoG). The main concept is that using two different variances of the Gaussian Filter to process the original image, resulting in
two images with different level of fuzziness. Then let these two images to subtract each other, which is known as the Difference
262 International Journal of Engineering and Technology Innovation, vol. 4, no. 4, 2014, pp. 260 - 268
Fig. 1 Scale space diagram with different variance and resolution
After Scale space is generated, all extreme points that can be the feature points should be found. The method of searching
for extreme point is shown by Figure 2. Within the diagram, the position of the pixel of X, after being processed by the
Difference of Gaussian Filter, a contrast of the extreme values is made to 26 points which are in the neighborhood of a different
scale space to this position. If such stands, they are then the extreme points.
Fig 2 Illustration of search for regional extreme value
Mikolajczyk [6] brought forward the concept of using Laplace function to find feature point with the same stability, but
would take up a much longer time frame. Whereas Lowe used Difference of Gaussian value to replace the Laplace function.
Even though there is a small difference but saved quite a lot of time. Algorithm of the Difference of Gaussian Function is as
follows:
(3)
where, K is a multiple of parameter in the control scale space, while L is scale space which is the result from the
convolution of the image and Gaussian Function, indicating the fuzzy image can be generated by conducting low-pass to the
image. D is the Gaussian Function. As for the image generated by Difference of Gaussian function, it is generated by letting
fuzzy images of different value to subtract each other. The difference of each image is k, which means that if more images are
taken in each level, the difference in every scale space will become smaller. If the number of images taken from each level is s+3,
(2) Direction assignment
Assign a range in the scale space whether the feature point is located, quantify the pixels of the range, and input the value
of each scale space of the pixels to gain the size and direction of the gradient. Firstly, calculate all the border direction and size
of the pixels that are nearby the feature points, as shown by equations (4) and (5); count all the directions in that particular region,
and use the majority vote method to determine the main border direction of that feature point. If the border direction is to be
contrasted with other images, the original image is transformed into this type of partial image for the purpose of matching in
order to achieve the aim of rotation without change.
(4)
(5)
where, L is the scale space, and (u,v) is the coordinate of the space where it is located. Find out the size and direction the
gradient of the feature point’s neighborhood, the primary direction of the feature point by using statistical method, and cut up the
angle into 36 grids with 10 degrees per grid. Such is the horizontal axis of the histogram. Use feature point as the center and
calculate the size and direction of the gradient around it and obtain Gaussian weighting with accumulation method. The farther
the point, the size of the gradient has to be multiplied by a smaller weighting, the of which is 1.5 times of the of the scale
space where it is located.
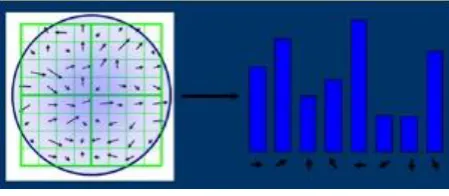
(3) Partial image descriptor
After the location, scale, and primary direction of the feature points are figured out, these features are further described by
rectangular bar chart which takes direction as the target. With this method, the feature point and its 8x8 pixel neighborhood are
cut up into four subsections of 4x4 pixels. The statistic chart of direction of each subsection is shown as Figure 3.
Fig. 3 Characteristic Point primary direction
2.4. Image matching and stitching
In the process of image connection, one image is firstly stabilized, using geometric transformation matrix to transform
and adjust another image through horizontal moving, rotating, enlarging or reducing, so as to find the best position of
connection for the stitching of the first image, in order to construct the mathematical relationship of the pixel coordinates
between images. Transformation can be distinguished as affine transformation and transmission conversion. This study uses
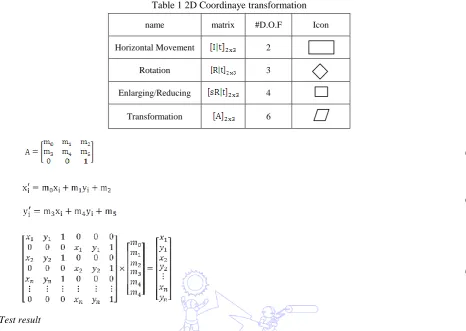
affine transformation as the model for the transformation of pixel coordinate between the images. Affine transformation model
is a two-dimensional matrix A with 6 unknown parameters, as shown by equation 6, where the corresponding relationship of the
pixel coordinates of the left and right images are presented by equation 7. In order to figure out the 6 unknown parameters [7],
an equation with even number n is required, as shown by equation 8. To construct such equation, it is required that the point
pairs obtained earlier are used, with at least 3 sets are input (n>=3). When the system is over-determined, a method resolving the
Eigen value should be used to figure out the minimum error. If the point pairs found are incorrect, then the quality of matching
264 International Journal of Engineering and Technology Innovation, vol. 4, no. 4, 2014, pp. 260 - 268 Table 1 2D Coordinaye transformation
name matrix #D.O.F Icon
Horizontal Movement 2
Rotation 3
Enlarging/Reducing 4
Transformation 6
(6)
(7)
(8)
2.5. Test result
First of all, Figure 4 shows two images taken by CCD films from different positions and find feature points. Secondly,
Figure 5 shows the Matching relations line. Finally, Figure 6 is the stitching of the two images and Figure 7 will test SIFT
stitched the number of seconds. Such static image stitching for the images were processed by the method brought forward by
section 2.3 with the camera set up per the method accounted in section 2.2.
Fig 4 CCD filming two images from two different positions
Fig 5 Matchingrelationsline
Fig 7 TestSIFTstitchedthenumberofseconds
3.
Reserch Methodology of Dynamic Image Stitching
3.1. MSIFT algorithm
Even though SIFT algorithm is the faster method among similar type of algorithms, it is still short on dynamic image
stitching. Currently, the research that focus on SIFT algorithm to improve speed mainly rest on the dimension number of the
SIFT vector. At the same time of increasing the calculation speed, such would also lead to the reduction in accuracy of SIFT.
When using a chart of pair DoG Gaussian Difference to reduce order, the result of the MoG is one layer less than that of the DoG,
while by developing Gaussian Filter difference chart DoG to conduct one more differential function on Gaussian Filter
Difference chart, the Gaussian Difference function below is generated.
(9)
Conduct one more differential function to obtain second-order Gaussian Difference function.
(10)
The Gaussian second-order difference function is used to simplify the pyramid structure and boost the speed of
calculation, while the detection operator for the MoG feature is derived from DoG Gaussian Differential chart. According the
theory of Geometry, the partial extreme value point of the original function is the zero point of this function’s first-order
derivative function. Hence it is clear that the maximum and minimum value obtained from the partial of the scale space diagram
is in fact the zero point of this function’s first-order derivative function. Due to the fact that the zero point feature is easier to
detect than the extreme value point, hence, the zero point obtained from the first-order function of the scale space diagram
serves to replace the partial extreme value point, and the zero point of Gaussian second-order difference function also
substitutes for the extreme value point of Gaussian first-order difference function so as to confirm the feature point.
Subtract the neighboring two layers within the same order of the DoG pyramid to be a layer in MoG. The scale of that
layer is that of the subtrahend in the scale of the DoG pyramid, hence, the counts of levels included by every level of the MoG
pyramid is one level less than that of the DoG.
3.2. Description and matching of the feature point
After the extraction of the feature point by the MoG feature point detection operator, this study utilized descriptive
operator and matching algorithm same as the feature matching algorithm of SIFT to describe and match the feature points,
which formed an improved feature matching algorithm of SIFT based on the MoG feature point detection operator. The
advantage of the MoG lies in the ability in simplifying Gaussian Pyramid structure and increases the calculation speed. Due to
the fact that the examination of extreme value is processed within 3×3×3 three dimensional space, while the zero point
examination can be conducted in a two dimensional plane, hence clearly, when the MoG operator constructing the MoG
pyramid, each order can neglect one layer of Gaussian filter image, which accounts for the reason of boost in calculation speed.
Use MSIFT do the stitching time can be reduced to about 0.7 seconds although because of the capture of the feature points Less
266 International Journal of Engineering and Technology Innovation, vol. 4, no. 4, 2014, pp. 260 - 268 3.3. Overlapping segmentation method
First image one and image two divided into four equal parts ABCD to do cutting, extracted from BC to do stitching,
reducing to find the feature points of time. BC was sutured to the use of images to Figure A Figure BC Figure C Figure do then,
greatly improve the operating speed.
Fig. 8 MSIFT match overlapping segmentation method time test
By the experiment can be seen MSIFT with overlapping cutting to do the stitching time can be reduced to about 0.2 to
0.3seconds, than the SIFT algorithm significantly reduces the computation time.
4.
Testing Result
This software program can be partnered with the cameras to solve the restriction on the field of vision of CCD camera
angle when its development by utilizing Microsoft Visual Studio C# software is finished, it actually uses CCD camera to capture
photographic images, and its feasibility is proved through examination. Some camera lens related work can be found on
[10]-[11].
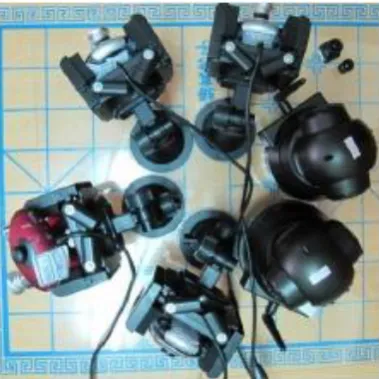
4.1. Setup of cameras
This study brings forward the method for camera setup, even with four average CCD and two IPCAM the desired effect
can be produced The cameras are arranged in circular shape, the distance between the left and right cameras is between 3 to 5
centimeters; the overlapping area of the region is adjusted to 10 to 15%; each camera is set in circular diverging angle on an
acrylic board. Figure 9 shows the actual camera setup.
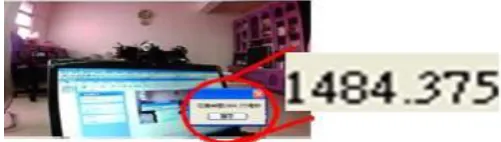
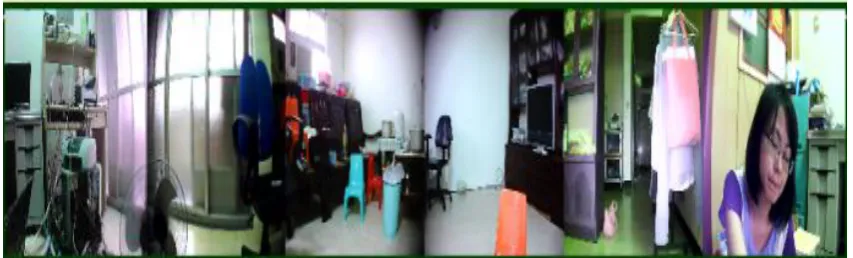
4.2. Testing result
Through the use of the webcam to display the actual images, the interface program awaits the user to press the stitching
button. After the stitching button has been pressed, the system will transform the image that has been stitched into AVI
recording instantaneously and begin recording, and the actual test is shown by Figure 10.
Fig. 10 Illustration of actual test on panoramic view
5.
Conclusions
5.1. Conclusion
This study brings forward the production of “Dynamic Panoramic Image Stitching System” based on feature contrast of
SIFT.For the synthesis of images, this article proposes order reduction for Gaussian second-order difference based on the DoG
Gaussian Differencing diagram, which simplifies the algorithm of Gaussian pyramid structure, MSIFT match overlapping
segmentation method to simplify the scope of feature extraction in order to increase speed and improves on the time required for
traditional image synthesis method and the shortcoming arising from being affected by the angle of the space. The result of the
experiment shows that the feasibility of this research based on the methodology brought forward not only let the user benefits
from the sense of presence and simple management as well as ease of operations, but most importantly, the cost of setup is way
lower than that of other providers of panoramic conferencing product.
5.2. Characteristics of this study
The “Dynamic Panoramic Image Stitching System” brought forward by this study has the benefits of cost effectiveness,
easy access, simple operation, plug-and-play and so on. This system uses a CCD camera that costs NT $179, a 3D capable
camera of NT $599, and an IPCAM of NT $1,600. The total amount is NT $2,736. The setup of the three types CCD mix proves
that even the CCDs have different brand, they can capture images. It is all simplified into the push of a button without
complicated interface. The CCD that uses USB port is suited to the Windows XP and Windows 7 systems without other
softwares.
Table 2 The distinguishing feature of this system
Full view conferencing developed by Microsoft
IPCAM full view conferencing developed by Yi-Hua technology
180 degree adopted by
Fung-Jia IT team This system
Low cost NT $149,000 Around NT $100,000 Not available NT $2,500
Easily accessible Require specialized
hardware Require specialized hardware
Wide angle camera needs to be greater than 90 degrees
Average household camera
applicable
268 International Journal of Engineering and Technology Innovation, vol. 4, no. 4, 2014, pp. 260 - 268
References
[1]D. G. Lowe, “Distinctive image features from scale-invariant keypoints,” International Journal of Computer Vision, vol. 60,
no. 2, pp. 91-110, 2004.
[2]C. Harris and M. Stephens, “A Combined Corner and Edge Detector,” Proc. Alvey Vision Conf., 1988, pp. 147-151. [3]M. Kass, A. Witkin, and D. Terzopoulos, “Snake: Active contour models,” International Journal of Computer Vision, vol.
1, no. 4, pp. 321-331, 1988.
[4]J. J. Koenderink, “The structure of images,” Biological Cybernetics, vol. 50, no. 5, pp. 363-396, 1984.
[5]T. Lindeberg, “Scale-space theory: A basic tool for analyzing structures at different scales,” Journal of applied statistics, vol. 21, no. 1, pp. 225-270, 1994.
[6]T. Tuytelaars and K. Mikolajczyk, “Local invariant feature detectors: A survey,” Foundations and Trends in Computer
Graphics and Vision, vol. 3, no. 3, pp. 177-280, 2008.
[7]W. K. Tang, T. T. Wong and P. A. Heng, “A system for real-time panorama generation and display intele-immersive applications,” IEEE Trans. On Multimedia, vol. 7, no. 2, pp. 280-292, 2005.
[8]B. Matthew and D. G. Lowe, “Automatic panoramic image stitching using invariant features,” International Journal of
Computer Vision, vol. 74, no. 1, pp. 59-73, 2007.
[9]R. Szeliski, “Image alignment and stitching: A tutorial,” Foundations and Trends in Computer Graphics and Vision, vol. 2, no. 1, pp. 1-104, 2006.
[10]J. Y. Shieh and M. N. Lee, “Analysis of flare and ghost on full view lens,” International Journal of Engineering and Technology Innovation, vol. 1 no. 1, pp. 27-34, 2011.