http://www.sciencepublishinggroup.com/j/ijefm doi: 10.11648/j.ijefm.20190705.11
ISSN: 2326-9553 (Print); ISSN: 2326-9561 (Online)
The Impact of Local Sector Information on the Performance
of Single Listed Foreign Stocks
Muhammad Shirajul Islam
IPE Capital Limited, Dhaka, Bangladesh
Email address:
To cite this article:
Muhammad Shirajul Islam. The Impact of Local Sector Information on the Performance of Single Listed Foreign Stocks. International Journal of Economics, Finance and Management Sciences. Vol. 7, No. 5, 2019, pp. 142-161. doi: 10.11648/j.ijefm.20190705.11
Received: July 25, 2019; Accepted: August 27, 2019; Published: October 23, 2019
Abstract:
Being an instrument for international diversification, the populations of Single listed foreign stocks are growing in major capital markets. Since this is a new trend of foreign listing, both investors and issuers may have concerns about the characteristics of these stocks. This paper focuses on thesetypes of stocks from two different sectors (HealthCare and Technology) which are originated from PRC (Peoples Republic of China) and listed only on the US markets. The sample employs 24 companies’ stock returns in the period of May 2011 to August 2013. Correlation test and Granger causality test are applied to identify the relationships and beyond that, the Bivariate Co-integration test and Impulse Response Function test are applied to identify the nature of the relationships between the stocks and both the home and the US market (Sector Index). The study reveals that these single listed stocks do not have any long term effect from both the Home and the Foreign trading markets whereas, the stocks are highly responsive towards the shocks from US markets in a very short term.Keywords:
Single Listed Stocks, Foreign Stocks, Foreign Listing, Local Sector Information, Home Market, Foreign Market1. Introduction
Financial markets are the platforms where companies go public to raise equity finance or to sell off or simply, to ‘create a public market in which the founders and other shareholders can convert some of their wealth into cash at a future date’ [1]. Those who go public for equity finance, look for the opportunity to sell off the shares as quickly as possible and at higher price as possible. Therationale for these companies to raise equity capitalis the advantages of the non-requirement for repayment and the non-mandatory regular payment, as opposite to regular interest payments for debts [2]. These advantages reduce the financial leverage distress for the growing companies.
The success of IPOs (Initial Public Offering) is measured by the amount of capital flow into a firm; however, this amount depends upon how a firm is initially judged by market [3]. Therefore at the IPOs companies try to achieve more liquidity by offering an attractive price in an appropriate local or foreign market. Sometime companies choose to list dually in different stock markets in response to increased global commerce and trading and also to reduce
trading cost [4]. Some companies look for opportunities to sell off quickly in foreign market where there is a specific demand for foreign stocks or foreign diversification. Share Issuing costs, exchange rates and local market regulations sometime influence the IPOs, but after flotation on a foreign market only the upcoming information in the market drive the price (according to EMH (Efficient Market Hypothesis)).
From the investors’ point of interest, the purpose of international diversification (through investing in foreign stocks) is to take the advantage of the downside (‘-‘or low) correlation of the stock returns in different markets. But with the recent trend of globalization, when most of the important economies are becoming correlated (positively) to each other because of the increase in the cross border business, the opportunity of international diversification is diminishing. In spite of this, there are still diversification opportunities available from emerging markets which are identifiably independent regionally and/or in respect of the major world markets [6]. These recent characteristics of the emerging markets attract investments from the investors in the developed countries who look for the opportunities for international diversification. Firms from emerging economies try to grab this opportunity to raise finance by issuing shares cross the border to the developed market, either by dually listing their stock in home and foreign market or simply floating individually in the foreign market. For as an instance in 2006, 23.4% of IPOs were from foreign companies in NYSE and in 2007 in LSE foreign IPOs raised $22.7 billion [7].
Many studies have been conducted to test the mutual performance of the dually listed stocks but singly listed foreign stocks’ performance has still remained a subject of deeper focus, to test the efficiency of the markets to price these stocks. The initial aim of this study is to examine the performance of single listed foreign stocks compared to local, similar (same sector) stocks, regarding the reaction to the local market information where the stocks are floated. Earlier diversification was mainly ‘outbound’, where local investors used to invest in foreign markets through brokers or closed-end country funds; but in recent trend of globalization, diversification is becoming more like ‘inbound’, where foreign stocks float in local market and are traded as local common stocks. Therefore, the testing of the single listed stocks’ characteristics should be a matter of interest, these being one of the instruments for international diversification.
Although there are studies which tested pricing anomalies in Country Funds, for instance, Bodurtha, Kim & Lee found in their study that ‘stock prices in Closed-end Country Funds co-move with the US market reflecting the US market specific risk’; but in these Country Funds underlying stocks were mainly listed in the home market [8]. Therefore, the characteristics of single listed stocks can be of concern for both investors and issuers, when investors buy these stocks mainly aiming diversification; and, for the issuers as the convenience of it for the foreign firms to float on a foreign market, while different regulations and transaction costs affect the decision of cross border flotation. If there is any bias present, it could either benefit the issuer or undervalue the shares abnormally; or there could be cases where the foreign shares are presumably always be in a bubble for a short period due to the perception of foreignness and diversification. Mak and Ngaisuggest ‘Firms listed on foreign markets can enhance the marketability of their securities and
have better access to new funds at lower cost’[9]; Therefore this is also an indirect concern of this study to investigate whether the integration of global markets has any impact (positive or negative from the side of the firms) on the foreign IPOs. Fund managers and institutional investors might find the findings of this study supportive for their decision making over the population of their portfolio participants.
2. Review of Relevant Literatures and
Assumptions
In terms of information asymmetry, performance of the stocks may earn or get return from their investments unequally. A study by Kalev, Nguyen & Oh, conducted by separating three types of stocks on the Helsinki Stock Exchange (HEX), which are, single listed, cross listed and internationally well-known stocks, Applying ‘Trading price ratio differences’ and comparing performance by calculating ‘Cumulative returns’ they found in their study that foreign investors have more attention on cross listed and internationally well-known stocks [10]. Therefore, there are fewer gaps in terms of information asymmetry, but in longer term local investors outperform foreign investors except from internationally well-known stocks.
Although in the proposed research, comparing to the above study, the direction of investment is opposite, well-known stocks may have the same effects as it is found in above study due to enough information flow. The above study tests the performances of the stocks where international investors invest whereas, the proposed study to be conducted is to investigate the local investors’ investment in the foreign stocks which is listed in the country of investors local concern.
Studies by Xu & Fung and also Mak & Ngai where bivariate Generalized Autoregressive Conditional Heteroskedasticity (GARCH) model was used to test the data, suggest that dual listed stocks feedback mutually where local stocks transmit information for pricing and the stocks in foreign markets transmit information for volatility [9, 11]. Although this study is conducted for the Chinese stocks only, considering the Chinese stocks to be the most representatives of the emerging markets, it can be identified that how the foreign emerging markets’ stocks are mainly valued with, the underlying risks (β) or the price volatility in the market. If the foreign stocks are single listed, there can be a tendency of foreign investors is to measure the level of risk (β) concerned to the stocks. Therefore, bias is a greater chance when measuring the level of risk either for the general under or over reaction comparing to the reaction to the local information since, the local investors firstly or mainly focus on the local information. AHypothesis can be developed here that,
stocks.
One of the main reasons or probably the only reason for some investors to invest in foreign stocks is international diversification. While globalization is reducing the advantages of international diversification, industry wise diversification remains the only option for the investors to reduce unsystematic risk. The advantage of international diversification dismissed when shares bought of multinational foreign companies, because it can be similar as buying the part of shares of the company’s local (county of investors) business. Therefore, it materially does not appear as foreign stock rather that is a diversified local investment; because of that, it is suggested that investing in the local multinational companies’ stocks seems like much attractive in future [12].
Since the above study suggests globalisation diminishing the attractiveness of the foreign stocks, it can be assumed that, the issuer of the foreign stocks who wish to raise equity capital in foreign markets may acquire the advantages of issuing and transaction costs only in future. This may have an effect on the proposed study results. If the investors value the local and foreign stocks similarly regardless of any risk diversification advantages, foreign stocks will be valued only as per their risk level unless any information asymmetry interferes. But still the impact of over or under reaction may influence the foreign IPOs performance, especially for those that are not of multinational firms. From these indications it can be hypothesised here that,
H2: There is more chance of bias for the foreign stocks’ performance for those companies that operate locally than those that operate beyond the country of origin.
A study by Bell et al. conducted to identify the signalling behind the success of IPOs in foreign market [7]. Using Hierarchical Regression analysis and Hierarchical Moderated Regression, they come to conclusion with the findings that, 1. IPOs success from the countries that protect investors; 2. IPOs success with the good (independent) corporate governance; and 3. Selection of listing market also influences the IPOs success. This study particularly emphasizes on the performance of the single listed IPOs listed on the foreign market and identifies the presence of local markets impacts on the foreign stocks. Local information such as, changes in regulation in hosting country may affect the foreign IPOs, as the new regulations may be added to the foreign companies as over regulation or, it can be more attractive being the new regulation in line with the foreign firms.
An article by Dow Theory Forecast suggests that during January 2006 and May 2007 US investors invested 10 times more in foreign stocks as an effect of previous performance of foreign stocks [13]. The article suggests the growth in foreign stock returns as the result of strong foreign economy and weak US dollar. The second reason suggested here can be of concern for the proposed investigation as the impact of currency risk of the hosting country for the foreign stock. If the hosting country’s currency gets weaker the returns from the foreign IOPs increase which attracts investors then the investors may push the prices up due to higher demand. On
the other hand, investment in multinational companies for diversification may become less attractive comparing to foreign IPOs, as the excess returns can be earn from foreign currencies. An assumption can be drawn here that, ‘The demand for the advantages of currency risk will always push the price up for the foreign IPOs regardless of local or country of origin information’. This hypothesis will be left as a topic of further study while main concern of this study will remain checking for the impacts of hosting market information on the foreign stocks. Therefore, stocks traded in the foreign markets in the hosting markets’ currency will clarify the impacts.
There is another study by Francis, Hasan & Feng which used Regression analysis to investigate the differences in offering and related characteristics between foreign and domestic IPOs [14]. They found that foreign IPOs are more under-priced comparing to the domestic IPOs in US markets. The study reveals that the information asymmetry is being the reason behind foreign IPOs’ under-pricing. This result can be considered of notice for the proposed investigation that the country of origin information is more significant for the foreign IPOs’ performance.
There is a recent study by Chen & Chow on the Merton’s (1987) ‘recognition’ hypotheses which is conducted using Univariate Cross-sectional tests and Cross-sectional Regressions found the supporting evidence that increase in the number of investors with prior knowledge of the firm reduces the rate of required return by reducing ‘shadow cost’ incurred from the lack of knowledge about the firm [15]. Although this study particularly focuses on the under-pricing due to information asymmetry, it also focuses on the advantage of the brand image of companies established by the investors. This may contribute to the proposed study to justify that whether knowledge of local particular sector (beta) has any bias on performance of the similar sector foreign IPOs. Another study in the same line by Minho et al. suggests that investors may mistakenly price foreign securities with reference to the US market index that results the daily ADR (American Depository Receipts) returns to be highly positively correlated with the US stock returns in a very short-term [5]. These suggest, in the case of information asymmetry, local sector information would have a bias on the foreign IPOs’ performance. Any information gaps pose as risk for the foreign IPOs; therefore it can be hypothesised that,
H3: If there is any impact present, the local (sector) information is less significant for the foreign stocks comparing to the country of origin’s (sector) information in long run.
previous study by analysing the results sector wise.
2.1. Conclusion on the Reviews
There are numerous researches that identified that the traditional finance theories are not completely consistent with the real world market characteristics. Behavioural finance tries to explain the deviations from the theoriesarise. There is a tendency that when local market performs badly comparing to foreign markets, investors like to invest in foreign stocks; this can be considered as an opposite reaction of investors to foreign stocks following the signal from the local market. This assumption becomes more significant if it is considered that, all the securities in both local and foreign markets are from the same industry sector. If it is the case, the bias from local information should be more significant on investors’ decision making than the impacts of information asymmetry, to achieve the advantage of international diversification.
There are a large number of researches that were conducted to identify the dynamics of information flows between dual listed stocks; but there are very few academic research articles which examine the performance of single listed foreign IPOs or stocks. Although there are not any literatures that precisely focus on the proposed topic of the research, indeed in the recent trend of increasing population of IPOs in foreign markets drag an interest to justify the choice of the foreign listings and the foreign investments from local markets (from the investors point of view).
2.2. Scope of this Study
From the Hypotheses made in the literature review, Hypothesis one (H1) requires dually listed stocks’ performance tested comparing to the foreign single-listed ones and Hypothesis two (H2) requires single listed stocks of local and multinational companies’ tested in parallel. These two hypotheses extend beyond the scope of this study since the primary interest of this study is to picture whether there is any impact of local sector information on the performance of single listed foreign stocks. Therefore the study will be mainly focusing on testing the Hypothesis three (H3).
3. Data and Methodology
The procedures of data collection for the proposed study and how the methodologies are followed to analyse the data are discussed in this section.
3.1. Proposed Test Model
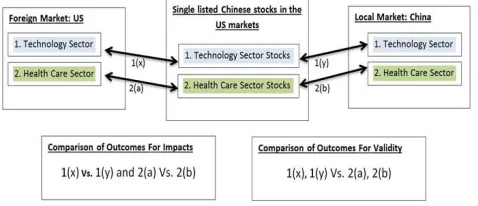
To test the hypothesis three (H3), single listed Chinese stocks in the US markets are chosen because of the maximum availability of data of the proposed type for these. Although the samples are limited to one single originating country, the outcomes of the hypothesis test can be validated by testing data from two different sectors and comparing the results in parallel. Therefore the following model in Figure1is proposed for the study selecting two different sectors, Technology and Health Care.
Figure 1. The proposed model for the Hypothesis test.
3.2. Data
Bodurtha et al. suggest that in a fully integrated market, local (national) risks do not affect prices whereas, in a fully segmented market, only risk associated with the local market factor is priced [8]. Therefore, to avoid any other bias except from the impact of local sector information on the foreign stocks, data is collected from the markets which are least correlated in terms of national economic environments. Meric, Prober, Gong & Meric found in their study that after the 2008 world stock market crash, ‘U.S., European, and Latin American investors would obtain the most portfolio diversification benefit by investing in Asian stock markets, and vice versa.’ [17]. Meric et al. and also Cheung & Miu specifically indicate in their study that the Chinese stock market is the least correlated emerging market with the world market specifically with the US market [17, 18]. And also considering the number of foreign single listed stock, China is at the leading position among the emerging markets. Considering all these facts, the sample data is collected from Chinese and US markets to perform the analysis for the hypotheses test. Although most of the foreign securities traded in the US markets are mainly in the form of ADRs (American Depository Receipts) and also most of them are dually listed in the home market along within the US markets, there are also a good number of ‘single listed ADRs’1 which can be treated as ordinary shares as theydo not possess any underlying stocks and traded as IPOs being US markets their primary market. Therefore alongside the Common Stocks the single listed Chinese ADRs are used as a proxy for the single listed foreign stocks in the US markets.
sponsored ADRs which complied with the listing requirements of, and raised finance in, the major trading exchange.
1. A Single-Listed Depositary Receipt is a DR whose underlying shares are not publicly traded in the issuer's home market. The DR is listed and traded only in the DR market, and cancellation will not result in delivery of local listed ordinary shares. Definition by BNY MELLON (http://www.adrbnymellon.com/single_listed_dr.jsp). 2. Sponsored Level-III Depositary Receipts are listed on a
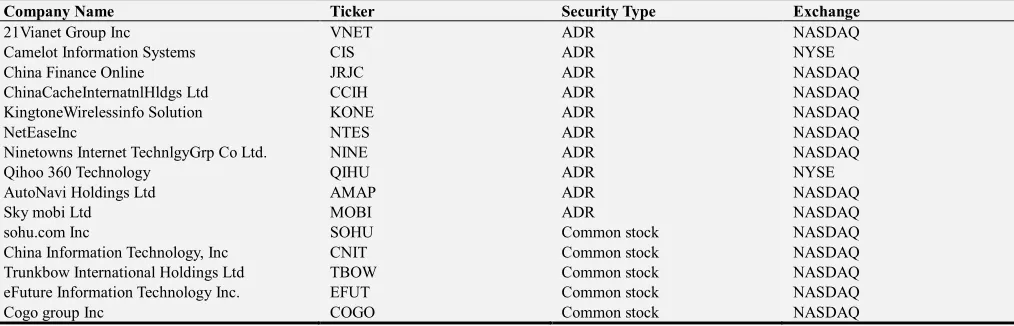
U.S. Exchange. The issuers register the offering under the 1933 Securities Act and report under the 1934 Exchange Act. The issuer must register with the SEC, reconcile to U.S. GAAP and meet listing requirements of the U.S. Exchange on which it chooses to list. The Depositary shares are registered on Form F-6, the deposited shares are registered on Form F-1 and the company registers on Form 20-F. Defined by BNY MELLON (http://www.adrbnymellon.com/dr_edu_glossary.jsp#L). The purpose of these filtering is to eliminate any major unsystematic volatility effects on the sample data except from the macro-economic regional impacts on the company’s business. After all these screening, nine companies from the Health Care sector and fifteen from the Technology sector were selected which are presented below in the Table 1 and Table 2 respectively along with their listing exchanges and security types.
To compare the impact of the sector information, Dow Jones US Technology sector index (DJUSTC) and Dow Jones US Health Care sector index (DJUSHC) were selected as a proxy for the US Technology and Health Care sector respectively; and
for the proxy of the Chinese Technology and Health Care local sector, CSI IT index (000935)3 and CSI Health Care index (000933)3were selected. The sample data are secondary data that were collected from Bloomberg, BNY Mellon’s DR Directory, S&P Dow Jones indices and Google Finance. The company information about their area of operation was verified from their annual reports and websites. The sample data lies in a very recent period of time between May 2011 and August 2013 which cover the data availability for all the sample companies. Daily returns (excluding weekends and holidays) were used, sincedaily data are more frequent in shorter time horizon; because longer time horizons (lower frequent weekly or monthly data) can obscure transient processes which may last only a few days [19]. Altogether 15180 observations were used which were matched date to date between the companies’ and the indices’ returns to perform the tests. It was let the currency of the samples remain as they were originally following Singh [20], who cited from Leong and Felmingham (2001) that converting indices to a common currency may distort the impact of local economic conditions and domestic economic policy.
3. CSI (China Securities Index Co. Ltd.) describes the formation of these indices as, ‘To measure the performance of sectors of Chinese A shares and to provide underlying for indexing investment, CSI developed the CSI sector indices and industry indices by allocating CSI 800 constituents of the same sector into a single sector index.’ Chinese A shares are restricted to Chinese investors only. Therefore local investors mainly influence the prices of these stocks. (http://www.csindex.com.cn/sseportal_en/csiportal/inde xquery.do).
Table 1. Companies from Health Care Sector.
Company Name Ticker Security Type Exchange
China Biologic Products Inc CBPO Common Stock NASDAQ
Simcere Pharmaceutical Group SCR ADR NYSE
Sinovac Biotech Ltd. SVA Common Stock NASDAQ
Concord Medical Services Hldg Ltd. CCM ADR NYSE
Tianyin Pharmaceutical Inc Co TPI Common Stock NYSEMKT
Skystar Bio-Pharmaceutical Company SKBI Common Stock NASDAQ
Biostar Pharmaceuticals Inc BSPM Common Stock NASDAQ
China Pharma Holdings, Inc. CPHI Common Stock NYSEMKT
Dehaier Medical Systems Ltd. DHRM Common Stock NASDAQ
Table 2. Companies from Technology Sector.
Company Name Ticker Security Type Exchange
21Vianet Group Inc VNET ADR NASDAQ
Camelot Information Systems CIS ADR NYSE
China Finance Online JRJC ADR NASDAQ
ChinaCacheInternatnlHldgs Ltd CCIH ADR NASDAQ
KingtoneWirelessinfo Solution KONE ADR NASDAQ
NetEaseInc NTES ADR NASDAQ
Ninetowns Internet TechnlgyGrp Co Ltd. NINE ADR NASDAQ
Qihoo 360 Technology QIHU ADR NYSE
AutoNavi Holdings Ltd AMAP ADR NASDAQ
Sky mobi Ltd MOBI ADR NASDAQ
sohu.com Inc SOHU Common stock NASDAQ
China Information Technology, Inc CNIT Common stock NASDAQ
Trunkbow International Holdings Ltd TBOW Common stock NASDAQ
eFuture Information Technology Inc. EFUT Common stock NASDAQ
3.3. Methodology
To perform the data analysis to test the impacts of the sector information on the single listed foreign stocks the following methodologies are adopted. These methods are mainly used to identify short and long term inter-linkage between different time series of data.
3.3.1. Data Process and Descriptive Statistics
As a primary process of data the daily closing prices are used in this study to calculate the indices’ and the stocks’ returns. The following method is followed to calculate the returns which is, the natural logarithm of the first lag of a series,
Return on a given period of time, Rt = LN (Pricet / Price t-1);
Where, Pricet and Pricet-1 refer to value at a particular
period and its earlier period respectively within the continuous compounded series. This return series are then analysed using Descriptive Statistics for an initial overview of the of the sample data. Natural logarithm of the price series (LN (closing price)) are also calculated for the proposed econometric analyses.
3.3.2. Correlation
A Correlation test is conducted to test the degree of relationship between different time series. Correlation test primarily indicates the direction and strength of the relationship between variables. The statistical significance suggests the strength of the relationship whereas; the positive or negative values of the correlation coefficients suggest the direction of the relationship. Correlation test is performed here to test the relationship between the daily returns of the selected stocks and the sector indices.
Although the correlation test identifies the linear association of two time series, it does not measure the causality of the interdependence of different series. Therefore, Granger causality test further extends the correlation technique by examining more rigorously whether there any cause-and-effect relationship exists between two variables [21].
Usually correlation between matric variables are measured with Pearson Correlation, which is calculated using the following formula,
= ∑ − ∑ ∑
[ ∑ − ∑ ] [ ∑ − ∑ ]
Here, r refers to the measurable correlation x and y are the variables and n refers to the number of the observations. The range of r lies in+1≥ r ≥ -1.r =0 represents there is no correlation whereas, r =+1 and r =-1 represent perfectly positive and negative correlation respectively. Following this simple interdependency analysis the data series are tested with Unit root test to proceed on further econometric tests, e.g. Causality, co-integration.
3.3.3. Unit Root Test
Before conducting many econometric analyses such as, co-integration, Granger Causality and so on, the series of data needs to be checked whether they are stationary; if not, then stationary at what level l(?). Usually most of the price series are nonstationary; that means they have a trend or unit root. Therefore first difference is taken to adjust a nonstationary series to a stationary series. A Unit root test is applied to determine whether a series is stationary. A series said to be stationary if the mean and auto-covariance of that do not depend on time [21]. The very commonly used ADF (Augmented Dickey Fuller) test is performed here to test the stationary of the data series.
In general Augmented Dickey Fuller test is conducted regressing the following AR (Auto regressive) model,
∆Yt=
γ
0+γ
1Yt-1 +β
iΣ
Yt-1+ε
tWhere, ∆Yt=Yt- Yt-1, andβi, γ0, and γ1 are the coefficients
to be estimated. The hypothesis that the series has a unit root is rejected if the t statistic is smaller than the critical values of dickey Fuller. Here the econometric software package Eviews7 used to analyse the series. The number of lagged difference that fit this data model of study is determined using lowest value of ‘Akaike Information’ and ‘Schwarz’ criteria. After checking for the unit root with this technique the data series are analysed with granger causality test to further explain the Correlation tests.
3.3.4. Granger Causality
When correlation measures only the degree to which two variables move together from the past values, Granger causality examine if there exist any Cause-and-Effect from any direction between the two variables. It is used to determine lead lag relationship between the variables. If two variables (in stationary series), X and Y, considered and current values of X can be explained significantly from the past values of Y after controlling the past values of X, then it is said that Y Granger cause X. Usually the test is conducted from the both direction to conclude whether the variables have Cause-and-Effect mutually.
Granger causality can be formed with a simple ADL (Autoregressive Distributed Lag) model as following,
Yt= c + α 1 Yt-1 + β1 Xt-1+ et
Here, the coefficient β1 is a measure of the influence of Xt-1
on Yt. if β1= 0, X does not granger cause Y or if with an OLS
(Ordinary least square) regression β1 is found to be
there any long term relationship exists among the series.
3.3.5. Co-Integration
Co-integration analyses the long run relationship between two or more variables by exploring the co-movement among the series, although, it does not measure the cause-and-effect relationship [22]. The regression results between two nonstationary series produce a spurious result which shows significant correlation; this happens because of the root or trend in the series. If different series are integrated (nonstationary) at different order (order one if stationary after first difference, order two after second difference), it may be possible to combine them to create up to aN-1 stationary series. Integrated series of the same order that can be combined to create stationary series are called co-integrated series [21]. Usually a linear combination of two same orderl(n) series will also bel(n); however, in the case of the existence of long term relationship between two nonstationary series X and Y, the residuals of the following regression model will be stationary.
Yt= β0 + β1 Xt+ ut
Here, β0= constant, β1= coefficient and ut= error term at time t;
Following the above condition, in a combination where the unit roots of the series cancel each other, the series will be recognized being co-integrated to each other [23]. It is observed in many financial studies that common practice of taking first difference for stationary can still lead to biased result in many econometric procedures. Therefore, the co-integration of series can be used to form co-integrating vectors to be used in the test procedures for unbiased results. In most of the cases the existence of co-integrating vector is identified to identify long term relationship in the variables. In the Johansen and Juselius Co-integration test, ‘Trace statistic’ and ‘Maximum Eigenvalue Statistic’ report the existence of co-integrating vectors by comparing the statistics to the critical values.
It is possible that some data series have relationship in long term but not in short term or vice versa. Therefore, short term relationships are also checked using VAR (Vector Autoregressive) model or with a restricted VAR, VECM (Vector Error Correction Model).
3.3.6. VECM and IRF Through VAR
Although co-integration analysis tests the long term relationship, the result can be different for the short run. According to Granger representation theorem, if two variables are found to be co-integrated, then the relationship between the two variables can be represented as an Error Correction Model (ECM) [20]. Generally Vector Error Correction model is used to determine the short and long run relationship between the variables which are already co-integrated. Oh & Lee suggest that in the presence of Co-integration a VECM is more suitable as a VAR model is misleading in that case, because after taking first difference
for VAR long run information is removed [24]. Naka & Tufte show in their study that VAR model is suitable the analysis of data of shorter time horizon [25]. If there are no co-integrations among the considered variables, impulse response function (IRF) through an unrestricted VAR (since, co-integration is not a requirement for it) is an appropriate approach to measure short term relationships among the variables. Narayan et al. suggest that the Impulse function enables to characterize the dynamic interaction among variables along with the speed of adjustment of variables in the system [19].
4. Results and Discussion
The empirical results with the proposed testing methodology for the relevant samples are discussed below. The indications of the findings are primarily identified in the individual test results.
4.1. Descriptive Statistics
The descriptive statistics of the samples represented sector wise in Table 3 below. The measures of standard deviations in the Health Care sector suggest that the CSI Health Care index is more volatile than the US Health care index, but both of them have a very low mean return. The Skewness suggests that the distribution of the population in CSI HC index is less left tailed than the US index’s whereas the kurtosis suggests the tails of distribution of CSI HC is fatter than the US index (High Peaked); therefore it suggests that the variance on the CSI HC is higher than the US index (DJUSHC). Although the stocks’ returns are more volatile than the indices’ where only two out of nine stocks have positive mean returns, comparing the Skewness and Kurtosis of the stocks to the indices, a distributive variance can be observed which poses as an opportunity to test the data in depth.
Table 3. Descriptive statistic for the samples from Healthcare and Technology sector.
Indices/Stocks Observation Mean Median Minimum Maximum Standard Deviation Skewness Kurtosis
r CSI HC 548 0.000107 -0.00051 -0.04352 0.043721 0.014791 -0.04879 0.022589
rDJUSHC 548 0.000617 0.001066 -0.05657 0.044036 0.010188 -0.48527 4.028499
Rbspm 548 -0.00327 -0.00633 -0.29299 0.317604 0.052475 0.560448 5.893021
Rcbpo 548 0.000993 0 -0.19136 0.165928 0.037728 0.062841 4.233511
Rccm 548 -1.8E-05 0 -0.16946 0.137689 0.029745 -0.18056 4.635971
Rcphi 548 -0.00431 0 -0.32721 0.302281 0.058396 0.224801 3.993128
Rdhrm 527 -0.00192 0 -0.23857 0.464306 0.064514 0.739942 7.354688
Rscr 527 -0.00046 0 -0.11514 0.150195 0.02411 0.354871 6.659445
Rskbi 527 -0.00176 0 -0.2137 0.18831 0.046291 0.313621 3.761575
Rsva 527 9.58E-06 -0.00294 -0.12014 0.260531 0.038716 1.422958 7.694804
Rtpi 527 -0.00232 0 -0.39148 0.212922 0.046537 -0.91879 10.2212
r CSI IT 552 -0.00017 0.000195 -0.06097 0.046097 0.017337 -0.1911 0.175376
rDJUSTC 552 0.000219 0.000528 -0.0598 0.0672 0.013 0.010133 3.120253
Ramap 552 -0.00082 0 -0.15552 0.118423 0.029107 -0.22998 2.991382
Rccih 552 -0.00212 -0.00235 -0.20035 0.207917 0.041878 0.434701 3.718189
Rcis 552 -0.00427 -0.00341 -0.30338 0.222254 0.049917 -0.36282 4.183976
Rcnit 551 -0.00059 0 -0.34277 0.312133 0.064285 0.056223 5.666604
Rcogo 552 -0.00229 0 -0.48551 0.468714 0.044992 -0.14779 47.31155
rEFUT 513 -0.00067 0 -0.25226 0.364548 0.045685 1.756135 17.36531
Rjrjc 551 -0.00213 -0.00286 -0.27099 0.217346 0.043414 0.156693 4.748624
Rkone 476 -0.0039 0 -0.3472 0.609064 0.111327 0.624333 4.086582
Rmobi 551 -0.00242 -0.00445 -0.16363 0.359896 0.055161 1.034582 6.113392
Rnine 487 0.000449 0 -0.12323 0.47116 0.038982 3.513515 44.07954
Rntes 551 0.000903 0.001256 -0.16036 0.12359 0.02545 -0.35752 4.875105
Rqihu 551 0.002038 0 -0.15693 0.154635 0.038135 0.12058 1.349438
Rsohu 551 -0.00073 0.000749 -0.16593 0.166463 0.033389 -0.06213 4.350865
Rtbow 540 -0.00293 0 -0.34765 0.270027 0.054959 -0.20221 6.380017
Rvnet 551 -0.00025 -0.00146 -0.17751 0.116909 0.034962 -0.11726 3.606545
4.2. Correlation Analysis
The following results in Table 4 and Table 5 are achieved from the correlation test for the companies from the two sectors and the similar sector indices of the home market and the foreign market.
Table 4. Correlation between Companies' and indices' returns of Health Care Sector.
Company Name DHUSHC CSI Health Care (000933)
DJUSHC 1 0.051
China Biologic Products Inc 0.070 -0.008
Simcere Pharmaceutical Group **0.104 0.074
Sinovac Biotech Ltd. **0.292 0.038
Concord Medical Services Hldg Ltd. **0.087 0.046
Tianyin Pharmaceutical Inc Co **0.176 0.049
Skystar Bio-Pharmaceutical Company 0.047 -0.016
Biostar Pharmaceuticals Inc **0.233 **0.119
China Pharma Holdings, Inc. 0.031 0.040
Dehaier Medical Systems Ltd. 0.023 0.076
** denotes 5% significance level.
Table 5. Correlation between Companies' and indices' returns of Technology Sector.
Company Name DJUSTC CSI IT (000935)
DJUSTC 1 0.077
21Vianet Group Inc **0.375 **0.116
Camelot Information Systems **0.314 -0.032
China Finance Online **0.179 **0.158
ChinaCacheInternatnlHldgs Ltd **0.250 **0.109
KingtoneWirelessinfo Solution 0.026 0.013
NetEaseInc **0.471 **0.157
Ninetowns Internet TechnlgyGrp CoLtd. -0.024 -0.018
Qihoo 360 Technology **0.303 **0.144
AutoNavi Holdings Ltd **0.342 **0.182
Sky mobi Ltd **0.376 **0.155
sohu.com Inc **0.521 **0.142
Company Name DJUSTC CSI IT (000935)
Trunkbow International Holdings Ltd 0.054 -0.080
eFuture Information Technology Inc. **0.220 0.086
Cogo group Inc **0.114 **0.106
** denotes 5% significance level.
For both the Health Care and the Technology sector, it can be seen that the correlation between the indices of US market and the Chinese market are very low same as it was expected for the two least correlated markets. Therefore, it can be assumed that there is very least Bias from the US market (overall macro-economic impact due to globalisation) on the performance of the considered stocks except from the individual sector’s impacts. Although there are no major correlation among the stocks and the indices for the companies from the Health Care sector considering the scale of the correlation of +1 and-1, but it shows that the impact of the trading market is higher than the market of the place of operations on the stocks’ prices. The results show that seven out of the nine sample companies have higher correlation with the DJUSHC ranging from 0.233 to 0.47 whereas; it ranges between 0.119 and (-) 0.008 with the CSI health care Index.
The correlations between the Technology sector indices of the two markets is a little higher than the Health Care sector’s (0.077>0.051) which can be the impact of the global identity of the Technology sector. Still a similar trend like Health Care sector can be seen for the sample Technology stocks. The results show that 14 out of the 15 companies’ returns are more correlated to DJUSTC index than CSI IT index. These higher correlations with DJUSTC range from 0.521 to 0.026 whereas; it ranges between 0.182 and 0.013with the CSI IT index. At this point, if the results found are considered to be same in long run, the findings from this correlation analyses
contrast to the Hypothesis three (H3), and support the findings in the research article by Deutsche Bank AG that the trading places’ information has the superior impact on the performance of the stocks comparing to the home markets’ information [16]. The latter analyses focus in depth on the nature of these relationships.
4.3. Unit Root Test
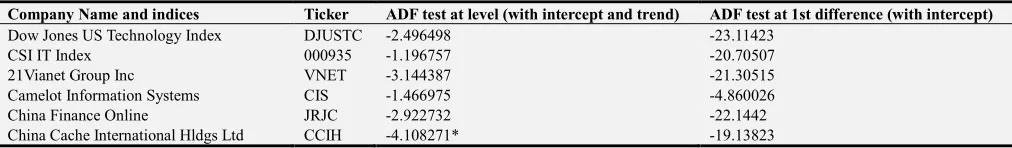
Unit root test is conducted to check if there is any unit root in the time series at different levels l(n) as further statistical analyses require the series to be stationary or integrated at same level. The position (assuming on one line) of the ADF (Augmented Dickey-Fuller) test statistical values (t-statistic)concludes the hypothesis whether there is any unit root in the series or the series is difference stationary. If the value resides on left of the 1% critical value (smaller than the critical value), the series is accepted to be stationary at 99% confidence level. Similarly, the series are accepted in 95% or 90% confidence level for 5% or 10% critical values respectively. Table 6 and Table 7below represent the ADF test results for the closing price series of the sample data. The results show that except from four companies (one in Health Care sector and three in Technology sector) all of the samples are non-stationary at level. These series become stationary at first difference l(1); thus return series of the samples are stationary (by definition) at level
l(0) and can be used for further analysis.
Table 6. Augmented Dickey-Fuller (ADF) Test Statistics for Health Care Sector.
Company Name Indices Ticker ADF test at level (with intercept and trend) ADF test at 1st difference (with intercept)
Dow Jones US Health Care Index DJUSHC -2.403211 -15.02464
CSI Health Care Index 000933 -2.074411 -20.23643
China Biologic Products Inc CBPO -2.130805 -22.06565
Simcere Pharmaceutical Group SCR -2.934361 -12.97647
Sinovac Biotech Ltd. SVA -1.660193 -23.21175
Concord Medical Services Hldg Ltd. CCM -2.549787 -26.38469
Tianyin Pharmaceutical Inc Co TPI -2.52689 -15.64609
Skystar Bio-Pharmaceutical Company SKBI -2.635544 -17.19369
Biostar Pharmaceuticals Inc BSPM -3.16518 -23.54637
China Pharma Holdings, Inc. CPHI -2.364198 -14.14297
Dehaier Medical Systems Ltd. DHRM -6.465517* -27.02083
Critical value at 1% -3.975906 -3.443579
Critical value at 5% -3.418536 -2.867267
Critical value at 10% -3.131778 -2.569883
*DHRM closing price series is stationary at level l(0).
Table 7. Augmented Dickey-Fuller (ADF) Test Statistics for Technology Sector.
Company Name and indices Ticker ADF test at level (with intercept and trend) ADF test at 1st difference (with intercept) Dow Jones US Technology Index DJUSTC -2.496498 -23.11423
CSI IT Index 000935 -1.196757 -20.70507
21Vianet Group Inc VNET -3.144387 -21.30515
Camelot Information Systems CIS -1.466975 -4.860026
China Finance Online JRJC -2.922732 -22.1442
Company Name and indices Ticker ADF test at level (with intercept and trend) ADF test at 1st difference (with intercept) Kingtone Wirelessinfo Solution KONE -2.961889 -20.97641
Net EaseInc NTES -1.978245 -20.45089
Ninetowns Internet Technlgy Grp Co Ltd. NINE -2.602729 -14.84212
Qihoo 360 Technology QIHU 0.936207 -16.84186
Auto Navi Holdings Ltd AMAP -2.878875 -20.81752
Sky mobi Ltd MOBI -3.572376 -16.25108
sohu.com Inc SOHU -2.199675 -22.52612
China Information Technology, Inc CNIT -1.290946 -11.78812 Trunkbow International Holdings Ltd TBOW -3.412528 -21.17401 eFuture Information Technology Inc. EFUT -4.286273* -5.07046
Cogo group Inc COGO -3.994538* -22.38894
Critical value at 1% -3.976896 -3.443469
Critical value at 5% -3.419019 -2.867219
Critical value at 10% -3.132063 -2.569857
*CCIH, EFUT and COGO closing price series are stationary at level l(0).
4.4. Granger Causality Test
Granger causality test is conducted to investigate whether the local indices of the two countries have any causal effect on the returns of the sample stocks. The results are presented in Table 8 and Table 9 below indicating the rejection of the Null Hypotheses at 5% significance level. These results from Granger causality tests further verify the results of correlation tests found earlier. Because of the lower correlations amongst the stock returns and the indices, there are not any significant influences on each other. Therefore, it is rare that the indices from both markets granger cause the returns of the stocks (only 8 out of all 24 stocks). Specifically focusing
marketwise it shows that, in the Health Care sector, tow out of the three significantly Granger caused stocks are caused by Dow Jones US Health Care index. The results are almost similar for the Technology sector except only one company’s return series which is granger caused by both DJUSTC and CSI IT indices. In the rest, three out of four significantly granger caused companies’ returns are caused by Dow Jones US Technology sector index. Although a very limited result in this test to conclude, but ratio wise (5 out of 7 stocks except RCNIT) it seems like that the stocks are more influenced by the local sector where they are traded than the local sector where the underlying companies operate.
Table 8. Granger causality test for the samples from Health Care sector.
Null Hypothesis Observation F-Statistic Probability
RDJUSHC does not Granger Cause RBSPM 424 0.40979 0.8016
R_CSI_HC does not Granger Cause RBSPM 424 0.99662 0.4091
RDJUSHC does not Granger Cause RCBPO 424 **3.18964 0.0134
R_CSI_HC does not Granger Cause RCBPO 424 0.32032 0.8644
RDJUSHC does not Granger Cause RCCM 424 1.18615 0.3162
R_CSI_HC does not Granger Cause RCCM 424 1.20104 0.3097
RDJUSHC does not Granger Cause RCPHI 424 1.41063 0.2296
R_CSI_HC does not Granger Cause RCPHI 424 1.41345 0.2286
RDJUSHC does not Granger Cause RDHRM 352 1.5641 0.1834
R_CSI_HC does not Granger Cause RDHRM 352 **2.55397 0.0388
RDJUSHC does not Granger Cause RSCR 424 0.90163 0.4629
R_CSI_HC does not Granger Cause RSCR 424 1.40403 0.2318
RDJUSHC does not Granger Cause RSKBI 398 1.53361 0.1916
R_CSI_HC does not Granger Cause RSKBI 398 1.97804 0.0971
RDJUSHC does not Granger Cause RSVA 424 **2.4276 0.0473
R_CSI_HC does not Granger Cause RSVA 424 1.5966 0.1743
RDJUSHC does not Granger Cause RTPI 424 0.87005 0.4818
R_CSI_HC does not Granger Cause RTPI 424 0.93154 0.4454
** denotes to 5% significance. RDJUSHC= DJUSHC return series, R_CSI_HC= CSI Health Care return series; Company returns are presented as R (Ticker) =RBSPM.
Table 9. Granger causality test for the samples from Technology sector.
Null Hypothesis Observation F-Statistic Probability
RDJUSTC does not Granger Cause RAMAP 428 1.2405 0.293
R_CSI_IT does not Granger Cause RAMAP 428 0.59766 0.6645
RDJUSTC does not Granger Cause RCCIH 428 1.0488 0.3816
R_CSI_IT does not Granger Cause RCCIH 428 0.63913 0.6348
RDJUSTC does not Granger Cause RCIS 428 2.1517 0.0737
R_CSI_IT does not Granger Cause RCIS 428 0.39911 0.8093
RDJUSTC does not Granger Cause RCNIT 426 **2.40786 0.0488
Null Hypothesis Observation F-Statistic Probability
RDJUSTC does not Granger Cause RCOGO 428 **2.44428 0.046
R_CSI_IT does not Granger Cause RCOGO 428 1.61233 0.1702
R_CSI_IT does not Granger Cause REFUT 332 0.4316 0.7858
RDJUSTC does not Granger Cause REFUT 332 2.28174 0.0604
R_CSI_IT does not Granger Cause RJRJC 423 1.06756 0.3721
RDJUSTC does not Granger Cause RJRJC 423 1.7105 0.1467
RDJUSTC does not Granger Cause RKONE 289 1.47445 0.2101
R_CSI_IT does not Granger Cause RKONE 289 **3.54142 0.0077
RDJUSTC does not Granger Cause RMOBI 428 0.55828 0.6931
R_CSI_IT does not Granger Cause RMOBI 428 1.91812 0.1065
RDJUSTC does not Granger Cause RNINE 256 0.66053 0.62
R_CSI_IT does not Granger Cause RNINE 256 1.3142 0.2652
RDJUSTC does not Granger Cause RNTES 428 1.18981 0.3146
R_CSI_IT does not Granger Cause RNTES 428 0.69297 0.5971
RDJUSTC does not Granger Cause RQIHU 428 **3.7694 0.005
R_CSI_IT does not Granger Cause RQIHU 428 0.39797 0.8101
RDJUSTC does not Granger Cause RSOHU 428 **2.78045 0.0265
R_CSI_IT does not Granger Cause RSOHU 428 1.8054 0.1268
RDJUSTC does not Granger Cause RTBOW 412 1.15427 0.3306
R_CSI_IT does not Granger Cause RTBOW 412 0.8523 0.4927
RDJUSTC does not Granger Cause RVNET 428 2.06302 0.0848
R_CSI_IT does not Granger Cause RVNET 428 1.38981 0.2366
** denotes to 5% significance. RDJUSTC= DJUSTC return series, R_CSI_IT= CSI IT return series; Company returns are presented as R (Ticker) =RAMAP.
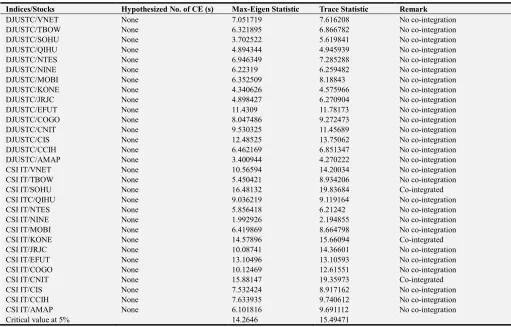
4.5. Co-integration Test
Bivariate Co-integration analysis is performed with the natural logarithm of the closing price series of the samples in Eviews to check whether there is any Co-integrating Vector exists between the stock price series and the index series. ‘Intercept with no trend, is specified in the Deterministic Trend Assumption. The results for the test with both Maximum Eigen value statistic and Trace statistic are reported on Table 10 and Table 11 for the Health Care sector and the Technology sector respectively. The results show that there are no Co-integration between the Health Care sector indices of both US and Chinese markets and the stocks; hence there are no long term relationship between the Health
Care sector stocks’ performance and the indices from both markets. The results are almost similar for the Technology sector as well. Only three out of fifteen (SOHU, KONE and CNIT) companies’ stocks in the Technology sector reveal a long term relationship (Co-integration) with the home market (CSI IT) where there are no long term impact exists on each other between DJUSTC and the sample stocks. Since these findings show that the majority of the stocks (21 out of 24) do not have any long term influence from any of the markets, it can be assumed that the sample stocks (this single listed type)are probably treated as unique in the market in long term. The short term relationships are tested below with Impulse Response Function.
Table 10. Co-integration test for the health Care sector stocks and indices.
Index/Stock Hypothesized No. of CE (s) Max-Eigen Statistic Trace Statistic Remark
DJUSHC/BSPM None 9.417328 9.93284 No co-integration
DJUSHC/CBPO None 2.904767 3.835176 No co-integration
DJUSHC/CCM None 9.23453 9.278722 No co-integration
DJUSHC/CPHI None 4.982161 5.196987 No co-integration
DJUSHC/DHRM None 10.14911 10.44921 No co-integration
DJUSHC/SCR None 7.138971 7.709034 No co-integration
DJUSHC/SKBI None 6.423766 10.23333 No co-integration
DJUSHC/SVA None 6.796211 7.520136 No co-integration
DJUSHC/TPI None 6.144366 9.799184 No co-integration
CSI HC/BSPM None 6.23195 6.363725 No co-integration
CSI HC/CBPO None 9.44369 9.560817 No co-integration
CSI SHC/CCM None 5.507206 5.720488 No co-integration
CSI HC/CPHI None 4.262789 4.554878 No co-integration
CSI HC/DHRM None 6.640525 6.815062 No co-integration
CSI HC/SCR None 5.558227 6.132792 No co-integration
CSI HC/SKBI None 5.662636 7.284442 No co-integration
CSI HC/SVA None 4.003087 4.195655 No co-integration
CSI HC/TPI None 3.892518 4.559154 No co-integration
Table 11. Co-integration test for the Technology sector stocks and indices.
Indices/Stocks Hypothesized No. of CE (s) Max-Eigen Statistic Trace Statistic Remark
DJUSTC/VNET None 7.051719 7.616208 No co-integration
DJUSTC/TBOW None 6.321895 6.866782 No co-integration
DJUSTC/SOHU None 3.702522 5.619841 No co-integration
DJUSTC/QIHU None 4.894344 4.945939 No co-integration
DJUSTC/NTES None 6.946349 7.285288 No co-integration
DJUSTC/NINE None 6.22319 6.259482 No co-integration
DJUSTC/MOBI None 6.352509 8.18843 No co-integration
DJUSTC/KONE None 4.340626 4.575966 No co-integration
DJUSTC/JRJC None 4.898427 6.270904 No co-integration
DJUSTC/EFUT None 11.4309 11.78173 No co-integration
DJUSTC/COGO None 8.047486 9.272473 No co-integration
DJUSTC/CNIT None 9.530325 11.45689 No co-integration
DJUSTC/CIS None 12.48525 13.75062 No co-integration
DJUSTC/CCIH None 6.462169 6.851347 No co-integration
DJUSTC/AMAP None 3.400944 4.270222 No co-integration
CSI IT/VNET None 10.56594 14.20034 No co-integration
CSI IT/TBOW None 5.450421 8.934206 No co-integration
CSI IT/SOHU None 16.48132 19.83684 Co-integrated
CSI ITC/QIHU None 9.036219 9.119164 No co-integration
CSI IT/NTES None 5.856418 6.21242 No co-integration
CSI IT/NINE None 1.992926 2.194855 No co-integration
CSI IT/MOBI None 6.419869 8.664798 No co-integration
CSI IT/KONE None 14.57896 15.66094 Co-integrated
CSI IT/JRJC None 10.08741 14.36601 No co-integration
CSI IT/EFUT None 13.10496 13.10593 No co-integration
CSI IT/COGO None 10.12469 12.61551 No co-integration
CSI IT/CNIT None 15.88147 19.35973 Co-integrated
CSI IT/CIS None 7.532424 8.917162 No co-integration
CSI IT/CCIH None 7.633935 9.740612 No co-integration
CSI IT/AMAP None 6.101816 9.691112 No co-integration
Critical value at 5% 14.2646 15.49471
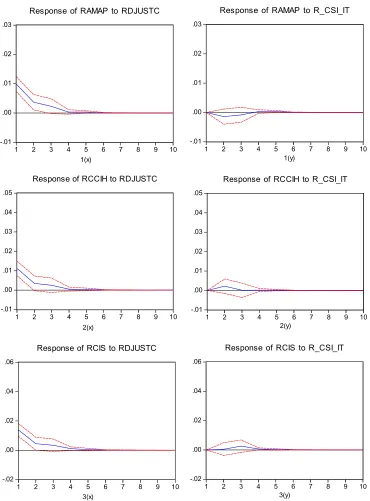
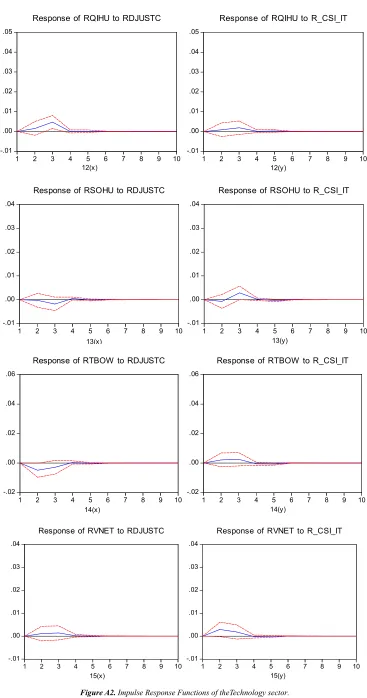
4.6. Impulse Response Function
As there are rare existence of co-integration, VEC (Vector Error Correction) model cannot be applied to check for short term relationships. Therefore, Impulse Response Function is applied which is formed with unrestricted VAR (Vector Autoregression). Graphs in figures A1 and A2 represent the findings of Impulse Response Function for the Health Care sector and the Technology sector of the samples respectively. The results are in order of {1(a), 1(b)} to {9(a), 9(b)} for all the nine stocks from the Health Care sector and {1(x), 1(y)} to {15(x), 15(y)} for all the stocks from the Technology sector. The results are presented side by side comparing the response of the stocks to the innovation of one standard deviation of shocks in the home market (PRC) and foreign market (US). The responses are observed fora period of ten days spread.
The results shows that, in the Health Care sector, almost all of the samples react instantly to shocks from the both markets and last for four days and then it settles down. The magnitude and spread (in a few) of the shocks show that, market wise, the reaction is greater to the shocks from the US market.
The results for the Technology sector are a little different but the ratio of the outputs tends to follow the results for the Health Care sector. It shows that ten out of the fifteen samples (except 8, 9, 11, 13 and 15) respond highly to the shocks from the US market than the shocks from the home
market.
The findings of these short term dynamic interactions between stocks and indices suggest that, thesample stocks of both the Health Care sector and the Technology sector react to the information of the trading place more significantly than the information from the home market. For short run this is consistent with the findings of Deutsche Bank AG [16].
5. Conclusion and Recommendations
‘If there is any impact present, the local (sector) information is less significant for the foreign stocks comparing to the country of origin’s (sector) information in long run’.
The findings of this study were achieved thorough following methodologies step by step with, a very simple Correlation analysis to Impulse Response Function (IRF) through VAR. The natures of the relationships and the impacts on each other were explored by testing the spreads of the relationships with Granger causality, Co-integration and Impulse Response Function. The tests were conducted for two different sectors side by side so that the outcomes can be validated by comparing each other.
The results reveal that, the sample stocks from both the Health Care sector and the Technology sector have a very weak correlation with both the home market (local sector) and the foreign market (local sector) but, have a leaning towards US markets. The tests of Granger causality also support the absence of any major impact of the both markets on the stocks but, the stocks show a very little leaning towards US markets. When the correlations were further verified through Bivariate Con-integration test, it reveals that there exists no significant long term relationship between the stocks and the indices from both markets. Therefore, the hypothesis developed cannot be verified precisely as no significant long term relationship was identified. Here, with the results, it can be assumed that this sort of stocks can be unique in investors’ perception in long term. This is may be because of their prestige in the market for being the opportunity for the invertors to diversify internationally from the home market, and may be this perception is exposed when the trading markets mainly price the stocks, not the market of companies’ operations. The perceptions of company’s income stability that judged through US listing requirements might also provide the stocks a unique face in long term in the case of these sample stocks.
From the test of Impulse Response Function, the stocks show significant response to the information from the trading market in short term. This explains the stocks’ leaning towards the US markets found in the Correlation and Granger causality tests. It partially supports the developed hypothesis if it is restated as, the impact of the local (sector) information can be significant in short run but less significant in long run for the foreign stocks comparing to the impact of the country of origin’s (sector) information.
The overall empirical findings from this study support and take the results in deeper extents to sector wise for the findings of Minho et al. that, investors may mistakenly price foreign securities with reference to the US market index which results in the daily ADR (American Depository Receipts) returns to be highly positively correlated with the US stock returns in a very short-term [5].
5.1. Argument of Limitations of the Study
Considering the robustness and validity of this study, two main points can be argued here;
Firstly, the study period was not long enough because of the absence of data for all the samples for a longer period. Narayan et al. argue in their study that ‘increasing numbers of observations through using daily data does not add robustness to the co-integration results what matters is the length of the period’. Therefore the test with the data of longer time horizon could explicitly validate the findings [19].
Secondly, because of limited available samples, the data were collected from two different sectors of same country rather than same sector of different countries. This followed procedure for validity of results can be argued to be biased of US market sentiment for a particular foreign market (here, US sentiment for PRC) or to be biased of ‘Global Centre Hypothesis’. Therefore, if the data were collected from same sectors of different countries, the results could be more explicitly validated. Because if there were any significant impact on foreign stocks from the local sector, these should be same for all similar stocks of different countries floated in the same foreign market.
5.2. Further Research Recommendations
Although, the data for focusing on this areaof study is still in limited sphere, this new trend of floating singly on foreign markets is probably indicating a new development of pure globalization in economies and /or the development of confidence for frictionless EMH (Efficient Market Hypothesis) beyond the country borders, which can be an interest of further researches in this area.
This research was conducted mainly focusing on the Hypothesis three (H3) because, the involvement of the other two Hypotheses (H1 and H2) are the extension on the phenomenon developed after establishing it (H3). Since, because of the influences of global events, politics and business operations the relationships in the world economy are ever-changing, these dynamics motivate the researchers to revisit the theoretical issues time to time with real world data. Therefore, further extension on this study can be of interest with a variety of larger data samples from multinational markets and with different test models.
Appendix
-.02 .00 .02 .04 .06
1 2 3 4 5 6 7 8 9 10
Response of RBSPM to RDJUSHC
-.02 .00 .02 .04 .06
1 2 3 4 5 6 7 8 9 10
Response of RBSPM to R_CSI_HC
1(a) 1(b)
-.01 .00 .01 .02 .03 .04
1 2 3 4 5 6 7 8 9 10
Response of RCBPO to RDJUSHC
-.01 .00 .01 .02 .03 .04
1 2 3 4 5 6 7 8 9 10
Response of RCBPO to R_CSI_HC
2(a) 2(b)
-.01 .00 .01 .02 .03 .04
1 2 3 4 5 6 7 8 9 10
Response of RCCM to RDJUSHC
-.01 .00 .01 .02 .03 .04
1 2 3 4 5 6 7 8 9 10
Response of RCCM to R_CSI_HC
3(a) 3(b)
-.02 .00 .02 .04 .06 .08
1 2 3 4 5 6 7 8 9 10
Response of RCPHI to RDJUSHC
-.02 .00 .02 .04 .06 .08
1 2 3 4 5 6 7 8 9 10
Response of RCPHI to R_CSI_HC
-.04 -.02 .00 .02 .04 .06 .08
1 2 3 4 5 6 7 8 9 10
Response of RDHRM to RDJUSHC
-.04 -.02 .00 .02 .04 .06 .08
1 2 3 4 5 6 7 8 9 10
Response of RDHRM to R_CSI_HC
5(a) 5(b)
-.004 .000 .004 .008 .012 .016 .020 .024
1 2 3 4 5 6 7 8 9 10
Response of RSCR to RDJUSHC
-.004 .000 .004 .008 .012 .016 .020 .024
1 2 3 4 5 6 7 8 9 10
Response of RSCR to R_CSI_HC
6(a) 6(b)
-.02 .00 .02 .04 .06
1 2 3 4 5 6 7 8 9 10
Response of RSKBI to RDJUSHC
-.02 .00 .02 .04 .06
1 2 3 4 5 6 7 8 9 10
Response of RSKBI to R_CSI_HC
7(a) 7(b)
-.01 .00 .01 .02 .03 .04
1 2 3 4 5 6 7 8 9 10
Response of RSVA to RDJUSHC
-.01 .00 .01 .02 .03 .04
1 2 3 4 5 6 7 8 9 10
Response of RSVA to R_CSI_HC
Figure A1. Impulse Response Functions of the Health Care sector.
-.02 .00 .02 .04 .06
1 2 3 4 5 6 7 8 9 10
Response of RTPI to RDJUSHC
-.02 .00 .02 .04 .06
1 2 3 4 5 6 7 8 9 10
Response of RTPI to R_CSI_HC
9(a) 9(b)
-.01 .00 .01 .02 .03
1 2 3 4 5 6 7 8 9 10
Response of RAMAP to RDJUSTC
-.01 .00 .01 .02 .03
1 2 3 4 5 6 7 8 9 10
Response of RAMAP to R_CSI_IT
1(x) 1(y)
-.01 .00 .01 .02 .03 .04 .05
1 2 3 4 5 6 7 8 9 10
Response of RCCIH to RDJUSTC
-.01 .00 .01 .02 .03 .04 .05
1 2 3 4 5 6 7 8 9 10
Response of RCCIH to R_CSI_IT
2(x) 2(y)
-.02 .00 .02 .04 .06
1 2 3 4 5 6 7 8 9 10
Response of RCIS to RDJUSTC
-.02 .00 .02 .04 .06
1 2 3 4 5 6 7 8 9 10
Response of RCIS to R_CSI_IT
-.02 .00 .02 .04 .06 .08
1 2 3 4 5 6 7 8 9 10
Response of RCNIT to RDJUSTC
-.02 .00 .02 .04 .06 .08
1 2 3 4 5 6 7 8 9 10
Response of RCNIT to R_CSI_IT
4(x) 4(y)
-.01 .00 .01 .02 .03 .04 .05
1 2 3 4 5 6 7 8 9 10
Response of RCOGO to RDJUSTC
-.01 .00 .01 .02 .03 .04 .05
1 2 3 4 5 6 7 8 9 10
Response of RCOGO to R_CSI_IT
5(x) 5(y)
-.02 .00 .02 .04 .06
1 2 3 4 5 6 7 8 9 10
Response of REFUT to RDJUSTC
-.02 .00 .02 .04 .06
1 2 3 4 5 6 7 8 9 10
Response of REFUT to R_CSI_IT
6(x) 6(y)
-.01 .00 .01 .02 .03 .04 .05
1 2 3 4 5 6 7 8 9 10
Response of RJRJC to RDJUSTC
-.01 .00 .01 .02 .03 .04 .05
1 2 3 4 5 6 7 8 9 10
Response of RJRJC to R_CSI_IT
-.04 .00 .04 .08 .12
1 2 3 4 5 6 7 8 9 10
Response of RKONE to RDJUSTC
-.04 .00 .04 .08 .12
1 2 3 4 5 6 7 8 9 10
Response of RKONE to R_CSI_IT
8(x) 8(y)
-.02 .00 .02 .04 .06
1 2 3 4 5 6 7 8 9 10
Response of RMOBI to RDJUSTC
-.02 .00 .02 .04 .06
1 2 3 4 5 6 7 8 9 10
Response of RMOBI to R_CSI_IT
9(x) 9(y)
-.02 .00 .02 .04 .06
1 2 3 4 5 6 7 8 9 10
Response of RNINE to RDJUSTC
-.02 .00 .02 .04 .06
1 2 3 4 5 6 7 8 9 10
Response of RNINE to R_CSI_IT
10(x) 10(y)
-.01 .00 .01 .02 .03
1 2 3 4 5 6 7 8 9 10
Response of RNTES to R_CSI_IT
-.01 .00 .01 .02 .03
1 2 3 4 5 6 7 8 9 10
Response of RNTES to RDJUSTC
Figure A2. Impulse Response Functions of theTechnology sector.
-.01 .00 .01 .02 .03 .04 .05
1 2 3 4 5 6 7 8 9 10
Response of RQIHU to R_CSI_IT
-.01 .00 .01 .02 .03 .04 .05
1 2 3 4 5 6 7 8 9 10
Response of RQIHU to RDJUSTC
12(x) 12(y)
-.01 .00 .01 .02 .03 .04
1 2 3 4 5 6 7 8 9 10
Response of RSOHU to RDJUSTC
-.01 .00 .01 .02 .03 .04
1 2 3 4 5 6 7 8 9 10
Response of RSOHU to R_CSI_IT
13(x) 13(y)
-.02 .00 .02 .04 .06
1 2 3 4 5 6 7 8 9 10
Response of RTBOW to RDJUSTC
-.02 .00 .02 .04 .06
1 2 3 4 5 6 7 8 9 10
Response of RTBOW to R_CSI_IT
14(x) 14(y)
-.01 .00 .01 .02 .03 .04
1 2 3 4 5 6 7 8 9 10
Response of RVNET to RDJUSTC
-.01 .00 .01 .02 .03 .04
1 2 3 4 5 6 7 8 9 10
Response of RVNET to R_CSI_IT