Published online September 10, 2014 (http://www.sciencepublishinggroup.com/j/ogce) doi: 10.11648/j.ogce.20140204.12
The XPS analysis of surface texture of
different-density-level coking coal of Fenxi county
Ge Tao
1, Zhang Mingxu
2, Min Fanfei
21
The Department of Earth & Environment, Anhui University of Science and Technology, Huainan 232001, China
2
The Department of Material Science & Engineering, Anhui University of Science and Technology, Huainan 232001, China
Email address:
[email protected] (Ge Tao)To cite this article:
Ge Tao, Zhang Mingxu, Min Fanfei. The XPS Analysis of Surface Texture of Different-Density-Level Coking Coal of Fenxi County.
International Journal of Oil, Gas and Coal Engineering. Vol. 2, No. 4, 2014, pp. 59-65. doi: 10.11648/j.ogce.20140204.12
Abstract:
In the present paper, X-ray photoelectron spectrum (XPS) is used to reveal the surface texture, main elements and occurrence mode of different-density-level sample coal of Fenxi County. The experimental results demonstrate that: (1) there is an extremely low content of nitrogen in the sample coal; (2) carbon mainly exists in the form of C-C and the contents of carbonyl (C=O) and carboxyl is still relatively low; (3) with the increasing of density, such content has a growing trend; (4) the organic sulfur of the coking coal in Fenxi County has the three major forms, i.e., (sub)sulfone, thiophene and thiol (ether), with their respective content in a low-to-high order.Keywords:
XPS, Coking Coal, Density, Surface Texture1. Introduction
The research into the surface texture of the coal revolves around the structure of carbon, oxygen, sulfur, nitrogen and their occurrence mode. As is well known, carbon is the major component of the coal. However, it should be noted that the occurrence mode of the oxygen is the key research project involving the surface of the coal. The processing and transforming of the coal, such as the pyrolysis, direct hydro-liquefaction and the like, call for data information of the occurrence mode of the coal. As oxygen is the most abundant hetero-atom in the coal, the form of the functional group of C-O makes a major difference to coal nature. Sulfur, the accompanying element in the coal, acts as a major hindrance to the utilization of rare coking coal. Therefore, the research into the structure of the organic sulfur in the coal constitutes a major content of coal chemistry. Density, affected by the type of processed coal, coal petrography, minerals and the degree of coalification, is an intrinsic feature of the coal. That the density changes with the degree of coalification is the macro performance of the changes in the structure of coal molecules. As a result, a research into the structure and occurrence mode of the major elements on the basis on the differentiated coal density to gain an insight into their differences in chemical reactions will facilitate the development of the processing technology in a refined way.
XPS is one of the most effective methods of element analysis arising in recent years, with a possession of a high recognition capacity of chemical characteristics of material surface and no damage of sample textures[1]. With a high sensitivity on the surface, it offers in a simultaneous way the information on the qualitative and quantitative analysis and chemical state. As the first professional to put forward the structure research into the coal by means of XPS, Frost has made analysis of several classifications occurrence modes of the coal, oxygen, and sulfur in inorganic minerals acquired from the coking coal with the method of heavy liquid separation[2]. Scholars at home and abroad have also conducted a research into the structure of the major elements of the coal by means of XPS[3-10],with most of them focusing on the analysis of single elements and less research into the surface texture of coking coal. Based on what has been achieved by other professionals, the author has made an analysis of the surface texture of the coking coal in Fenxi County with the help of XPS in an effort to demonstrate the occurrence modes of the coal with different levels of density to offer new thoughts for the improvement of the comprehensive utilization of the coking coal.
2. The Experimental Part
The sample of coal is taken from Xinyu Coal Washery affiliated with Fenxi Mining Group. A screening is conducted on the raw coal with the dry air in accordance with GB/T477-2008, after which the coal sample of 6-13
(mm) is oscillated in line with the above standard and
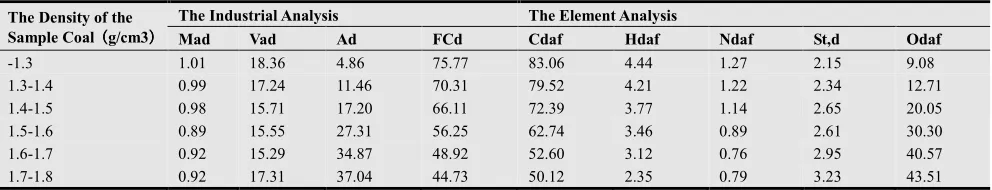
classified with degrees of density. The density of the sample is set below 0.2 mm to be used for a test after the drying at a constant temperature of 105 oC. The industrial and elemental analysis of the sample of different degrees of density is shown in Table 1.
Table 1. The Industrial & Element Analysis of the Coal Sample of Different Degrees of Density
The Density of the Sample Coal((((g/cm3))))
The Industrial Analysis The Element Analysis
Mad Vad Ad FCd Cdaf Hdaf Ndaf St,d Odaf
-1.3 1.01 18.36 4.86 75.77 83.06 4.44 1.27 2.15 9.08
1.3-1.4 0.99 17.24 11.46 70.31 79.52 4.21 1.22 2.34 12.71 1.4-1.5 0.98 15.71 17.20 66.11 72.39 3.77 1.14 2.65 20.05 1.5-1.6 0.89 15.55 27.31 56.25 62.74 3.46 0.89 2.61 30.30 1.6-1.7 0.92 15.29 34.87 48.92 52.60 3.12 0.76 2.95 40.57 1.7-1.8 0.92 17.31 37.04 44.73 50.12 2.35 0.79 3.23 43.51
2.2. The Testing Conditions
With the use of X-ray photoelectron spectrograph of hermo ESCALAB 250, with the X-ray source of mono-color Al Ka (hv =1486.6 eV), the power of 150W, the beam spot of 500µm the experiment, and the fixed penetration capacity of energy analysis of 30eV, is completed, with C1s(284.6eV) as the scaling standard for adjustment[11].
2.3. The XPS Characterization & Data Processing
Fig 1. XPS Spectrum in the Sample Coal
The results of the XPS spectrum in the sample coal of Fenxi County is shown in Chart 1.. There are just peaks of O, C, S, and Si in the spectrum, with no N in the sample, which corresponds to what is found in Chart 1. Therefore, the author in this paper will just make a discussion of the structure of carbon, oxygen and sulfur of different degrees of density. In accordance with the scope of the binding energy
of all forms in the coal, an effort has been made to get satisfactory results with the adjustment of peak positions and half-peak width.
3. Result & Discussion
3.1. The Occurrence Shape of Carbon in the Coal Surface Texture
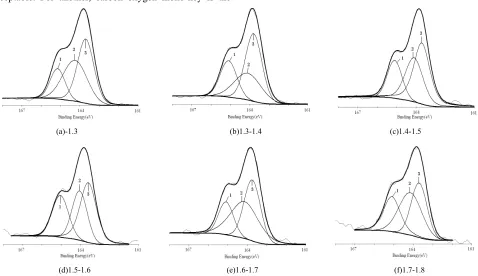
With the separating and fitting of carbon spectrum, the best effect is shown in Chart 2. With a reference to the research achievement made by Luo Yunfei[12], Chang Haizhou, Duan Xuqin and other professionals in the occurrence of coal surface carbon, the scope of electronic binding energy is as follows: the peak near 290.0eV falls into carboxyl(COO—), the peak of 287—288eV are assigned to carbonyl(C=O), the peak near 286.5eV indicates the existence of phenol carbon or ether carbon (C—O), and the peak around 285.0eV infers the existence of aroma unit and its substitute for paraffin (C—C、C—H) respectively. There are three peaks of binding energy in a high-to-low order in Chart 2.
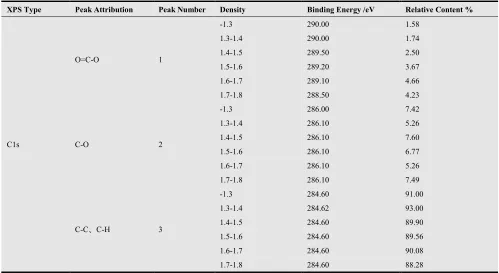
In accordance with the position of binding energy, three attribution groups of carbon are determined, with the calculation of relative content made in line with the peak areas. The binding energy position, peak attribution group, peak number and relative content shall be referred to what is shown in Table 1.
(d)1.5-1.6 (e)1.6-1.7 (f)1.7-1.8
Fig 2. XPS Fitting Spectrum of C1s of Different Densities in the Sample Coal
Table 2. The Peak Attribution & Relative Content of the Cls XPS of Different Densities in the Sample Coal
XPS Type Peak Attribution Peak Number Density Binding Energy /eV Relative Content %
C1s
O=C-O 1
-1.3 290.00 1.58
1.3-1.4 290.00 1.74
1.4-1.5 289.50 2.50
1.5-1.6 289.20 3.67
1.6-1.7 289.10 4.66
1.7-1.8 288.50 4.23
C-O 2
-1.3 286.00 7.42
1.3-1.4 286.10 5.26
1.4-1.5 286.10 7.60
1.5-1.6 286.10 6.77
1.6-1.7 286.10 5.26
1.7-1.8 286.10 7.49
C-C、C-H 3
-1.3 284.60 91.00
1.3-1.4 284.62 93.00
1.4-1.5 284.60 89.90
1.5-1.6 284.60 89.56
1.6-1.7 284.60 90.08
1.7-1.8 284.60 88.28
The content of carbonyl is rather low despite its wide distribution in the coal, from peat cube to anthracite coal. It exists largely in the form of quinonyl in high-coalification coal. Carbonyl occurs in peat cube, bovey coal and weathered coal, but hardly exists in bituminous coal. It can be discovered from what is shown in Table 1 that there is no attribute peak within the scope of 287—288eV, with the indication in the sample coal of virtually zero content of carbonyl (C=0) and the content of 5.00% carboxyl revealing high coalification. C—C constitutes the majority to show a high percentage of alkyl lateral chain in the sample coal. This corresponds to what is shown in the sample coal in terms of highly metamorphic coking coal. C-C constitutes a majority in the sample, showing a high content of alkyl side chain. With the increase of the density, there come some changes with the existing forms of there types of carbon. As is shown in Table 3, there is a slight decrease of relative content of C-C, no change of that of C-O and a slight increase of that of O=C-O.
Fig 3. The Peak Attribution & Relative Content of the C1s of Different Densities in the Sample Coal
3.2. The Occurrence Shape of Oxygen in the Coal Surface Texture
T holds that 532.75eV and 532.8eV are defined as the double-key attribute peak of carbon oxygen(C-O) and the mono-key attribute peak of carbon oxygen(C-O) [13] while GARDNER S D holds the opposite opinion[14]. WATN ER C D maintains that the electronic binding position of the double-key attribute peak of carbon oxygen(C-O) is
531.6eV while that of the mono-key attribute peak of carbon oxygen(C-O) is 533.3eV[15].
Yang Zhiyuan has made a separation of carboxyl and carbonyl to divide the oxygen in the coal into 3 forms, i.e.,
carboxyl(O=C-O 531.3±0.2eV),carbon oxygen
key(C-O,532.8±0.3eV)and carbonyl(C=O,534.1±0.4eV) [3].
(a)-1.3 (b)1.3-1.4 (c)1.4-1.5
ε
''
(d)1.5-1.6 (e)1.6-1.7 (f)1.7-1.8
Fig 4. XPS Fitting Spectrum of O1s of Different Densities in the Sample Coal
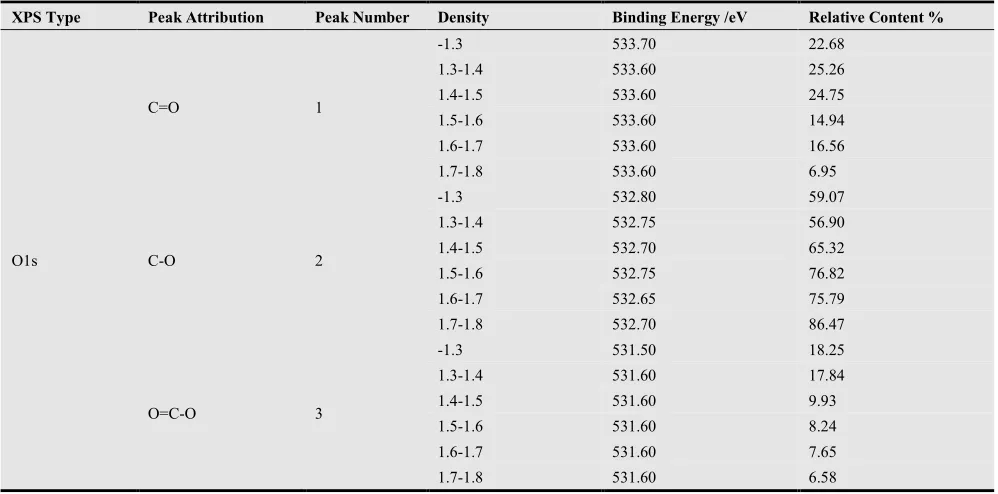
XPS fitting spectrum of the sample coal with three peaks in Fenxi County is shown in Chart 3, with their position of binding energy, attribute group, peak number and relative content shown in Chart 2.
Table 3. The Peak Attribution & Relative Content of the Ols XPS of Different Densities in the Sample Coal
XPS Type Peak Attribution Peak Number Density Binding Energy /eV Relative Content %
O1s
C=O 1
-1.3 533.70 22.68
1.3-1.4 533.60 25.26
1.4-1.5 533.60 24.75
1.5-1.6 533.60 14.94
1.6-1.7 533.60 16.56
1.7-1.8 533.60 6.95
C-O 2
-1.3 532.80 59.07
1.3-1.4 532.75 56.90
1.4-1.5 532.70 65.32
1.5-1.6 532.75 76.82
1.6-1.7 532.65 75.79
1.7-1.8 532.70 86.47
O=C-O 3
-1.3 531.50 18.25
1.3-1.4 531.60 17.84
1.4-1.5 531.60 9.93
1.5-1.6 531.60 8.24
1.6-1.7 531.60 7.65
Fig 5. The Peak Attribution & Relative Content of the Ols of Different Densities in the Sample Coal
The three positions of binding energy are 533.60eV, 532.75eV and 531.60eV respectively. The research in this paper has established that 532.75eV is the attribute peak of carbon oxygen mono-key and 533.60eV、531.60eV are the positions of C=O、O=C-O respectively. For one reason, the above-mentioned position of binding energy has a similar outcome as what has been found by Yang Zhiyuan, which is acceptable. For another, carbon oxygen mono-key is the
major existing form of the oxygen in the coal, with the support of the analysis outcome in a mutual way.
With the changes of the density, there come obvious regularities of the relative content of the oxygen in the coal. From Table 4, we can learn that the relative content of carboxyl and carbonyl decrease respectively while that of carbon oxygen of mono-key increases.
3.3. The Occurrence Shape of Sulfur in the Coal Texture
Different from inorganic sulfur, the research into the occurrence mode has more eyes on the organic sulfur in the coal, which involves sulfide (alcohol), thiophene, sulfones, sulfur dioxide, etc. Scholars have roughly got the consensus of the distribution scope of electronic binding energy as 162.2~164eV, 164~164.4eV, 165~168eV, 169~ 171eV[15]. XPS fitting spectrum of S2p is shown in Chart 4, from which we can discover 3 peaks, with the attribution groups and their respective content referred to Table 3.
(a)-1.3 (b)1.3-1.4 (c)1.4-1.5
(d)1.5-1.6 (e)1.6-1.7 (f)1.7-1.8
Fig 6. XPS Fitting Spectrum of S2p of Different Densities in the Sample Coal
Table 4. The Peak Attribution & Relative Content of the S2p XPS of Different Densities in the Sample Coal
XPS Type Peak Attribution Peak Number Density Binding Energy /eV Relative Content %
S2p
(sub) Sulfone 1
-1.3 165.15 17.40
1.3-1.4 165.10 24.13
1.4-1.5 165.10 21.16
1.5-1.6 165.05 26.67
1.6-1.7 165.10 18.62
1.7-1.8 165.10 26.49
Thiophene 2
-1.3 164.25 38.50
1.3-1.4 164.10 28.77
1.4-1.5 164.10 33.03
XPS Type Peak Attribution Peak Number Density Binding Energy /eV Relative Content %
1.6-1.7 164.15 43.30
1.7-1.8 164.15 38.94
Thio-alcohol(ether) 3
-1.3 163.70 44.10
1.3-1.4 163.80 47.10
1.4-1.5 163.70 45.81
1.5-1.6 163.60 43.86
1.6-1.7 163.75 38.08
1.7-1.8 163.70 34.57
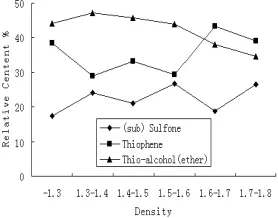
The 3 forms of occurrence modes of the organic sulfur in the coal are sulfide (alcohol), thiophene, and sulfones in the high-to-low order of relative content. The regularities of their changes are shown in Chart 6. With the increase of the density, total content of the former two is on the increase, with no obvious regularity in terms of either specific one, and sulfones show a decrease of relative content.
Fig 7. The Peak Attribution & Relative Content of the S2p of Different Densities in the Sample Coal
4. Conclusion
(1) There is an extremely low content of nitrogen in the sample coal in Fenxi County, with no attribute peak of N in XPS spectrum.
(2) The framework of C-C, which accounts for 90%, is the major existing form of the carbon in the coal, showing a high content of alkyl side chain in the coal of Fenxi County. There is virtually zero content of C=O and a low content of O=C-O. With the increase of the density, the framework of C-C tends to decrease in content.
(3) There are three existing forms of O in the surface texture of the sample coal in Fenxi County: C-O, C=O and O=C-O, with C-O accounting for more than 60%. With the increase of the density, the relative content of C-O tends to increase.
(4) The contents of respective groups in the organic sulfur in a high-low order is thio-alcohol(ether), thiophene, and (sub) sulfone. The second and the third can be classified into the structure of conjugate class. As for the atoms of sulfur, the structure of conjugate class is more stable than that of fat class. The total content of the two forms of sulfur increases with density, and their relatively increasing content makes it more difficult for the deprivation of the sulfur from the coal.
References
[1] Wu Zhenglong,Liu Jie.Progress of new techniques in modern X-ray photoelectron spectroscopy(XPS) [J]. Modern Instruments, 2006,(1):50~53.
[2] Frost D C,Leeder W R,Tappling R L.X-ray photoelectron spectroscopic investigation of coal [J]. Fuel, 1974, 53(3):206-211.
[3] Yang Zhiyuan, Zhou Anning, Zhanghong. The Research into Photochemical and oxygenated XPS Research into Different Levels of Density Components of Coal in Shenfu Coalmine [J]. The Journal of China University of Mining and Technology, 2010, 39(1):98-103.
[4] Shixiong Hao, Jie Wena, Xiaopeng Yu. Effect of the surface oxygen groups on methane adsorption on coals [J]. Applied Surface Science,2013,264:433-442.
[5] Wallace S, Bartl E K D, Perry D L. Quantification of nit rogen functional groups in coal and coal derived products[J].Fuel,1989,68(11):1450-1455.
[6] Hiroyuki Kawashima, Koji Koyano, Toshimasa
Takanohashi.Changes in nitrogen functionality due to solvent extraction of coal during HyperCoal production[J]. Fuel Processing Technology, 2013,106:275-280.
[7] J.L. Figueiredo, M.F.R. Pereira, M.M.A. Freitas, J.J.M. Orfao. Modification of the surface chemistry of activated carbons[J]. Carbon,1999,37:1379-1389.
[8] Duan Xuqin,Wang Zuna.XPS analysis of oxygen contained functional group in coal macerals[J]. Journal of Liaoning Technical University(Natural Science), 2010,29(3):498-501.
[9] Gong B,Pigram P J,Lamb R N.Surface studies of low temperature oxidation of bituminous coal vitrain bands using XPS and SIMS[J]. Fuel,1998, 77(9/10):1081-1087.
[10] Mitsuyoshi Muraoka, Hiroyuki Tomonaga, Masatoshi Nagai. Ammonia-treated brown coal and its activity for oxygen reduction reaction in polymer electrolyte fuel cell[J].Fuel,2012,97(211-218).
[11] Ge Tao.Research on Chemical Speciation of Sulfur in Cooking Coal of Fenxi County[J].Journal of Anhui
University of Science and Technology(Natural
Science),2013.33(4):12-14.
[13] Grzybek T, Pietrzak R, Wachowska H. X-ray photoelectron spectroscopy study of oxidized coalswith different sulphur content[J]. Fuel Process Technol, 2002,17: 77-78.
[14] Gardner S D, Singamsety C S K, Booth GL, Hegr, Pittman J C U. Surface characterization of carbon fibers using angle resolved XPS and ISS [J]. Carbon, 1995, 33(5): 587-595.
[15] Watn ER C D, Riggs W M. Handbook of X-ray photoelectron spectroscopy[M]. M innesota: Perkin-Elmer Corporation, Physical Electronics D ivision, 1978.