Bayesian Estimation of Causal Direction in Acyclic
Structural Equation Models with Individual-specific
Confounder Variables and Non-Gaussian Distributions
Shohei Shimizu [email protected]
The Institute of Scientific and Industrial Research Osaka University
Mihogaoka 8-1, Ibaraki, Osaka 567-0047, Japan
Kenneth Bollen [email protected]
Department of Sociology, CB 3210 Hamilton Hall University of North Carolina
Chapel Hill, NC 27599-3210 U.S.A.
Editor:David Maxwell Chickering
Abstract
Several existing methods have been shown to consistently estimate causal direction assum-ing linear or some form of nonlinear relationship and no latent confounders. However, the estimation results could be distorted if either assumption is violated. We develop an approach to determining the possible causal direction between two observed variables when latent confounding variables are present. We first propose a new linear non-Gaussian acyclic structural equation model with individual-specific effects that are sometimes the source of confounding. Thus, modeling individual-specific effects as latent variables allows latent confounding to be considered. We then propose an empirical Bayesian approach for estimating possible causal direction using the new model. We demonstrate the effectiveness of our method using artificial and real-world data.
Keywords: structural equation models, Bayesian networks, estimation of causal direc-tion, latent confounding variables, non-Gaussianity
1. Introduction
Aids to uncover the causal structure of variables from observational data are welcomed additions to the field of machine learning (Pearl, 2000; Spirtes et al., 1993). One conventional approach makes use of Bayesian networks (Pearl, 2000; Spirtes et al., 1993). However, these suffer from the identifiability problem. That is, many different causal structures give the same conditional independence between variables, and in many cases one cannot uniquely estimate the underlying causal structure without prior knowledge (Pearl, 2000; Spirtes et al., 1993).
machine learning (Spirtes et al., 2010; Moneta et al., 2011). If causal relations exist among variables, LiNGAM uses their non-Gaussian distributions to identify the causal structure among the variables. LiNGAM is closely related to independent component analysis (ICA) (Hyv¨arinen et al., 2001b); the identifiability proof and estimation algorithm are partly based on the ICA theory. The idea of LiNGAM has been extended in many directions, including to nonlinear cases (Hoyer et al., 2009; Lacerda et al., 2008; Hyv¨arinen et al., 2010; Zhang and Hyv¨arinen, 2009; Peters et al., 2011a).
Many causal discovery methods including LiNGAM make the strong assumption of no latent confounders (Spirtes and Glymour, 1991; Dodge and Rousson, 2001; Shimizu et al., 2006; Hyv¨arinen and Smith, 2013; Hoyer et al., 2009; Zhang and Hyv¨arinen, 2009). These methods have been used in various application fields (Ramsey et al., 2014; Rosenstr¨om et al., 2012; Smith et al., 2011; Statnikov et al., 2012; Moneta et al., 2013). However, in many areas of empirical science, it is often difficult to accept the estimation results because latent confounders are ignored. In theory, we could take a non-Gaussian approach (Hoyer et al., 2008b) that uses an extension of ICA with more latent variables than observed variables (overcomplete ICA) to formally consider latent confounders in the framework of LiNGAM. Unfortunately, current versions of the overcomplete ICA algorithms are not very computationally reliable since they often suffer from local optima (Entner and Hoyer, 2011).
Thus, in this paper, we propose an alternative Bayesian approach to develop a method that is computationally simple in the sense that no iterative search in the parameter space is required and it is capable of finding the possible causal direction of two observed vari-ables in the presence of latent confounders. We first propose a variant of LiNGAM with individual-specific effects. Individual differences are sometimes the source of confounding (von Eye and Bergman, 2003). Thus, modeling certain individual-specific effects as latent variables allows a type of latent confounding to be considered. A latent confounding vari-able is an unobserved varivari-able that exerts a causal influence on more than one observed variables (Hoyer et al., 2008b). The new model is still linear but allows any number of latent confounders. We then present a Bayesian approach for estimating the model by integrating out some of the large number of parameters, which is of the same order as the sample size. Such a Bayesian approach is often used in the field of mixed models (Demidenko, 2004) and multilevel models (Kreft and De Leeuw, 1998), although estimation of causal direction is not a topic studied within it.
Granger causality (Granger, 1969) is another popular method to aid detection of causal direction. His method depends on the temporal ordering of variables whereas our method does not. Therefore, our method can be applied to cases where temporal information is not available, i.e., cross-sectional data, as well as those where it is available, i.e., time-series data.
2. Background
In this section, we first review the linear non-Gaussian structural equation model known as LiNGAM (Shimizu et al., 2006). We then discuss an extension of LiNGAM to cases where latent confounding variables exist (Hoyer et al., 2008b).
In LiNGAM (Shimizu et al., 2006), causal relations between observed variables xl (l= 1,· · · , d) are modeled as
xl = µl+
X
k(m)<k(l)
blmxm+el, (1)
where k(l) is a causal ordering of the variables xl. The causal orders k(l) (l = 1,· · · , d) are unknown and to be estimated. In this ordering, the variablesxl form a directed acyclic graph (DAG) so that no later variable determines, i.e., has a directed path to, any earlier variable in the DAG. The variableselare latent continuous variables called error variables,
µl are intercepts or regression constants, and blm are connection strengths or regression coefficients.
In matrix form, the LiNGAM model in Equation (1) is written as
x = µ+Bx+e, (2)
where the vectorµcollects constantsµl, the connection strength matrixBcollects regression coefficients (or connection strengths)blm, and the vectorsxandecollect observed variables
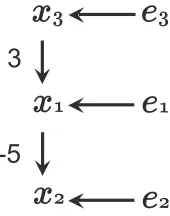
xl and error variablesel, respectively. The zero/non-zero pattern ofblm corresponds to the absence/existence pattern of directed edges (direct effects). It can be shown that it is always possible to perform simultaneous, equal row and column permutations on the connection strength matrix B to cause it to become strictly lower triangular, based on the acyclicity assumption (Bollen, 1989). Here, strict lower triangularity is defined as a lower triangular structure with the diagonal consisting entirely of zeros. Errors el follow non-Gaussian distributions with zero mean and non-zero variance, and are jointly independent. This model without assuming non-Gaussianity distribution is called a fully recursive model in conventional structural equation models (Bollen, 1989). The non-Gaussianity assumption onelenables the identification of a causal orderingk(l) and the coefficientsblmbased only on x (Shimizu et al., 2006), unlike conventional Bayesian networks based on the Gaussianity assumption on el (Spirtes et al., 1993). To illustrate the LiNGAM model, the following example is considered, whose corresponding directed acyclic graph is provided in Figure 1:
x1 x2 x3 =
0 0 3
−5 0 0
0 0 0
x1 x2 x3 + e1 e2 e3 .
In this example, x3 is equal to error e3 and is exogenous since it is not affected by either
of the other two variables x1 and x2. Thus, x3 is in the first position of such a causal
ordering such that B is strictly lower triangular, x1 is in the second, and x2 is the third,
i.e., k(3) = 1, k(1) = 2, and k(2) = 3. If we permute the variables x1 tox3 according to
the causal ordering, we have
x3 x1 x2 =
0 0 0
3 0 0
0 −5 0
x
1x
3e
3e
1x
2e
23
-5
Figure 1: An example graph of LiNGAMs
It can be seen that the resulting connection strength (or regression coefficient) matrix is strictly lower triangular.
Several computationally efficient algorithms for estimating the model have been pro-posed (Shimizu et al., 2006, 2011; Hyv¨arinen and Smith, 2013). As with ICA, LiNGAM is identifiable under the assumptions of non-Gaussianity and independence among error variables (Shimizu et al., 2006; Comon, 1994; Eriksson and Koivunen, 2003).1 However, for the estimation methods to be consistent, additional assumptions, e.g., the existence of their moments or some other statistic, must be made to ensure that the statistics computed in the estimation algorithms exist. The idea of LiNGAM can be generalized to nonlinear cases (Hoyer et al., 2009; Tillman et al., 2010; Zhang and Hyv¨arinen, 2009; Peters et al., 2011b). The assumption of independence among el means that there is no latent confounding variable (Shimizu et al., 2006). A latent confounding variable is an unobserved variable that contributes to the values of more than one observed variable (Hoyer et al., 2008b). However, in many applications, there often exist latent confounding variables. If such latent confounders are completely ignored, the estimation results can be seriously biased (Pearl, 2000; Spirtes et al., 1993; Bollen, 1989). Therefore, in Hoyer et al. (2008b), LiNGAM with latent confounders, called latent variable LiNGAM, was proposed, and the model can be formulated as follows:
xl = µl+
X
k(m)<k(l)
blmxm+ Q
X
q=1
λlqfq+el,
where fq are non-Gaussian individual-specific effects fq with zero mean and unit variance and λlq denote the regression coefficients (connection strengths) fromfq toxl. This model is written in matrix form as follows:
x = µ+Bx+Λf +e, (3)
where the difference from LiNGAM in Equation (2) is the existence of a latent confounding variable vector f. The vector f collects fq. The matrix Λ collects λlq and is assumed to
be of full column rank. Another way to represent latent confounder cases would be to use dependent error variables. DenotingΛf +e in Equation (3) by ˜e, we have
x = µ+Bx+Λf +e
= µ+Bx+ ˜e,
where ˜ei are dependent due to the latent confoundersfq. Observed variables that are equal to dependent errors ˜ei are connected by bi-directed arcs in their graphs. An example graph is given in Figure 4. This representation can be more general since it is easier to extend it to represent nonlinearly dependent errors. In this paper, however, we use the aforementioned representation using independent errors and latent confounders since linear relations of the observed variables, latent confounders, and errors are necessary for our approach.
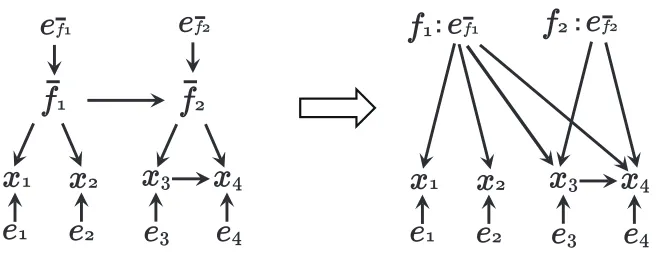
Without loss of generality, the latent confoundersfq are assumed to be jointly indepen-dent since any depenindepen-dent latent confounders can be remodeled by linear combinations of independent latent variables if the underlying model is linear acyclic and the error variables are independent (Hoyer et al., 2008b). To illustrate this, the following example model is considered:
¯
f1 = ef¯1 (4)
¯
f2 = ω21f¯1+ef¯2 (5) x1 = λ11f¯1+e1
x2 = λ21f¯1+e2 x3 = λ32f¯2+e3
x4 = b43x3+λ42f¯2+e4,
where errors ef¯1(= ¯f1), ef¯2, and e1–e4 are non-Gaussian and independent. The associated
graph is shown in Figure 2. The relations of ¯f1, ¯f2, andx1–x4 are represented by a directed
acyclic graph and latent confounders ¯f1and ¯f2are dependent. In matrix form, this example
model can be written as
x1 x2 x3 x4 =
0 0 0 0
0 0 0 0
0 0 0 0
b43 0 0 0
x1 x2 x3 x4 +
λ11 0 λ21 0
0 λ32
0 λ42
¯ f1 ¯ f2 + e1 e2 e3 e4 .
The relations of ¯f1 and ¯f2 toef¯1 and ef¯2 in Equations (4)–(5):
¯ f1 ¯ f2 = 1 0
ω21 1
ef¯1 ef¯2
e
1x
1f
1f
2e
f2x
2x
3x
4e
4e
3e
2e
f1e
1x
1e
f2x
2x
3x
4e
4e
3e
2e
f1f
2f
1: :Figure 2: An example graph to illustrate the idea of independent latent confounders.
we obtain x1 x2 x3 x4
| {z }
x =
0 0 0 0
0 0 0 0
0 0 0 0
b43 0 0 0
| {z }
B x1 x2 x3 x4
| {z }
x +
λ11 0 λ21 0 λ32ω21 λ32 λ42ω21 λ42
| {z }
Λ
ef¯1 ef¯2
| {z }
f + e1 e2 e3 e4
| {z }
e
.
This is a latent variable LiNGAM in Equation (3) taking f1 =ef¯1 and f2 = ef¯2 sinceef¯1
and ef¯2 are non-Gaussian and independent.
Moreover, the faithfulness of xl and fq to the generating graph is assumed. The faith-fulness assumption (Spirtes et al., 1993) here means that when multiple causal paths exist from one variable to another, their combined effect does not equal exactly zero (Hoyer et al., 2008b). The faithfulness assumption can be considered to be not very restrictive from the Bayesian viewpoint (Spirtes et al., 1993) since the probability of having exactly the parameter values that do not satisfy faithfulness is zero (Meek, 1995).
In the framework of latent variable LiNGAM, it has been shown (Hoyer et al., 2008b) that the following three models are distinguishable based on observed data,2 i.e., the three
different causal structures induce different data distributions:
Model 3 :
(
x1= PQq=1λ1qfq+e1 x2= PQq=1λ2qfq+e2,
Model 4 :
(
x1= PQq=1λ1qfq+e1 x2=b21x1+PqQ=1λ2qfq+e2,
Model 5 :
(
x1=b12x2+PqQ=1λ1qfq+e1 x2= PQq=1λ2qfq+e2,
,
where λ1qλ2q 6= 0 due to the definition of latent confounders, that is, that they contribute to determining the values of more than two variables.
An estimation method based on overcomplete ICA (Lewicki and Sejnowski, 2000) explic-itly modeling all the latent confounders fq was proposed (Hoyer et al., 2008b). However, in current practice, overcomplete ICA estimation algorithms often get stuck in local op-tima and are not sufficiently reliable (Entner and Hoyer, 2011). A Bayesian approach for estimating the latent variable LiNGAM in Equation (3) has been proposed in Henao and Winther (2011). These previous approaches that explicitly model latent confounders (Hoyer et al., 2008b; Henao and Winther, 2011) need to select the number of latent confounders, and which can be quite large. This could lead to further computational difficulty and statistically unreliable estimates.
In Chen and Chan (2013), a simple approach based on fourth-order cumulants for esti-mating latent variable LiNGAM was proposed. Their approach does not need to explicitly model the latent confounders, however it requires the latent confounders fq to be Gaus-sian. The development of nonlinear methods that incorporate latent confounders is ongoing (Zhang et al., 2010).
None of these latent confounder methods incorporate the individual-specific effects that we model in the next section to consider latent confounders fq in the latent variable LiNGAM of Equation (3).
3. Linear Non-Gaussian Acyclic Structural Equation Model with Individual-specific Effects
In this section, we propose a new Bayesian method for learning the possible causal direction of two observed variables in the presence of latent confounding variables, assuming that the causal relations are acyclic, i.e., there is not a feedback relation.
3.1 Model
The LiNGAM (Shimizu et al., 2006) for observationican be described as follows:
x(li) = µl+
X
k(m)<k(l)
The random variablese(li)are non-Gaussian and independent. The distributions ofe(li) (i= 1,· · · , n) are commonly assumed to be identical3 for every l. A linear non-Gaussian acyclic structural equation model with individual-specific effects for observationiis formulated as follows:
x(li) = µl+ ˜µ(li)+
X
k(m)<k(l)
blmx(mi)+e (i) l ,
where the difference from LiNGAM is the existence of individual-specific effects ˜µ(li). The parameters ˜µ(li) are independent ofel(i) and are correlated with x(li) through the structural equations in our Bayesian approach, introduced below. This means that the observations are generated from the identifiable LiNGAM, possibly with different parameter values of the meansµl+ ˜µ(li). We call this a mixed-LiNGAM, named after mixed models (Demidenko, 2004), as it has effects µl and blm that are common to all the observations and individual-specific effects ˜µ(li). We note that causal orderings of variables k(l) (l = 1,· · ·, d) are identical for all the observations in the sample.
To use a Bayesian approach for estimating the mixed-LiNGAM, we need to model the distributions of error variables el and prior distributions of the parameters includ-ing individual-specific effects ˜µ(li), unlike previous LiNGAM methods (Shimizu et al., 2006; Hoyer et al., 2008b). These individual-specific effects, whose number is of the same order as the sample size, are integrated out in the Bayesian method developed in Section 3.2, assum-ing an informative prior for them similar to the estimation of conventional mixed models (Demidenko, 2004). More details on the distributions of error variables and prior distribu-tions of parameters are given in Section 3.2. These distributional assumpdistribu-tions were implied to be robust to some extent to their violations, at least in the artificial data experiments of Section 4.
We now relate the mixed-LiNGAM model above with the latent variable LiNGAM (Hoyer et al., 2008b). The latent variable LiNGAM in Equation (3) for observation i is written as follows:
x(li) = µl+
X
k(m)<k(l)
blmx(mi)+ Q
X
q=1 λlqfq(i)
| {z }
˜ µ(li)
+e(li).
This is a mixed-LiNGAM taking ˜µ(li)=PQ
q=1λlqf (i)
q . In contrast to the previous approaches for latent variable LiNGAM (Hoyer et al., 2008b; Henao and Winther, 2011), we do not explicitly model the latent confounders fq and rather simply include their sums ˜µ(li) =
PQ
q=1λlqf (i)
q in our model as its parameters since our main interest lies in estimation of the causal relation of observed variables xl and not in the estimation of their relations with latent confounders fq. Our method does not estimate λlq or the number of latent confounders Q.
3.2 Estimation of Possible Causal Direction
We apply a Bayesian approach to estimate the possible causal direction of two observed variables using the LiNGAM proposed above. We compare the following two mixed-LiNGAM models with opposite possible directions of causation. Model 1 is
x(1i) = µ1+ ˜µ(1i)+e (i) 1
x2(i) = µ2+ ˜µ2(i)+b21x(1i)+e (i) 2 ,
whereb21 is non-zero. In Model 1, x2 does not cause x1. The second model, Model 2, is
x(1i) = µ1+ ˜µ(1i)+b12x(2i)+e(1i) x(2i) = µ2+ ˜µ(2i)+e
(i) 2 ,
where b12 is non-zero. In Model 2, x1 does not cause x2. The two models have the same
number of parameters, but opposite possible directions of causation.
Once the possible causal direction is estimated, one can see if the common causal co-efficient (connection strength) b21 or b12 is likely to be zero by examining its posterior
distribution.4 We focus here on estimating the possible direction of causation as in many previous works (Dodge and Rousson, 2001; Hoyer et al., 2009; Zhang and Hyv¨arinen, 2009; Chen and Chan, 2013; Hyv¨arinen and Smith, 2013), and do not go to the computation of the posterior distribution5 since estimation of the possible causal direction of two observed variables in the presence of latent confounders has been a very challenging problem in causal inference and is the main topic of this paper.
We apply standard Bayesian model selection techniques to help assess the causal direc-tion of x1 and x2. We use the log-marginal likelihood for comparing the two models. The
model with the larger log-marginal likelihood is regarded as the closest to the true model (Kass and Raftery, 1995).
Let D be the observed data set [x(1)T,· · · ,x(n)T]T, where x(i) = [x(i) 1 , x
(i)
2 ]T. Denote
Models 1 and 2 byM1 and M2. The log-marginal likelihoods of M1 andM2 are
log{p(Mr|D)} = log{p(D|Mr)p(Mr)/p(D)}
= log{p(D|Mr)}+ log{p(Mr)} −logp(D) = log{
Z
p(D|θr, Mr)p(θr|Mr,ηr)dθr} + logp(Mr)−logp(D) (r = 1,2),
whereη1,η2 are the hyper-parameter vectors regarding the distributions of the parameters θ1 andθ2, respectively. Since the last term logp(D) is constant with respect toMr, we can drop it. To select suitable values for these hyper-parameters, we take an ordinary empirical Bayesian approach. First, we compute the log-marginal likelihood for every combination
4. Chickering and Pearl (1996) considered a discrete variable model withknownpossible causal direction and proposed a Bayesian approach for computing the posterior distributions of causal effects in the presence of latent confounders.
of the two models Mr and a number of candidate hyper-parameter values of ηr. Next, we take the model and hyper-parameter values that give the largest log-marginal likelihood, and finally estimate that the model with the largest log-marginal likelihood is better than the other model.
In basic LiNGAM (Shimizu et al., 2006), we have (Hyv¨arinen et al., 2010; Hoyer and Hyttinen, 2009)
p(x) = Y l
pel
xl−µl−
X
k(m)<k(l) blmxm
.
Thus, in the same manner, the likelihoods under mixed-LiNGAM p(D|θr, Mr) (r = 1,2) are given by
p(D|θr, Mr) = Πni=1 p(x(i)|θr, Mr)
=
Πni=1 pe(i) 1
(x(1i)−µ1−µ˜(1i)|θ1, M1) × pe(i)
2
(x(2i)−µ2−µ˜(2i)−b21x(1i)|θ1, M1) forM1
Πni=1 pe(i) 1
(x(1i)−µ1−µ˜1(i)−b12x2(i)|θ2, M2) × p
e(2i)(x (i)
2 −µ2−µ˜2(i)|θ2, M2) for M2
.
We model the parameters and their prior distributions as follows.6 The prior probabil-ities ofM1 and M2 are uniform:
p(M1) = p(M2).
The distributions of the error variables e(1i) and e(2i) are modeled by Laplace distributions with zero mean and variances of var(e(1i)) =h21 and var(e(2i)) =h22 as follows:
p
e(1i)
= Laplace(0,|h1|/ √
2)
pe(i) 2
= Laplace(0,|h2|/ √
2).
Here, we simply use a symmetric super-Gaussian distribution, i.e., the Laplace distribution, to modelpe(i)
1
andpe(i) 2
, as suggested in Hyv¨arinen and Smith (2013). Such super-Gaussian distributions have been reported to often work well in non-Gaussian estimation methods in-cluding independent component analysis and LiNGAM (Hyv¨arinen et al., 2001b; Hyv¨arinen and Smith, 2013). In some cases, a wider class of non-Gaussian distributions might provide a better model for pe(i)
1
and pe(i) 2
, e.g., the generalized Gaussian family (Hyv¨arinen et al.,
2001b), a finite mixture of Gaussians, or an exponential family distribution combining the Gaussian and Laplace distributions (Hoyer and Hyttinen, 2009).
The parameter vectors θ1 and θ2 are written as follows:
θ1 = [µl, b21, hl,µ˜l(i)]T (l= 1,2;i= 1,· · · , n) θ2 = [µl, b12, hl,µ˜l(i)]T (l= 1,2;i= 1,· · · , n).
The prior distributions of common effects are Gaussian as follows:
µ1 ∼ N(0, τµcmmn1 ) µ2 ∼ N(0, τµcmmn2 ) b12 ∼ N(0, τbcmmn12 ) b21 ∼ N(0, τbcmmn21 ) h1 ∼ N(0, τhcmmn1 ) h2 ∼ N(0, τhcmmn2 ),
whereτcmmn µ1 ,τ
cmmn µ2 ,τ
cmmn b12 ,τ
cmmn b21 ,τ
cmmn h1 and τ
cmmn
h2 are constants.
Generally speaking, we could use various informative prior distributions for the individual-specific effects and then compare candidate priors using the standard model selection ap-proach based on the marginal likelihoods. Below we provide two examples.
If the data is generated from a latent variable LiNGAM, a special case of mixed-LiNGAM, as shown in Section 3.1, the individual-specific effects are the sums of many non-Gaussian independent latent confounders fq and are dependent. The central limit theorem states that the sum of independent variables becomes increasingly close to the Gaussian (Billingsley, 1986). Therefore, in many cases, it could be practical to approxi-mate the non-Gaussian distribution of a variable that is the sum of many non-Gaussian and independent variables by a bell-shaped curve distribution (Sogawa et al., 2011; Chen and Chan, 2013). This motivates us to model the prior distribution of individual-specific effects by the multivariate t-distribution as follows:
"
˜
µ(1i)
˜
µ(2i)
#
= diag
q
τ1indvdl,
q
τ2indvdl
T!
C−1/2u, (6)
where τ1indvdl and τ2indvdl are constants, u ∼ tν(0,Σ) and Σ = [σab] is a symmetric scale matrix whose diagonal elements are 1s. A random variable vector u that follows the mul-tivariate t-distribution tν(0,Σ) can be created by √y
v/ν, where y follows the Gaussian distributionN(0,Σ),v follows the chi-squared distribution withν degrees of freedom, and yandvare statistically independent (Kotz and Nadarajah, 2004). Note thatui have energy correlations (Hyv¨arinen et al., 2001a), i.e., correlations of squares cov(u2i, u2j) > 0 due to the common variable v. Cis a diagonal matrix whose diagonal elements give the variance of elements ofu, i.e., C= ν−ν2diag(Σ) for ν >2. The degree of freedomν is here taken to be six. The kurtosis of the univariate Student’s t-distribution with six degrees of freedom is three, the same as that of the Laplace distribution.
The hyper-parameter vectors η1 and η2 are
ηl = [τµcmmn1 , τµcmmn2 , τbcmmn12 , τbcmmn21 , τhcmmn1 , τhcmmn2 , τ1indvdl, τ2indvdl, σ21]T (l= 1,2).
We want to take the constants τµcmmn1 , τµcmmn2 , τbcmmn 12 , τ
cmmn b21 , τ
cmmn h1 and τ
cmmn h2 to
be sufficiently large so that the priors for the common effects are not very informative. It depends on the scales of variables when these constants are sufficiently large. In the experiments in Sections 4–5, we setτµcmmn1 =τbcmmn
12 =τ cmmn h1 = 10
2×
c
τbcmmn 21 = τ
cmmn h2 = 10
2 ×
c
var (x2) so that they reflect the scales of the corresponding
variables.
Moreover, we take an empirical Bayesian approach for the individual-specific effects. We testτlindvdl= 0,0.22×var(c xl), ...,0.82×var(c xl),1.0
2×
c
var(xl) (l= 1,2). That is, we uniformly vary the hyper-parameter value from that with no individual-specific effects, i.e., 0, to a larger value, i.e., 1.02×var(c xl), which implies very large individual differences. Further, we test σ12 = 0,±0.3,±0.5,±0.7,±0.9, i.e., the value with zero correlation and larger values
with stronger correlations. This means that we test uncorrelated individual-specific effects as well as correlated ones. We take the ordinary Monte Carlo sampling approach to compute the log-marginal likelihoods with 1000 samples for the parameter vectorsθr (r= 1,2).
The assumptions for our model are summarized in Table 1. Generally speaking, if the actual probability density function of individual-specific effects is unimodal and most often provides zero or very small absolute values and with few large values, i.e., many of the individual-specific effects are close to zero and many individuals have similar intercepts, the estimation is likely to work. If the individuals have very different intercepts, the estimation will not work very well.
An alternative way of modeling the prior distribution of individual-specific effects would be to use the multivariate Gaussian distribution as follows:
"
˜
µ(1i)
˜
µ(2i)
#
= diag
q
τ1indvdl,
q
τ2indvdl
T!
z,
where τindvdl
1 and τ2indvdl are constants, z ∼ N(0,Σ) and Σ = [σab] is a symmetric scale matrix whose diagonal elements are 1s. This Gaussian prior would be effective if the Gaus-sian approximation based on the central limit theorem works well, although a non-GausGaus-sian prior would be more consistent with the non-Gaussian latent variable LiNGAM in Equa-tion (3). Gaussian individual-specific effects or latent confounders would not lead to losing the identifiability (Chen and Chan, 2013) since each observation still is generated by the identifiable non-Gaussian LiNGAM. However, if errors are Gaussian, there is no guarantee that our method can find correct possible causal direction. We could detect their Gaus-sianity by comparing our mixed-LiNGAM models with Gaussian error models based on their log-marginal likelihoods. If the errors are actually Gaussian or close to be Gaussian, Gaussian error models would provide larger log-marginal likelihoods. This would detect situations where our approach cannot find causal direction.
4. Experiments on Artificial Data
We compared our method with seven methods for estimating the possible causal direction between two variables: i) LvLiNGAM7 (Hoyer et al., 2008b); ii) SLIM8(Henao and Winther, 2011) iii) LiNGAM-GC-UK (Chen and Chan, 2013); iv) ICA-LiNGAM9 (Shimizu et al., 2006); v) DirectLiNGAM10 (Shimizu et al., 2011); vi) Pairwise LiNGAM11 (Hyv¨arinen
7. The code is available athttp://www.cs.helsinki.fi/u/phoyer/code/lvlingam.tar.gz. 8. The code is available athttp://cogsys.imm.dtu.dk/slim/.
Model: x(li)=µl+ ˜µ
(i)
l +
P
k(m)<k(l)blmx
(i)
m +e
(i)
l (l, m= 1,2;l6=m),
whereblmare non-zero.
e(li)(l= 1,2;i= 1,· · ·, n) are i.i.d.. el(l= 1,2) are mutually independent.
el(l= 1,2) follow Laplace distributions with zero mean and standard deviations|hl|.
Prior distributions:
µl,blm andhl(l= 1,2;m= 1,2;l6=m) follow Gaussian distributions with zero mean and varianceτµcmmnl , τcmmn
blm andτ cmmn hl .
˜
µ(li)(l= 1,2;i= 1,· · ·, n) are the sum of latent confoundersfq(i):PQq=1λlqfq(i) and are independent ofe(li).
˜
µ(li)(l= 1,2;i= 1,· · ·, n) are i.i.d..
µl(l= 1,2) follow multivariatet-distributions withνdegrees of freedom, zero mean, variancesτlindvdl
and correlationσ12(here,ν= 6). Hyper-parameters:
τcmmn
µl ,τbcmmnlm andτ cmmn
hl (l= 1,2;m= 1,2;l6=m) are set to be large values so that the priors are not
very informative. τindvdl
l (l= 1,2) are uniformly varied from zero to large values. σ12are uniformly varied in the interval between -0.9 and 0.9.
Table 1: Summary of the assumptions for our mixed-LiNGAM model
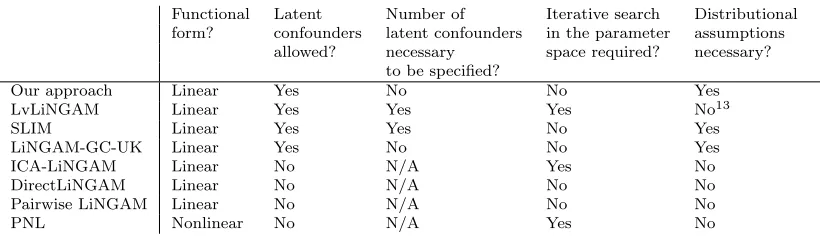
and Smith, 2013); vii) Post-nonlinear causal model (PNL)12(Zhang and Hyv¨arinen, 2009). Their assumptions are summarized in Table 2. The first seven methods assume linearity, and the eighth allows a very wide variety of nonlinear relations. The last four methods assume that there are no latent confounders. We tested the prior t- and Gaussian distributions for individual-specific effects in our approach. LvLiNGAM and SLIM require to specify the number of latent confounders. We tested 1 and 4 latent confounder(s) for LvLiNGAM since its current implementation cannot handle more than four latent confounders, whereas we tested 1, 4 and 10 latent confounders(s) for SLIM. LiNGAM-GC-UK (Chen and Chan, 2013) assumes that errors are simultaneously super-Gaussian or sub-Gaussian and that latent confounders are Gaussian.
Functional Latent Number of Iterative search Distributional form? confounders latent confounders in the parameter assumptions
allowed? necessary space required? necessary? to be specified?
Our approach Linear Yes No No Yes
LvLiNGAM Linear Yes Yes Yes No13
SLIM Linear Yes Yes No Yes
LiNGAM-GC-UK Linear Yes No No Yes
ICA-LiNGAM Linear No N/A Yes No
DirectLiNGAM Linear No N/A No No
Pairwise LiNGAM Linear No N/A No No
PNL Nonlinear No N/A Yes No
Table 2: Summary of the assumptions of eight methods
12. The code is available athttp://webdav.tuebingen.mpg.de/causality/CauseOrEffect_NICA.rar. 13. Their current implementation of LvLiNGAM in Footnote 7 assumes a non-Gaussian distribution, which
e
1
x
1
f
1
x
2
e
2
Figure 3: The associated graph of the model used to generate artificial data when the number of latent confoundersQ= 1.
We generated data using the following latent variable LiNGAM withQlatent confound-ing variables, which is a mixed-LiNGAM:
x(1i) = µ1+ Q
X
q=1
λ1qfq(i)+e (i) 1
x(2i) = µ2+b21x(1i)+ Q
X
q=1
λ2qfq(i)+e (i) 2 ,
where µ1 and µ2 were randomly generated from N(0,1), and b21, λ1q, λ2q were randomly generated from the interval (−1.5,−0.5)∪(0.5,1.5). We tested various numbers of latent confounders Q= 0,1,6,12. The zero values indicate that there are no latent confounders. An example graph used to generate artificial data is given in Figure 3.
The distributions of the error variables e1,e2, and latent confoundersfq were identical for all observations. The distributions of the error variables e1,e2, and latent confounders fq were randomly selected from the 18 non-Gaussian distributions used in Bach and Jordan (2002) to see if the Laplace distribution assumption on error variables and t- or Gaus-sian distribution assumption on individual-specific effects in our method were robust to different non-Gaussian distributions. These include symmetric/non-symmetric distribu-tions, super-Gaussian/sub-Gaussian distribudistribu-tions, and strongly/weakly non-Gaussian dis-tributions. The variances ofe1 and e2 were randomly selected from the interval (0.52,1.52).
The variances of fq were 1s.
We permuted the variables according to a random ordering and inputted them to the eight estimation methods. We conducted 100 trials, with sample sizes of 50, 100, and 200. For the data with the number of latent confoundersQ= 0, all the methods should find the correct causal direction for large enough sample sizes, as there were no latent confounders, which here means no individual-specific effects. The last four comparative methods should find the data with the number of latent confoundersQ = 1,6,12 very difficult to analyze, because, unlike the other approaches, they assume no latent confounders.
Looking at Table 3 as a whole there are several general observations that we can make. First though none of the procedures is infallible, several of them do quite well in that they choose the correct causal direction about 90% of the time. Second, overall our approach is the most successful across the conditions of the simulation. Specifically, in all but the cases of no confounding variables, one or both of our approaches have the highest percentages of success. In the situation of no confounding variables, ICA-LiNGAM, DirectLiNGAM, and Pairwise LINGAM have higher success percentages than our procedures. These generaliza-tions need qualificageneraliza-tions in that there are sampling errors that affect the estimates. Formal tests of significance across all conditions would be complicated. It would require taking account of multiple testing and the dependencies of the simulated samples under the same sample size and number of confounders. However, the standard errors of the estimated per-centages serve to caution the reader not to judge the perper-centages alone without recognizing sampling variability. For instance, when there are no confounders and a sample size of 50, the ICA-LiNGAM procedure appears best with 93% success, but the success percentages of our two approaches fall within two standard errors of the 93% estimate. Alternatively, in the rows with 6 confounders and sample size 50 our approach with 88% success and a stan-dard error of 3.25 appears sufficiently far from the success percentages of the other methods besides ours to make sampling fluctuations an unlikely explanation. In sum, taking all the evidence together, our approaches performed quite well and deserve further investigation under additional simulation conditions.
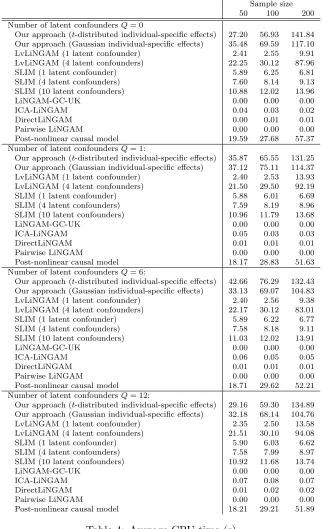
Table 4 shows the average computational times. The computational complexity of the current implementation of our methods is clearly larger than that of the other linear methods ICA-LiNGAM, DirectLiNGAM, Pairwise LiNGAM, LvLiNGAM with 1 latent confounder, SLIM and LiNGAM-GC-UK and comparable to LvLiNGAM with 4 latent confounders and the nonlinear method PNL.
The MATLAB code for performing these experiments is available on our website.14
5. An Experiment on Real-world Data
We analyzed the General Social Survey data set, taken from a sociological data repository (http://www.norc.org/GSS+Website/). The data consisted of six observed variables: x1:
prestige of father’s occupation, x2: son’s income, x3: father’s education, x4: prestige of
son’s occupation, x5: son’s education, and x6: number of siblings.15 The sample selection
was conducted based on the following criteria: i) non-farm background; ii) ages 35–44; iii) white; iv) male; v) in the labor force at the time of the survey; vi) not missing data for any of the covariates; and vii) data taken from 1972–2006. The sample size was 1380.
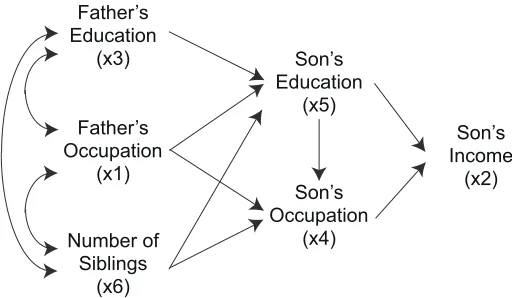
The possible directions were determined based on the domain knowledge in Duncan et al. (1972), shown in Figure 4. Note that there is no direct causal link from x1, x3, and x6 tox2 in the figure, however it is expected that each of these variables has non-zero total
causal effects onx2 given their indirect effects onx2. The causal relations ofx1,x3, andx6
usually are not modeled in the literature since there are many other determinants of these three exogenous observed variables that are not part of the model. However, the possible
14. The URL ishttp://www.ar.sanken.osaka-u.ac.jp/~sshimizu/code/mixedlingamcode.html. 15. Although x6 is discrete, it can be considered as continuous because it is an ordinal scale with many
Sample size
50 100 200
Number of latent confoundersQ= 0:
Our approach (t-distributed individual-specific effects) 88 (3.25) 91 (2.86) 86 (3.47) Our approach (Gaussian individual-specific effects) 91 (2.86) 87 (3.36) 91 (2.86) LvLiNGAM (1 latent confounder) 73 (4.44) 83 (3.76) 83 (3.76) LvLiNGAM (4 latent confounders) 52 (5.00) 68 (4.66) 66 (4.74) SLIM (1 latent confounder) 29 (4.54) 30 (4.58) 25 (4.33) SLIM (4 latent confounders) 34 (4.74) 31 (4.62) 36 (4.80) SLIM (10 latent confounders) 30 (4.58) 29 (4.54) 30 (4.58)
LiNGAM-GC-UK 33 (4.70) 28 (4.49) 35 (4.77)
ICA-LiNGAM 93 (2.55) 93 (2.55) 96 (1.96)
DirectLiNGAM 87 (3.36) 95 (2.18) 97 (1.71)
Pairwise LiNGAM 89 (3.13) 95 (2.18) 95 (2.18) Post-nonlinear causal model 74 (4.39) 71 (4.54) 75 (4.33) Number of latent confoundersQ= 1:
Our approach (t-distributed individual-specific effects) 83 (3.76) 80 (4.00) 80 (4.00) Our approach (Gaussian individual-specific effects) 79 (4.07) 87 (3.36) 69 (4.62) LvLiNGAM (1 latent confounder) 66 (4.74) 71 (4.54) 73 (4.44) LvLiNGAM (4 latent confounders) 63 (4.83) 58 (4.94) 67 (4.70) SLIM (1 latent confounder) 40 (4.90) 47 (4.99) 25 (4.33) SLIM (4 latent confounders) 40 (4.90) 34 (4.74) 44 (4.96) SLIM (10 latent confounders) 47 (4.99) 39 (4.88) 41 (4.92)
LiNGAM-GC-UK 24 (4.27) 32 (4.66) 32 (4.66)
ICA-LiNGAM 74 (4.39) 71 (4.54) 67 (4.70)
DirectLiNGAM 48 (5.00) 52 (5.00) 54 (4.98)
Pairwise LiNGAM 54 (4.98) 58 (4.94) 61 (4.88) Post-nonlinear causal model 55 (4.97) 58 (4.94) 57 (4.95) Number of latent confoundersQ= 6:
Our approach (t-distributed individual-specific effects) 88 (3.25) 81 (3.92) 87 (3.36) Our approach (Gaussian individual-specific effects) 84 (3.67) 85 (3.57) 87 (3.36) LvLiNGAM (1 latent confounder) 58 (4.94) 70 (4.58) 70 (4.58) LvLiNGAM (4 latent confounders) 64 (4.80) 61 (4.88) 63 (4.83) SLIM (1 latent confounder) 50 (5.00) 63 (4.83) 47 (4.99) SLIM (4 latent confounders) 45 (4.97) 47 (4.99) 43 (4.95) SLIM (10 latent confounders) 58 (4.94) 48 (5.00) 58 (4.94)
LiNGAM-GC-UK 29 (4.54) 28 (4.49) 21 (4.07)
ICA-LiNGAM 74 (4.39) 72 (4.49) 47 (4.99)
DirectLiNGAM 37 (4.83) 48 (5.00) 39 (4.88)
Pairwise LiNGAM 48 (5.00) 51 (5.00) 37 (4.83) Post-nonlinear causal model 55 (4.97) 42 (4.94) 46 (4.98) Number of latent confoundersQ= 12:
Our approach (t-distributed individual-specific effects) 88 (3.25) 86 (3.47) 89 (3.13) Our approach (Gaussian individual-specific effects) 91 (2.86) 89 (3.13) 91 (2.86) LvLiNGAM (1 latent confounder) 52 (5.00) 55 (4.97) 65 (4.77) LvLiNGAM (4 latent confounders) 65 (4.77) 58 (4.94) 64 (4.80) SLIM (1 latent confounder) 51 (5.00) 55 (4.97) 60 (4.90) SLIM (4 latent confounders) 45 (4.97) 51 (5.00) 63 (4.83) SLIM (10 latent confounders) 61 (4.88) 54 (4.98) 54 (4.98)
LiNGAM-GC-UK 21 (4.07) 25 (4.33) 29 (4.54)
ICA-LiNGAM 68 (4.66) 72 (4.49) 72 (4.49)
DirectLiNGAM 37 (4.83) 39 (4.88) 38 (4.85)
Pairwise LiNGAM 56 (4.96) 42 (4.94) 43 (4.95) Post-nonlinear causal model 51 (5.00) 43 (4.95) 46 (4.98) Largest numbers of successful discoveries were underlined.
Standard errors are shown in parentheses, which are computed assuming that the number of successes follow a binomial distribution.
Sample size 50 100 200 Number of latent confoundersQ= 0
Our approach (t-distributed individual-specific effects) 27.20 56.93 141.84 Our approach (Gaussian individual-specific effects) 35.48 69.59 117.10 LvLiNGAM (1 latent confounder) 2.41 2.55 9.91 LvLiNGAM (4 latent confounders) 22.25 30.12 87.96 SLIM (1 latent confounder) 5.89 6.25 6.81 SLIM (4 latent confounders) 7.60 8.14 9.13 SLIM (10 latent confounders) 10.88 12.02 13.96
LiNGAM-GC-UK 0.00 0.00 0.00
ICA-LiNGAM 0.04 0.03 0.02
DirectLiNGAM 0.00 0.01 0.01
Pairwise LiNGAM 0.00 0.00 0.00
Post-nonlinear causal model 19.59 27.68 57.37 Number of latent confoundersQ= 1:
Our approach (t-distributed individual-specific effects) 35.87 65.55 131.25 Our approach (Gaussian individual-specific effects) 37.12 75.11 114.37 LvLiNGAM (1 latent confounder) 2.40 2.53 13.93 LvLiNGAM (4 latent confounders) 21.50 29.50 92.19 SLIM (1 latent confounder) 5.88 6.01 6.69 SLIM (4 latent confounders) 7.59 8.19 8.96 SLIM (10 latent confounders) 10.96 11.79 13.68
LiNGAM-GC-UK 0.00 0.00 0.00
ICA-LiNGAM 0.05 0.03 0.03
DirectLiNGAM 0.01 0.01 0.01
Pairwise LiNGAM 0.00 0.00 0.00
Post-nonlinear causal model 18.17 28.83 51.63 Number of latent confoundersQ= 6:
Our approach (t-distributed individual-specific effects) 42.66 76.29 132.43 Our approach (Gaussian individual-specific effects) 33.13 69.07 104.83 LvLiNGAM (1 latent confounder) 2.40 2.56 9.38 LvLiNGAM (4 latent confounders) 22.17 30.12 83.01 SLIM (1 latent confounder) 5.89 6.22 6.77 SLIM (4 latent confounders) 7.58 8.18 9.11 SLIM (10 latent confounders) 11.03 12.02 13.91
LiNGAM-GC-UK 0.00 0.00 0.00
ICA-LiNGAM 0.06 0.05 0.05
DirectLiNGAM 0.01 0.01 0.01
Pairwise LiNGAM 0.00 0.00 0.00
Post-nonlinear causal model 18.71 29.62 52.21 Number of latent confoundersQ= 12:
Our approach (t-distributed individual-specific effects) 29.16 59.30 134.89 Our approach (Gaussian individual-specific effects) 32.18 68.14 104.76 LvLiNGAM (1 latent confounder) 2.35 2.50 13.58 LvLiNGAM (4 latent confounders) 21.51 30.10 94.08 SLIM (1 latent confounder) 5.90 6.03 6.62 SLIM (4 latent confounders) 7.58 7.99 8.97 SLIM (10 latent confounders) 10.92 11.68 13.74
LiNGAM-GC-UK 0.00 0.00 0.00
ICA-LiNGAM 0.07 0.08 0.07
DirectLiNGAM 0.01 0.02 0.02
Pairwise LiNGAM 0.00 0.00 0.00
Post-nonlinear causal model 18.21 29.21 51.89
Father’s Education
(x3)
Father’s Occupation
(x1)
Son’s Education
(x5)
Number of Siblings
(x6)
Son’s Occupation
(x4)
Son’s Income
(x2)
Figure 4: Status attainment model based on domain knowledge. Usually, the relations of
x1,x3, and x6, represented by bi-directed arcs, are not modeled.
causal directions among the three variables would bex1←x3,x6 ←x1, andx6 ←x3 based
on their temporal orders.
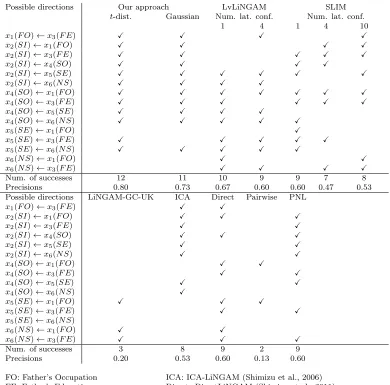
Table 5 shows the numbers of successes and precisions. Our mixed-LiNGAM approach with thet-distributed individual-specific effects gave the largest number of successful discov-eries 12 and achieved the highest precision, i.e., num. successes / num. pairs = 12/15 = 0.80. The second best method was our mixed-LiNGAM approach with the Gaussian individual-specific effects, which found one less correct possible directions than thet-distribution ver-sion. The third best method was LvLiNGAM with 1 latent confounder, which found two less correct possible directions than the t-distribution version. This would be mainly because our two methods allow individual-specific effects and the other methods do not.
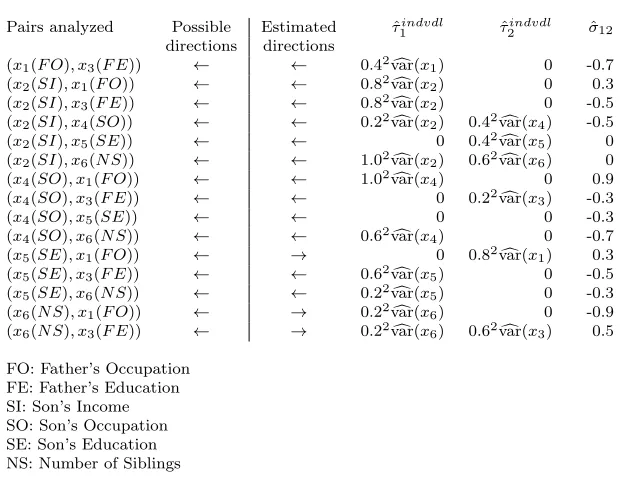
Table 6 shows the estimated hyper-parameter values of our mixed-LiNGAM approach with the t-distributed individual-specific effects that performed best in the sociology data experiment. Either the estimated hyper-parameter ˆτ1indvdl or ˆτ2indvdl that represents the magnitudes of individual differences was non-zero in all pairs except (x4, x5). The
non-ignorable influence of latent confounders was implied between the pairs (x2, x4), (x2, x6)
and (x3, x6) since both ˆτ1indvdl or ˆτ2indvdl were non-zero for the pairs. In addition, for the
pair (x2, x6), there might exist some nonlinear influence of latent confounders, since ˆσ12 is
zero, i.e., the individual-specific effects were linearly uncorrelated but dependent.16 If ˆσ12
were larger, it would have implied a larger linear influence of the latent confounders on the pair (x2, x6). The estimates of the hyper-parameter τ1indvdl were very large for the pairs
(x2, x6) and (x4, x1), which implied very large individual differences regarding x2 and x4
respectively. This might imply that the estimated directions could be less reliable, although they were correct in this example.
Another point is that both our methods with t-distributed and Gaussian individual-specific effects failed to find the possible directionx5←x1, although the causal relation is
expected to occur from the domain knowledge (Duncan et al., 1972). This failure would be attributed to the model misspecification since the sample size was very large. Since the estimate of the hyper-parameter τ1indvdl regarding x5 was zero, the influence of latent
confounders might be small for this pair, although the estimate ofτ2indvdlwas not small and the individual difference regardingx5seemed substantial. Modeling both latent confounders
and nonlinear relations and/or allowing a wider class of non-Gaussian distributions might lead to better performance. This is an important line of future research.
Possible directions Our approach LvLiNGAM SLIM t-dist. Gaussian Num. lat. conf. Num. lat. conf.
1 4 1 4 10
x1(F O)←x3(F E) X X X X
x2(SI)←x1(F O) X X X X
x2(SI)←x3(F E) X X X X X
x2(SI)←x4(SO) X X X X
x2(SI)←x5(SE) X X X X X X
x2(SI)←x6(N S) X X X X
x4(SO)←x1(F O) X X X X X X X
x4(SO)←x3(F E) X X X X X X
x4(SO)←x5(SE) X X X X
x4(SO)←x6(N S) X X X X X
x5(SE)←x1(F O) X
x5(SE)←x3(F E) X X X X X
x5(SE)←x6(N S) X X X X X
x6(N S)←x1(F O) X X
x6(N S)←x3(F E) X X X X
Num. of successes 12 11 10 9 9 7 8
Precisions 0.80 0.73 0.67 0.60 0.60 0.47 0.53
Possible directions LiNGAM-GC-UK ICA Direct Pairwise PNL
x1(F O)←x3(F E) X X
x2(SI)←x1(F O) X X X
x2(SI)←x3(F E) X X
x2(SI)←x4(SO) X X X
x2(SI)←x5(SE) X X
x2(SI)←x6(N S) X X
x4(SO)←x1(F O) X X
x4(SO)←x3(F E) X X
x4(SO)←x5(SE) X X
x4(SO)←x6(N S) X
x5(SE)←x1(F O) X X X
x5(SE)←x3(F E) X X
x5(SE)←x6(N S)
x6(N S)←x1(F O) X X
x6(N S)←x3(F E) X X X
Num. of successes 3 8 9 2 9
Precisions 0.20 0.53 0.60 0.13 0.60
FO: Father’s Occupation ICA: ICA-LiNGAM (Shimizu et al., 2006) FE: Father’s Education Direct: DirectLiNGAM (Shimizu et al., 2011)
SI: Son’s Income Pairwise: Pairwise LiNGAM (Hyv¨arinen and Smith, 2013) SO: Son’s Occupation PNL: Post-nonlinear causal model
SE: Son’s Education (Zhang and Hyv¨arinen, 2009) NS: Number of Siblings
Pairs analyzed Possible Estimated τˆ1indvdl τˆ2indvdl σˆ12 directions directions
(x1(F O), x3(F E)) ← ← 0.42
c
var(x1) 0 -0.7 (x2(SI), x1(F O)) ← ← 0.82
c
var(x2) 0 0.3 (x2(SI), x3(F E)) ← ← 0.82var(c x2) 0 -0.5
(x2(SI), x4(SO)) ← ← 0.22
c
var(x2) 0.42
c
var(x4) -0.5 (x2(SI), x5(SE)) ← ← 0 0.42
c
var(x5) 0 (x2(SI), x6(N S)) ← ← 1.02
c
var(x2) 0.62
c
var(x6) 0 (x4(SO), x1(F O)) ← ← 1.02var(c x4) 0 0.9
(x4(SO), x3(F E)) ← ← 0 0.22var(c x3) -0.3
(x4(SO), x5(SE)) ← ← 0 0 -0.3
(x4(SO), x6(N S)) ← ← 0.62var(c x4) 0 -0.7
(x5(SE), x1(F O)) ← → 0 0.82var(c x1) 0.3
(x5(SE), x3(F E)) ← ← 0.62var(c x5) 0 -0.5
(x5(SE), x6(N S)) ← ← 0.22var(c x5) 0 -0.3
(x6(N S), x1(F O)) ← → 0.22
c
var(x6) 0 -0.9 (x6(N S), x3(F E)) ← → 0.22var(c x6) 0.6
2
c
var(x3) 0.5 FO: Father’s Occupation
FE: Father’s Education SI: Son’s Income SO: Son’s Occupation SE: Son’s Education NS: Number of Siblings τindvdl
1 andτ2indvdlrepresent the variances of the individual-specific effects for the variable pairs in the left-most column.
σ12represents the correlation parameter value of the individual-specific effects for the variable pairs in the left-most column.
6. Conclusions and Future Work
We proposed a new variant of LiNGAM that incorporated individual-specific effects in order to allow latent confounders. We further proposed an empirical Bayesian approach to estimate the possible causal direction of two observed variables based on the new model. In experiments on artificial data and real-world sociology data, the performance of our method was better than or at least comparable to that of existing methods.
For more than two variables, one approach would be to apply our method on every pair of the variables. Then, we can estimate a causal ordering of all the variables by integrating the estimation results. This approach is computationally much simper than trying all the possible causal orderings. Once a causal ordering of the variables is estimated, the remaining problem is to estimate regression coefficients or their posterior distributions. Then, one can see if there are direct causal connections between these variables. Although this could still be computationally challenging for large numbers of variables, the problem reduces to a significantly simpler one by identifying their causal orders. Thus, it is sensible to develop methods that can estimate causal direction of two variables allowing latent confounders.
A reviewer suggested that we can generalize our model to more than two variables. Instead of a two-equation system in Table 1 we could have any number of equations each with an individual-specific confounder variable, although this approach would be computationally challenging.
Future work will focus on extending the model to allow cyclic and nonlinear relations and a wider class of non-Gaussian distributions as well as evaluating our method on various real-world data. Another important direction is to investigate the degree to which the model selection is sensitive to the choice of prior distributions.
Acknowledgments
S.S. was supported by KAKENHI #24700275. We thank Aapo Hyv¨arinen, Ricardo Silva and three reviewers for their helpful comments.
References
F. R. Bach and M. I. Jordan. Kernel independent component analysis. Journal of Machine Learning Research, 3:1–48, 2002.
P. Billingsley. Probability and Measure. Wiley-Interscience, 1986.
K. Bollen. Structural Equations with Latent Variables. John Wiley & Sons, 1989.
Z. Chen and L. Chan. Causality in linear nonGaussian acyclic models in the presence of latent Gaussian confounders. Neural Computation, 25(6):1605–1641, 2013.
D. M. Chickering and J. Pearl. A clinician’s tool for analyzing non-compliance. In Proc. 13th National Conference on Artificial Intelligence (AAAI1996), pages 1269–1276, 1996.
E. Demidenko. Mixed Models: Theory and applications. Wiley-Interscience, 2004.
Y. Dodge and V. Rousson. On asymmetric properties of the correlation coefficient in the regression setting. The American Statistician, 55(1):51–54, 2001.
O. D. Duncan, D. L. Featherman, and B. Duncan. Socioeconomic Background and Achieve-ment. Seminar Press, New York, 1972.
D. Entner and P. O. Hoyer. Discovering unconfounded causal relationships using linear non-gaussian models. In New Frontiers in Artificial Intelligence, Lecture Notes in Computer Science, volume 6797, pages 181–195, 2011.
J. Eriksson and V. Koivunen. Identifiability and separability of linear ICA models revisited. InProc. Fourth International Conference on Independent Component Analysis and Blind Signal Separation (ICA2003), pages 23–27, 2003.
C. W. J. Granger. Investigating causal relations by econometric models and cross-spectral methods. Econometrica, 37(3):424–438, 1969.
R. Henao and O. Winther. Sparse linear identifiable multivariate modeling. Journal of Machine Learning Research, 12:863–905, 2011.
P. O. Hoyer and A. Hyttinen. Bayesian discovery of linear acyclic causal models. In Proc. 25th Conference on Uncertainty in Artificial Intelligence (UAI2009), pages 240–248, 2009.
P. O. Hoyer, A. Hyv¨arinen, R. Scheines, P. Spirtes, J. Ramsey, G. Lacerda, and S. Shimizu. Causal discovery of linear acyclic models with arbitrary distributions. In Proc. 24th Conference on Uncertainty in Artificial Intelligence (UAI2008), pages 282–289, 2008a.
P. O. Hoyer, S. Shimizu, A. Kerminen, and M. Palviainen. Estimation of causal effects using linear non-Gaussian causal models with hidden variables. International Journal of Approximate Reasoning, 49(2):362–378, 2008b.
P. O. Hoyer, D. Janzing, J. Mooij, J. Peters, and B. Sch¨olkopf. Nonlinear causal discovery with additive noise models. In Advances in Neural Information Processing Systems 21, pages 689–696. 2009.
A. Hyv¨arinen and S. M. Smith. Pairwise likelihood ratios for estimation of non-Gaussian structural equation models. Journal of Machine Learning Research, 14:111–152, 2013.
A. Hyv¨arinen, P. O. Hoyer, and M. Inki. Topographic independent component analysis.
Neural Computation, 13(7):1527–1558, 2001a.
A. Hyv¨arinen, J. Karhunen, and E. Oja. Independent Component Analysis. Wiley, New York, 2001b.
R. E. Kass and A. E. Raftery. Bayes factors.Journal of the American Statistical Association, 90(430):773–795, 1995.
S. Kotz and S. Nadarajah. Multivariate t-distributions and Their Applications. Cambridge University Press, 2004.
I. G. G. Kreft and J. De Leeuw. Introducing Multilevel Modeling. Sage, 1998.
G. Lacerda, P. Spirtes, J. Ramsey, and P. O. Hoyer. Discovering cyclic causal models by independent components analysis. InProc. 24th Conference on Uncertainty in Artificial Intelligence (UAI2008), pages 366–374, 2008.
M. Lewicki and T. J. Sejnowski. Learning overcomplete representations. Neural Computa-tion, 12(2):337–365, 2000.
C. Meek. Strong completeness and faithfulness in Bayesian networks. In Proc. 11th Con-ference on Uncertainty in Artificial Intelligence, pages 411–418, 1995.
A. Moneta, N. Chlaß, D. Entner, and P. Hoyer. Causal search in structural vector autore-gressive models. In Journal of Machine Learning Research: Workshop and Conference Proceedings, Causality in Time Series (Proc. NIPS2009 Mini-Symposium on Causality in Time Series), volume 12, pages 95–114, 2011.
A. Moneta, D. Entner, P.O. Hoyer, and A. Coad. Causal inference by independent compo-nent analysis: Theory and applications. Oxford Bulletin of Economics and Statistics, 75 (5):705–730, 2013.
J. Pearl. Causality: Models, Reasoning, and Inference. Cambridge University Press, 2000. (2nd ed. 2009).
J. Peters, D. Janzing, and B. Sch¨olkopf. Causal inference on discrete data using additive noise models. IEEE Transactions on Pattern Analysis and Machine Intelligence, 33(12): 2436–2450, 2011a.
J. Peters, J. Mooij, D. Janzing, and B. Sch¨olkopf. Identifiability of causal graphs using functional models. In Proc. 27th Conference on Uncertainty in Artificial Intelligence (UAI2011), pages 589–598, 2011b.
J. D. Ramsey, R. Sanchez-Romero, and C. Glymour. Non-Gaussian methods and high-pass filters in the estimation of effective connections. NeuroImage, 84(1):986–1006, 2014.
T. Rosenstr¨om, M. Jokela, S. Puttonen, M. Hintsanen, L. Pulkki-R˚aback, J. S. Viikari, O. T. Raitakari, and L. Keltikangas-J¨arvinen. Pairwise measures of causal direction in the epidemiology of sleep problems and depression. PloS ONE, 7(11):e50841, 2012.
S. Shimizu, P. O. Hoyer, A. Hyv¨arinen, and A. Kerminen. A linear non-Gaussian acyclic model for causal discovery. Journal of Machine Learning Research, 7:2003–2030, 2006.
S.M. Smith, K.L. Miller, G. Salimi-Khorshidi, M. Webster, C.F. Beckmann, T.E. Nichols, J.D. Ramsey, and M.W. Woolrich. Network modelling methods for FMRI. NeuroImage, 54(2):875–891, 2011.
Y. Sogawa, S. Shimizu, T. Shimamura, A. Hyv¨arinen, T. Washio, and S. Imoto. Estimating exogenous variables in data with more variables than observations. Neural Networks, 24 (8):875–880, 2011.
P. Spirtes and C. Glymour. An algorithm for fast recovery of sparse causal graphs. Social Science Computer Review, 9:67–72, 1991.
P. Spirtes, C. Glymour, and R. Scheines. Causation, Prediction, and Search. Springer Verlag, 1993. (2nd ed. MIT Press 2000).
P. Spirtes, C. Glymour, R. Scheines, and R. Tillman. Automated search for causal relations: Theory and practice. In R. Dechter, H. Geffner, and J. Halpern, editors, Heuristics, Probability, and Causality: A Tribute to Judea Pearl, pages 467–506. College Publications, 2010.
A. Statnikov, M. Henaff, N. I. Lytkin, and C. F. Aliferis. New methods for separating causes from effects in genomics data. BMC Genomics, 13(Suppl 8):S22, 2012.
R. E. Tillman, A. Gretton, and P. Spirtes. Nonlinear directed acyclic structure learning with weakly additive noise models. InAdvances in Neural Information Processing Systems 22, pages 1847–1855, 2010.
A. von Eye and L. R. Bergman. Research strategies in developmental psychopathology: Di-mensional identity and the person-oriented approach. Development and Psychopathology, 15(3):553–580, 2003.
K. Zhang and A. Hyv¨arinen. On the identifiability of the post-nonlinear causal model. In
Proc. 25th Conference in Uncertainty in Artificial Intelligence (UAI2009), pages 647–655, 2009.