ISSN: 1942-9703 / © 2017 IIJ
Abstract –
Renewable energy production is getting moreattention and is a viable source of energy for on-grid and off-grid systems to sustain the ever increasing energy consumption of modern world. Finding suitable spots for hybridizing wind and solar renewable energy generation is a challenge on itself as the location and time spans for data collection can encompass large and scattered areas. The purpose of this research is to develop a system for cost efficient and practical evaluation of the potential availability of wind/solar energy in selected locations of interest for hybrid power generation. The required system ability includes monitoring the speed (m/s) and direction (degree) of the wind, measuring the temperature (oC) and humidity (%) of air to enable the evaluation of wind potential energy (W.h) over time. The system will also be able to measure and monitor daily solar irradiation (W/m2) to derive its solar potential energy (W.h) over time. The system will be equipped with a GPS and a realtime clock, as all parameters need to be sampled periodically from a specific place, with minimum user intervention. GSM data network is used to upload data from the measurement location into a web server in the internet. The collected data can be viewed via web browsers or via android smart phone for longer term monitoring and evaluation. All location and time synchronized measurement values are crucial in determining the suitability of selected locations for investing in normally capital intensive hybrid wind-solar power generation.
Keywords – Weather Logger, Wind Energy, Solar Energy, Hybrid Power Generation
I. INTRODUCTION
NERGY is a catalyst for national development. Most countries depend on hydrocarbon fuels for power generation, but the traditional sources of energy are exorbitant and finite. In addition, they emit excessive carbon dioxide and other dangerous gases into the lower layers of the atmosphere, which increase occurrence of global warming in the world. Wind and sunlight can both be used for renewable energy in an environmentally more friendly manners [1][2][3][4][5].
Manuscript received 23 October 2016, revised 18 November 2016 and 26 February 2017. This work is supported by the Ministry of Research and Higher Education (RISTEK DIKTI) of Indonesia, under the Grant of PUPT 2016 with the topic of Power Quality Measurement.
All authors are with the Swiss German University, EduTown BSDCity, Tangerang 15339, Indonesia. Arko Djajadi is the head of the Embedded System Research Lab (corresponding e-mail [email protected]).
New technological advancements are still being made by global researchers to push the current limits [6][7][8], including biomechanical energy harvesting for small self-powered systems [9][10].
In this era and future, this form of renewal energy is very important. Nowadays more people are starting to use wind turbine and solar PV panel to generate electricity. Renewable energy is cleaner, becoming more affordable for use and more over virtually abundance on most parts of the globe. Wind and solar complement each other in locations where both are available and sustainable.
Thus, there is a need for prior measurement and monitoring over time to verify their fact in the field. Long term location and time synchronized data would even be more valuable to produce big pictures of the field as well as detailed possible. Large wind energy companies require a complete wind speed data set at a chosen location ranging from 3 to 6 years before embarking in this capital and technology intensive project of renewable energy harvesting, thus eliminating guessing decision. They need to evaluate the variability over time from lowest to highest wind potential. Meanwhile, for solar energy harvesting, as long as there is no shadow on the solar PV panel, shorter observation and data collection of 1-3 years is enough, but the longer is the better to see the effect of changing weather and climate.
The idea of this research is to create and develop a custom weather station for renewable energy location prospecting purpose with flexibility in mind, using IoT approach [11]. Using common weather station system from dedicated companies in the market limits its flexibility and integration, because the data such as wind speed, wind direction, temperature, etc. received from the sensor can only be viewed in the hardware of the weather station and can only be uploaded to the computer using given USB data cable or tools. Flexibility for integration and synchronization with other required data is really unsupported. For example, solar irradiation instruments are developed by some dedicated companies and are not available in common weather stations. Their data must be manually integrated for analysis.
Therefore, in this research there will be some additional features added to the wind and solar integrated weather station being developed to make this product easier to deploy and to use. Data received from the wind and solar sensors will be
Development of a Portable Location-Aware
Wind and Solar Weather Logger for Renewable
Energy Prospecting
Arko Djajadi,
Member, IEEE
, Jimmy K. Setiawan, Cepi M. Hanafi
uploaded to the web server wirelessly. GPS, GSM and real time clock will be integrated on the system to make the custom weather logger wireless, portable, location aware and correlated with the time of the day at the given location.
II. REQUIRED SENSORS AND DATA COMMUNICATION
A.
Parameters and Sensors for Measurement
A.1
Wind Speed
Wind speed is a fundamental atmospheric quantity. It describes how fast the air is moving past a certain point.
Fig. 1. Anemometer JL-FS2
Figure 1 shows the type of anemometer that is used in this research project. This anemometer has an output signal range between 0-5V and represents 0-30 m/s, that will be measured and processed with a microcontroller equipped with analog-digital converter (ADC) input channels. The output of measured wind speed is calculated using
Equation above shows the formula to convert the analog read to the speed of the wind in unit of m/s. For a 10 bit ADC, the value of analog read is 0 until 1023, corresponding to the wind speed of 0 until 30 m/s or around 3cm/s/bit.
To check the wind speed value produced by the selected anemometer, the user needs to compare the result with a reference digital anemometer such as Figure 2 below.
Fig. 2. Anemometer GM816
A.2 Solar Irradiation
Solar irradiation is the power per unit area (W/m2) received from the sun in the form of electromagnetic radiation in the wavelength range of the measuring instrument. It is generally accepted that models for solar radiation prediction are necessary, because in most cases the density and number of solar irradiation measuring stations cannot describe the
necessary variability of the whole spectrum. This measurement is carried out by using pyranometer.
Figure 3 shows the type of pyranometer that is used in this project. The concept of the data measurement is the same with the anemometer where both use analog-digital converter.
Fig. 3. Pyranometer Li-Cor PY 28646
Data from this sensor also needs to be compared with a portable digital pyranometer that is internationally calibrated as a reference to validate the data measurement of this sensor. Figure 4 shows the new portable digital pyranometer used for this purpose.
Fig. 4. Apogee MP-200
A.3 Wind Direction
Wind direction sensor is used to find from which direction the wind blows and how frequent it changes directions. In this project, a wind vane and 8 magnetic hall-effect sensors are used to define incoming wind direction into 8 quadrants N, S, E, W, NE, SE, NW, SW.
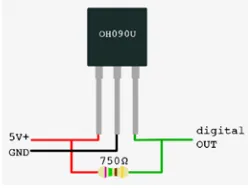
Fig. 5. Hall Effect Sensor OH090U
Figure 5 shows the hall-effect sensor that is used in this research project. This hall-effect has a characteristic of high output when there is no magnetic field. It will switch to low output when a magnetic field gets close enough to the sensor. Each hall-effect sensor will represent one direction. The actual use of the wind direction sensor needs to be aligned with the actual N/S direction.
A.4 Temperature and Humidity
ISSN: 1942-9703 / © 2017 IIJ amount of water vapor in the air. In this project the
temperature and humidity measurement is done by DHT-22, shown in Figure 6. Temperature and humidity affect to some degrees the amount of solar irradiation received by the solar PV panels and also their efficiency.
Fig. 6. DHT-22 Temperature and Humidity Sensor
DHT-22 is a digital temperature and humidity sensor. It uses a capacitive humidity sensor and thermistor to measure the surrounding air, and sends out its measured values as a digital signal on its output pin [3].
A.5 Location and Time
Location, date and time are also important parameters in this project. In case the measurement location changes, it is important to get the exact coordinate location of it automatically, so it is easier to measure and analyze the data based on location and time. Date and time are important parameters, because the system is logging the data to produce collection of the data over a period of time. Reliable data of 3-6 years are needed to get an accurate estimate of the potentially harvestable energy
.
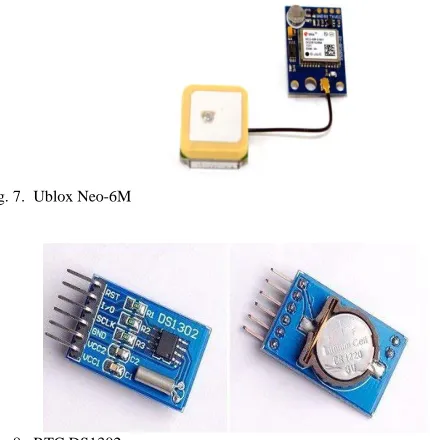
Fig. 7. Ublox Neo-6M
Fig. 8. RTC DS1302
The GPS module utilized to obtain the location coordinate of the system is a well known small module of Ublox Neo-6M in Figure 7. The realtime clock of the system is obtained from RTC module DS 1302 in Figure 8.
B. Website
Monitoring and logging all the measurement data from sensors can be simplified and automated by using a database tiered with a web server and a browser. In order to make a
website data view, Xampp such as in Fig 9 is necessary for configuring and accessing MySQL database and also to interface with the php program for displaying the results on the web browser. Actually there is a free web server for IoT such as Thingspeaks.com but with many limitations, so a custom website is better self developed for the given purpose.
Fig. 9. Xampp Application
C. Android Application
Android application is provided for users to get an easy access to the website that has been created. With Android application users do not have to type the web address anymore, but users just need to click the application and the application will automatically open the website in the application as a web view. To create and deploy Android applications, developers can choose Eclipse, MIT app inventor, and Android Studio.
Alternatively, the web server can be accessed directly by typing its address on the address bar of common browsers. All operating system platforms from Windows, Linux to Android can be used.
III. TESTING AND RESULT
A. Wind Speed Result
The wind speed is measured by using selected Anemometer interfaced to the microcontroller where the data are processed. Sample results of the sensor reading are:
Fig. 10. Wind Speed (ADC, voltage(V), calculated wind speed (m/s))
Figure 10 above shows the relations between the analog input from the Anemometer with the voltage output and wind speed measured the Anemometer. The value is relatively small of only around 1m/s. The wind speed varies significantly with time of the day and with location.
m/s [12], while required wind speed is 3-12 m/s for most wind turbine generators.
B. Solar Irradiation Result
The solar irradiation data is obtained from pyranometer sensor connected to the microcontroller’s analog input pin. Typical testing data will look as in Fig 11.
Fig. 11. Solar irradiation measurement (ADC, voltage(V), calculated irradiation (W/m2))
Typical solar radiation ranges from 0 W/m2 for dark night and can go up to 1100 W/m2 for a bright sunny day. In a cloudy day or under severe shadow this value can drop to less than a half of its ideal value. The actual energy output further depends on the solar PV panel efficiency, area and connected devices. One important parameter is the equivalent number of hour of full solar irradiation per day. This number leads to the annual solar energy availability. In Sumba this number is in the range between 4.7 to 6.5 kWh/m2/day [13].
C. Wind Direction Measurement
As it has been mentioned before, hall-effect sensor is chosen to determine the direction of the wind. In the microcontroller program, any low output produced by the respective magnetic hall-effect sensors is used as indication of the direction of the wind.
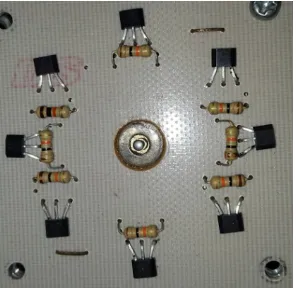
Fig. 12. Hall effect sensor design with circular pattern for wind direction
Figure 12 shows the 8 hall-effect sensors with 8 resistors on a circular pattern with a center pivot to attach the wind vane. Those resistors are used for pulling up the output of the hall effect sensor to keep its high output steady when there is no trigger from magnetic field from a tiny magnet attached on the wind vane beam.
Fig. 13.Wind direction result
Figure 13 above shows the testing result on the serial monitor of the microcontroller. One or two neighboring hall-effect sensors can be triggered by the magnet so the direction of the wind will be printed in the monitor. The wind direction is indicative only and higher resolution is thus not really required for this purpose.
D. Temperature and Humidity Measurement
Temperature and humidity are measured with the DHT-22. Its maximum error for temperature measurement is 0.5ºC. The characteristic of the temperature and humidity is inversely proportional; when the temperature gets higher the humidity will get lower, and when the temperature gets lower the humidity will get higher.
Fig. 14. Temperature vs. humidity for a day
Figure 14 above shows the graph of the temperature (lower graph 25-40 oC) and humidity (upper graph 50-85%) between 9 AM until 5 PM.
E. Location Measurement
The GPS module is used to acquire the coordinate location of the system in the form of longitude and latitude. Positive latitude represents north of equatorial line and negative represents south. Positive longitude represents east and negative indicates west.
ISSN: 1942-9703 / © 2017 IIJ
TABLEI GPSRESULTS
Table 1 above shows the result of the GPS with a maximum latitude error of 0.00029 degree and longitude error of 0.00059 degree. For 1 degree of latitude and longitude it represents around 111 km, so in this case the maximum error of latitude is 32.41 m and for longitude is 65.49 m for civilian use. For prospecting purpose, it is still within the range as the site for possible installation can be of larger area.
F. Website Data View
In the website all parameters such as date, time, wind speed, solar irradiation, wind direction, temperature, humidity and also the coordinate location can be seen in the web page, as shown in Figure 15. With this website user can monitor all parameters any time and save locally for further analysis. Analytical tools can also be built within the website in the near future for ease of data management and processing.
Fig. 15. Website View
G. Android Data View
The Android application is also developed and used to monitor the measurement to help users to view the parameters of interest just like viewing data measurements on the website from the Android smartphone. For Android application, a dedicated program is developed, its apk is built and then downloaded into the smartphone for installation. Users can use the application to monitor all the data measurements just like in the webpage.
H. Overall Final System
The overall final system is shown in Figure 16 with input, process, communication and output parts.
Fig. 16. Block diagram of the integrated system
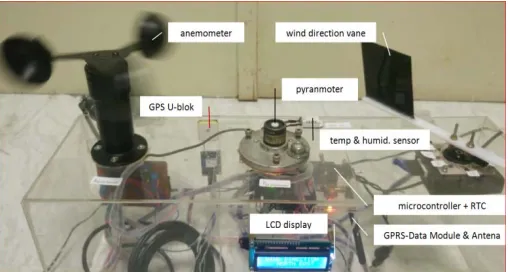
The final system realization is shown Fig. 17, where all required components are already individually tested and then integrated.
Fig. 17. Realization of the integrated system
IV. DISCUSSION
It has been explained from the beginning the reason and objective of this research. It follows with parameters and sensor selection. Each sensor is tested individually and then integrated into the system being developed. System integration and testing are done to see how the whole system behave to produce the required measurement in real time and then stored the data in a dedicated storage address. The gathered data can then be viewed and analyzed as needed. Limited field testing and deployment are carried to find the area of improvement before being exposed in a rigorous environment continuously day and night. The location and time are used for record identification. The current target is to be able to record detailed data and to get the overall picture of daily average wind speed and average solar irradiation.
Daily data varies to some degrees. Wind blows mostly only from 09.00 until 19.00 in the testing location with varying speed that averages out to 3-4 m/s. The actual wind speed varies from 0 m/s until 9 m/s.
out, typical duration of effective sunny days around Tangerang with cloud dominating the days is about 3-5 hours/day.
Based on these preliminary measurements, the rough potential energy available in the selected location for renewable energy generation can be estimated as follows. Take a case where the wind speed is averaged to 3.0m/s for 24 hours, while the sun irradiation is 4 hours/day with full intensity of 1050 W/m2.
For ease of illustration in the calculation and sizing, assume that the area is 1 m2 for wind sweep area and 1 m2 for solar PV panel respectively. The total potential power of the wind is simplified to be 1/2*ρ* v3*A, where ρ [kg/m3] is air density, v [m/s] is the wind speed and A [m2] is the wind turbine sweep area. The product has a unit of [kg/m3]. [m/s]3. [m2] = kg.m2/s3 = kg. [m/s]2.1/s = kg.[m/s2].m/s = N.m/s = J/s = W, which is verified as a unit of power. For given average wind speed of 3.0m/s the power is P= 1/2* 1.2 * 33 * 1 W / m2 = 16.2 W/m2. The average wind potential energy/day is Ewind =
16.2 W/ m2 * 24 h = 388.8 W.h/m2/day. Turbine and generator efficiency are not yet included.
The total potential power of the solar irradiation is simplified to be W/m2. If on certain day the average sunlight duration is equivalent to 4 hours of full bright day with solar irradiation of 1050W/m2, it means that the sun potential energy is Esun = 1050 W/m2* 4 h /day = 4200 W.h/m2/day. Sizing and
efficiency calculation are needed to get the space required to produce the energy demanded, which will be dealt with separately in further work.
V. CONCLUSION
This research is to create a new customized wind solar weather station with wireless data communication and web server for data logging. Common platforms can be used to access and monitor the collected data that will be accumulated over time, ideally for several years worth of data. The parameters of interest for wind-solar hybrid energy prospecting are wind speed, solar irradiation, wind direction, temperature, humidity and also the coordinate location of the system with its corresponding date and time. Data sampling can be as low as 1 sample/sec or 1 sample/5 minutes depending on the data granularity required.
Many selected sensors to perform the required measurement above are successfully interfaced to the microcontroller to perform real-time acquisition, data processing, wireless data communication, logging into a remote web/database servers for monitoring over time. This new prototype, that has been tested locally, will be improved and deployed in several locations for the intended purpose of location prospecting for renewable hybrid energy generations to produce environmentally friendly energy source.
REFERENCES
[1] A. K. Katiyar and C. K. Pandey, “A Review of Solar Radiation Models—Part I,” J. Renewable Energy [Online]. 2013. Available:http://downloads.hindawi.com/journals/jre/2013/168048.pdf [2] N. Gupta, “A Review on the Inclusion of Wind Generation in Power
System Studies,” J. Renewable Sustainable Energy Rev., vol. 59, pp.530– 543, 2016.
[3] K. Li, H. Bian, C. Liu, D. Zhang and Y. Yang, “Comparison of Geothermal with Solar and Wind Power Generation Systems,” J. Renewable Sustainable Energy Rev., vol. 42, pp. 1464– 1474, 2015. [4] J. W. Shupe, “Energy Self-Sufficiency for Hawaii,” Science, vol.
216, pp. 1193– 1199, 1982.
[5] J. G. Morse, “Energy for Remote Areas,” Science , vol. 139, pp. 1175– 1180, 1963.
[6] S. Wang, X. Wang, Z.L. Wang, and Y. Yang, “Efficient Scavenging of Solar and Wind Energies in a Smart City,” ACS Nano, vol. 10 (6), pp 5696–5700, 2016.
[7] L. Zhang, B. Zhang, J. Chen, L. Jin, W. Deng, et al., “Structured Triboelectric Nanogenerators for Scavenging Sweeping Wind Energy on Rooftops,” Adv. Mater, vol. 28, pp. 1650– 1656, 2016.
[8] Z. L. Wang, J. Chen, and L. Lin, “Progress in Triboelectric Nanogenerators as a New Energy Technology and Self-Powered Sensors,” Energy Environ. Sci., vol. 8, pp. 2250– 2282, 2015. [9] W. Yang, J. Chen, G. Zhu, J. Yang, P. Bai, Y. Su, et al,
“Harvesting Energy from the Natural Vibration of Human Walking,”
ACS Nano, vol. 7 (12), pp. 11317–11324, 2013.
[10] B.J. Hansen, Y. Liu, R. Yang, and Z.L. Wang, “Hybrid Nanogenerator for Concurrently Harvesting Biomechanical and Biochemical Energy,”
ACS Nano, vol. 4 (7), pp. 3647–3652, 2010
[11] A. Djajadi and M. Wijanarko, “Ambient Environmental Quality Monitoring Using IoT Sensor Network,” Internetworking Indonesia J., vol. 8(1), pp. 41-47, 2016.
[12] -, “Wind Energy Potential and Development in Indonesia,” WhypGen-BPPT Report, 2013.
[13] -, “Scaling Up Renewable Energy Access in Eastern Indonesia,” ADB TA 8287-INO Final Report, Gov. Indonesia & ADB, 2014.
Arko Djajadi (M’2013) was born in Magelang, Indonesia. He graduated in Electrical Engineering and Electronics from Delft University of Technology - Netherlands in 1992 and completed his PhD degree in the industrial process tomography at UMIST Manchester - United Kingdom in 1999, all with full scholarship. He has extensive work experience in diverse areas in industries, research and higher education. His major research and teaching interest is in Smart Embedded System, Sensor and Instrumentation related to mechatronics, automation and renewable energy with focus on energy or power quality.
Jimmy K. Setiawan earned S.T. degree from Swiss German University and B.Eng degree from Fachhochschule Südwestfalen(Germany) majoring in Mechanical Engineering – Mechatronics Concentration.