Available Online at www.ijpret.com
345
INTERNATIONAL JOURNAL OF PURE AND
APPLIED RESEARCH IN ENGINEERING AND
TECHNOLOGY
A PATH FOR HORIZING YOUR INNOVATIVE WORK
EXPERIMENTAL INVESTIGATION ON USE OF METHYL ESTER KUSUM OIL AND ITS
BLENDS IN DIRECT INJECTION CI ENGINE WITH MATHEMATICAL ANALYSIS
PROF. D. S. DARUNDE 1, N. P. RATHOD 2
1. Asst. Professor, Department of Mechanical Engineering, IBSS College of engineering, Amravati.
2. M. Tech student, Thermal Engineering Govt. College of engineering, Amravati.
Accepted Date: 27/02/2014 ; Published Date: 01/05/2014
\
Abstract:The research on alternative fuels for compression ignition engine has become essential due to depletion of petroleum products, higher oil prices and its major contribution for pollutants, where vegetable oil promises best alternative fuel. Vegetable oils, due to their agricultural origin, are able to reduce net CO2 emissions to the atmosphere. In the present paper, the research efforts directed towards improving the performance of C.I. engine using vegetable oil (Methyl ester Kusum oil) as a fuel. The paper deals with results of performance of a single cylinder, four stroke, C.I. engine using Kusum oil methyl ester and its blends with diesel. The performance of engine was studied at constant speed, with the engine operated at various loading conditions. Performance parameters considered for comparing are brake specific fuel consumption, thermal efficiency, brake power, exhaust gas temperature, smoke density and part load and peak load performance of the engine. The engine offers increase in thermal efficiency when it is powered by Kusum oil and its blends at various loads. The power developed and exhausts gas temperature increases with the increase and specific fuel consumption is higher than diesel fuel.
Keywords: Biodiesel, Blends, Transesterification, Exhaust, Smoke
Corresponding Author: PROF. D. S. DARUNDE
Access Online On:
www.ijpret.com
How to Cite This Article:
Available Online at www.ijpret.com
346
INTRODUCTION
Diesel engine is a popular prime mover for transportation, agricultural machinery and industries. Diesel fuel is largely consumed by the transportation, industry and agricultural sectors. The consumption of diesel oil is several times higher than that of petrol. Import of petroleum products is a major drain on our foreign exchange sources and with growing demand in future years the situation is likely become even worse. Also, diesel and petrol engines are the main sources of carbon dioxide, carbon monoxide and un-burnt hydrocarbon emissions and increase in carbon dioxide, carbon monoxide levels in the atmosphere leads to global warming and green house effect. The world is on the brink of energy crises. Due to the shortage of petroleum products and its increasing cost, efforts are on to develop alternative fuels especially, to the diesel oil for full or partial replacement. It has been found that the vegetable oils are promising fuels because their properties are similar to that of diesel and are produced easily and renewably from the crops. Vegetable oils have comparable energy density, cetane number, heat of vaporization and Stoichiometric air-fuel ratio with that of the diesel fuel [5].
In most of the developed countries, biodiesel is produced from soybean, rapeseed, sunflower, peanut, etc., which are essentially edible in Indian context. Among the various vegetable oil sources, non-edible oils are suitable for biodiesel production. Edible oils are already in demand and too expensive than diesel fuel. Among the non-edible oil sources, Jatropha, karanjan, Mahua, Neems, sal, Kusum, Nahar, Rice bran and Tumba is identified as potential biodiesel source and comparing with other sources, which has added advantages as rapid growth, higher seed productivity, suitable for tropical and subtropical regions of the world.
The experimental results of various researchers support the use of biodiesel as available alternative to the diesel oil for use in the internal combustion engines. It is also important to note that most of the experiments conducted on biodiesel are mainly obtained from refined edible type oils only. The price of refined oils such as sunflower, soybean oil and palm oil are high as compared to that of diesel. This increases the overall production cost of the biodiesel as well. Biodiesel production from refined oils would not be viable as well as economical for the developing countries like India.
Available Online at www.ijpret.com
347 also improves the rural economy. Efforts are made here to produce biodiesel from typical unrefined oil (Kusum seed oil) and to use it as the fuel in diesel engines.
1.1Characterization of Kusum Seeds oil:
In India, Kusum is one of the forest-based tree-borne non-edible oil. The botanical name of Kusum is Schleichera oleosa. S. oleosa is widely found in the sub-Himalayan region, Chattishgarh, throughout central and southern India. The estimated availability of kusum seed is about 25,000 oil potential per tones per annum. In the past kusum seed oil was exported from India to Germany. This market has now fallen away. From current production potential 4000 to 5000 tons are collected. Kusum seed kernels (0.45 lacks of tones of seed) contain 40.3% of yellowish brown colored oil. The one or two almost round seeds some 1.5cm in diameter and weighing between 0.5 and 1.0g. The oil content is 51-62% but the yields are 25-27% in village ghanis and about 36%oil in expellers. It contains only 3.6 to 3.9% of glycerin while normal vegetable oil contains 9-10% glycerin. The viscosity of kusum oil was found to be higher than that of diesel fuel. The high viscosity of kusum oil may be due to its larger molecular weight compared to diesel. The flash point of kusum oil was higher than diesel and hence it is safer to store. It is seen that the kinematic viscosity of kusum oil is 40 cSt at 400 C and after blending decreases gradually closer to that of diesel.
1.2FFA composition in Kusum seeds oil:
C14:0 Myristic acid (0.01%), C16:0 Palmitic acid (7.59%), C16:1 n-7 Palmitoleic acid (1.80%), C18:1 n-9 Cis Oleic acid (2.83%), C18:2 n-6 Trans , Linolelaidic acid (49.69%), C18:2 n-6 Cis Linoleic acid (5.56%), C18:3 n-3 alpha-Linolenic acid (0.26%), C20:1 n-9 Eicosenoic acid (29.54%), C20:2 n-6 Eicosadienoic acid (0.24%), C21:0 Heneicosanoic acid (0.04%), C22:0 Behenic acid (1.14%), C22:1 Erucic acid (1.22%), C24:0 Lignoceric Acid (0.03%), C22:6 Docosahexaenoic acid (0.02%).
2. SEED COLLECTION EXTRACTION OF KUSUM OIL
The kusum oil used for this study was from Kusum seeds that are collected from seeds market Nagpur (Maharashtra) and expelled in a mechanical expeller and oil from seed kernel was extracted in village Ghani from Achalpur Dist. Amravati (Maharashtra).
2.1Kusum oil Methyl Ester (KME) Conversion Process
Available Online at www.ijpret.com
348
• Moisture & insoluble impurities-0.5%
• Saponification value - 220 to 240
• Sp. Gravity @30oC - 0.8653 to 0.8687
• Iodine value - 48 to 60
• FFA% -- basic - 20%
--Max accept - 30%
• Seed yield - 0.45 (lack tone)
• Oil content (%) - 33%
• Oil yield - 0.15 (lack of tone)
2.2Transesterification:
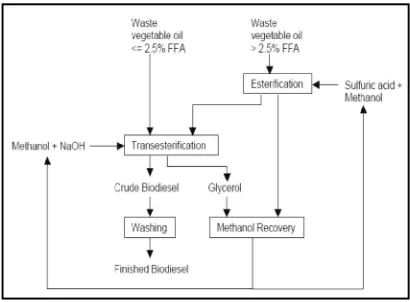
This process has two separate starting points. If vegetable oils can be obtained that are below 2.5% FFA, the esterification step is not necessary.
Fig 1: Block Diagram for Biodiesel Process.
Available Online at www.ijpret.com
349 formation of esters. In presence of excess alcohol, the foreword reaction is pseudo-first order and the reverse reaction is found to be second order.
The first we are taken pretreatment oil temperature is 50-55oC. The products of the first stage pretreatment oil are used as the input of the alkaline transesterification process. A molar ratio of 6:1(Ratio of oil to methanol) and 10grms by weight of potassium hydroxide (KOH) is found to give the maximum ester yield. The reaction time is maintains 2hr at 60oC. After the reaction is completed, the products are allowed to separate into two layers. The lower layer contains impurities and glycerol. This top layer (ester) is separated and purified using distilled water. Hot distilled water (20% by volume) is sprayed over the ester and stirred gently and allowed to settle in the separating funnel. The lower layer is discarded and upper layer (purified biodiesel) is separated.
Transesterification of the oil produces methyl esters (biodiesel) and glycerol. The methyl ester layer is a light yellow liquid that is on top or bottom of the glycerol layer, which is dark brown in color. The mixtures may be kept overnight and allowed to separate by gravity. Otherwise, the methyl ester is separated from the glycerol and washed with water and acetic acid until the washing water is neutral. The methyl ester is then dried by heating.
Table2.2: Properties of Diesel & KME
3. METHODOLOGY
The engine used for the investigation is Single cylinder, Four-stroke, water cooled, Constant speed, direct injection diesel engine. The engine has with a bore of 102mm and a stroke 116mm, the compression ratio of 18.8:1, the rated power of the engine 10/7.4 BHP/kW at the speed of 1500rpm, the swept volume 948 CC and having bush type bearing and with plunger Fuel Viscosity @ 400C
(cSt)
Density @ 40oc (Kg/m3)
Flash point (oC)
Fire point (oC)
Calorific Values (KJ/Kg)
B100% 14.2 850 150 157 41,650
B80% 12.03 840 109 117 41,720
B60% 9.73 830 88 93 41,790
B40% 8.00 820 85 89 41,860
B20% 3.33 809 80 84 41,930
Raw oil 40.36 860 225 231 38,140
Available Online at www.ijpret.com
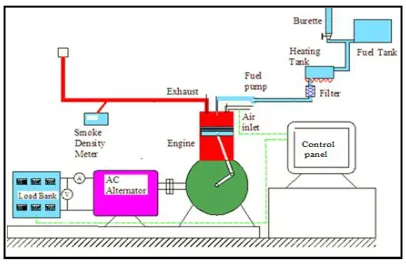
350 type lubrication system. The combustion chamber consisted of a direct injection type with no special arrangement for swirling motion of air. The burette method was used for finding fuel consumption of the engine. The engine was connected to electric dynamometer with A.C. load bank having arrangement of loading in terms of 0.5 kW to 5kW for measuring its brake power. The Opax 2000 II was used for measuring the smoke opacity of exhaust gases coming from the engine, the exhaust pipe is provided with a hole for inserting smoke meter probe. The naturally aspirated engine was provided with water-cooling system in which inlet temperature of water is maintained by adjusting the water flow rate. Engine oil was provided with a pressure feed system. No temperature control was incorporated, for measuring the lubricating oil temperature. Also, the engine is to be equipped with several measuring instruments with the indicators mounted on control panel for their measurement such as K type thermocouples with best sensitivity approximately equal to 41µV/°C installations for measurement of Exhaust gas temperature (EGT), the non contact type tachometer system for measurement of speed. Also the control panel is provided with voltmeter (0-230 V) and ammeter (0-20 Amp) for measurement of voltage and current of dynamometer. The exhaust line of the engine is to be piped outside to the surrounding.
The engine was started at no load by pressing the exhaust valve with decompression lever and it was released suddenly when the engine was hand cranked at sufficient speed and allowed to stabilize at no load condition. After feed control was adjusted so that engine attains rated speed and was allowed to run (about 5 minutes) till the steady state condition was reached. Initially, the short term performance tests were carried out on the engine with diesel in order to generate the base line data and subsequently neat Kusum oil and blends of Kusum oil with diesel was used to evaluate its suitability as a fuel in directed injection CI engine.
4. EXPERIMENTAL SETUP
Available Online at www.ijpret.com
351 Figure 2: Experimental set up
The arrangement is to be made on the engine for the measurement of fuel consumption, and temperatures at different points, the engine will be attached with a generator; maximum load capacity of 5 kW for performance study and at the constant speed. As the engine is water cooled water supply has to be maintaining during experimentation for engine body cooling. The engine is to be equipped with several measuring instruments thermocouples installation with its indicators mounted on the control panel, non contact type tachometer system, smoke meter.
Table 4: Specification of engine used
Name of Engine Comet
General details Single cylinder, Four-stroke, water cooled, DI Diesel engine.
Bore 102mm
Stoke 116mm
Comp. ratio 18.8:1
Rated power-BHP/kW 10/7.4
Rated speed 1500rpm
Swept volume 948
Sp. Fuel cons. gms/kWh 251
Available Online at www.ijpret.com
352
3. RESULTS AND DISCUSSION
3.1 Thermal Efficiency
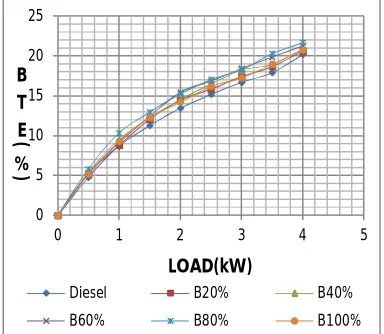
Thermal efficiency is the ratio between the power output and the energy introduced through fuel injection. Fig.3. Shows that the variation of brake thermal efficiency with load for diesel and different blends of the kusum oil methyl ester. In all the cases as load increases the break thermal efficiency increases. It is observed that each blends of the kusum oil yields higher brake thermal efficiency compared to that of diesel and it is maximum for B80% as compared to other blend. This increase in brake thermal efficiency for kusum oil blends compared to diesel may be due to the energy of the kusum oil entering engine is considerably low because of lower heating value, which results in higher brake thermal efficiency. Also the possible reason may be more complete combustion, and additional lubricity of biodiesel. The molecule of the biodiesel has some oxygen that takes part in combustion and results in complete combustion.
Figure 3: Variation of BTE with load
3.2 Exhaust Gas Temperature
Figure 4, Shows the variation of exhaust gas temperature with respect to load for diesel and blends of kusum oil methyl ester. It is observed that the exhaust gas temperature increases as load increases because more fuel burnt at higher loads to meet the power requirement. The exhaust gas temperature for all the blends of the kusum oil is higher compared to that of diesel and it is higher for B40%. This may be attributed to oxygen content of the kusum oil, which improves the combustion and thus may increase the exhaust gas temperature.
0 5 10 15 20 25
0 1 2 3 4 5
B T E
(
%
)
LOAD(kW)
Diesel B20% B40%
Available Online at www.ijpret.com
353 Figure 4: Variation of EGT with load
3.3 Smoke density
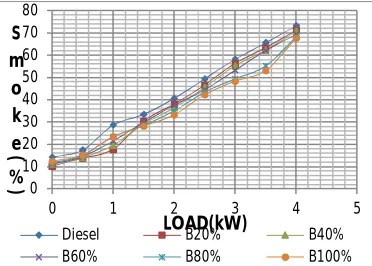
Fig. 4 shows the variation of smoke density with respect to load for kusum oil blends and diesel. It is observed that smoke density for kusum oil blends is generally lower than that of diesel. However, at lower loads B100% kusum oil showed slightly higher smoke density than other blends but lower than diesel. At higher loads all the blends of kusum oil showed better emission performance than that of diesel. The possible reason for lower smoke density of kusum oil blends may be better combustion of fuel due to oxygen atom present in molecules of oil itself.
Figure 5: Variation of Smoke with load 200
250 300 350 400 450 500
0 1 2 3 4 5
EGT
(
OC
)
LOAD(kW)
Diesel B20% B40%
B60% B80% B100%
0 10 20 30 40 50 60 70 80
0 1 2 3 4 5
S m o k e
(
%
)
LOAD(kW)
Diesel B20% B40%
Available Online at www.ijpret.com
354
4 Mathematical Model
4.1Introduction to multiple regression
Multiple regression analysis is a general statistical technique used to analyze the relationship between a single dependent (criterion) variable and several independent (predictor) variables. The objective of multiple regression analysis is to use the several independent variables whose values are known to predict the single independent value the researcher wishes to know. Least square technique is used to determine the coefficients.
Key Terms:
1. R Square/Coefficient of determination (R2): Measures the proportion of the variation of the
dependent variable about its mean that is explained by the independent variables. The coefficient can vary between 0 and 1. If the regression model is properly applied and estimated, higher the value of R Square (r2), greater the explanatory power of the regression equation, and therefore the better the prediction of the criterion variable. In the case of perfect fit r2 = 1.
2. Error or Residual: Seldom will our predictions be perfect. We assume that random error will
occur. The error in predicting our sample is called residual.
3. Intercept (A0): The value on the Y axis (dependent variable axis) where the line defined by the regression equation crosses the axis.
4. Regression coefficient (A1): The numerical value of any parameter estimate that is directly associated with the independent variables.
4.2Steps of Multiple Regression using MS-OFFICE EXCEL 2007
Step 1:Identifying the function of dependent and independent variables
Decide the Dependent and independent variables. Here brake thermal efficiency (E) is a dependent variable and blending ratio (B), fuel temperature (T) and load (L) are the independent variables. It can be expressed as,
E = f(B, T, L)
Available Online at www.ijpret.com
355 Decide the combination of dependent and independent variables of which the relations to be find. Here the combined effect of blending ratio and load as well as combined effect of fuel temperature and load on the brake thermal efficiency is to be found. It can be expressed as,
E = f(B, L)andE = f(T, L)
Step 3:Hypothesize a model
Here a complete second order model is considered. It is expressed as follow (Further discussion is for E1 only),
E = A + A B + A L + A B + A L + A BL
Where,
A0 is constant,
A1 and A2 are the coefficients of linear terms,
A3 and A4 are the coefficients of second order terms,
A5 is a coefficient of interaction term.
Step 4:Develop a design matrix of experimental values
Prepare the Excel sheet of the columns E1, B, L, B2, L2 and BL. Plot scatter diagram for all the experimental observations of E1.
Step 5:Apply least square technique to estimate the model coefficients
For the regression analysis in MS-OFFICE EXCEL 2007, follows the following path,
DataData AnalysisRegression
Input the required data as follow,
Input Y Range- Dependent Variable (E1)
Input X Range- Independent Variables (B, L, B2, L2 and BL)
Apply the required confidence level and Tick to required Graphs. Click Ok.
Available Online at www.ijpret.com
356 Analyze the output result of MS-OFFICE EXCEL, Prepare mathematical equation using given regression coefficients.
Step 7:Checking the validity of model
Plot scatter diagram of E1, predicted E1 and Error bars with 5% errors. Analyze the results. Determine percentage deviation of predicted values from actual experimental values.
4.3Mathematical Analysis
4.3.1 Regression analysis for BTE with all blends
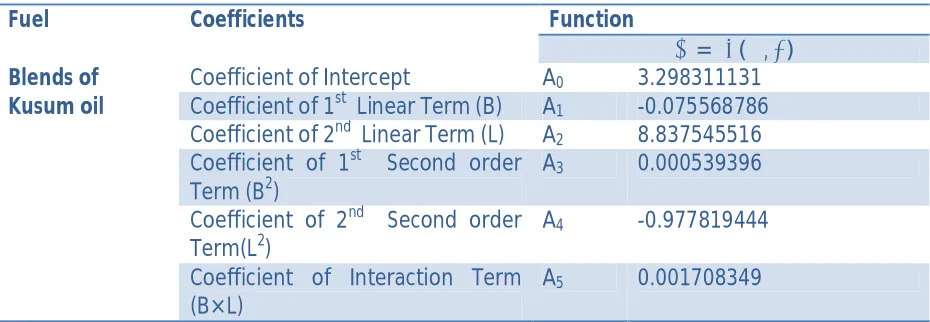
Table shows the regression analysis outputs of Excel 2007 for blends of Kusum oil. Table also shows the coefficients of various correlations of Blending ratio, fuel temperature, load, brake thermal efficiency.
Table 4.3: Coefficients Obtained From Regression Analysis
Fuel Coefficients Function
= ( , ) Blends of
Kusum oil
Coefficient of Intercept A0 3.298311131 Coefficient of 1st Linear Term (B) A1 -0.075568786 Coefficient of 2nd Linear Term (L) A2 8.837545516 Coefficient of 1st Second order
Term (B2)
A3 0.000539396
Coefficient of 2nd Second order Term(L2)
A4 -0.977819444
Coefficient of Interaction Term (B×L)
A5 0.001708349
Using these coefficients from above table, required second order equations of correlation between Brake thermal efficiency with blending ratio, fuel temperature and load can be written as follows.
A.Equations for brake thermal efficiency (diesel)
Effect of blending ratio and load on brake thermal efficiency:
E( , ) = 3.298311131 + (−0.075568786 × B) + (8.837545516 × L)
Available Online at www.ijpret.com
357 Graph shows the combined effects of blending ratio and load on the brake thermal efficiency. It shows that there is an acceptable correlation between experimental and predicted values. This is because of decreasing viscosity values of oil, it increases mean values.
Graph showing the combined effects of blending ratio and load on the brake thermal efficiency indicates the close predicted values of efficiency at lower as well as higher load. Also at lower blends the efficiency value are also higher. Also at the part load the brake thermal efficiency is slightly higher than predicted and for peak load it is lower than the predicted. As the temperature increases the value of brake thermal efficiency get increases because of complete combustion or increasing volatility and decreasing viscosity of oil.
Following graphs shows the experimental and predicted observations for above equation.
1) Diesel
Graph 4.3.1: Regression analysis for diesel fuel
2) B20%
0 5 10 15 20 25
0 2 4 6
Predicted Experimental
B
TE
%
0 5 10 15 20 25
0 2 4 6
B
TE
%
Available Online at www.ijpret.com
358
Graph 4.3.2: Regression analysis for blend B20%
3) B40%
Graph 4.3.3: Regression analysis for blend B40%
4) B60%
Graph 4.3.4: Regression analysis for blend B60%
5) B80%
0 5 10 15 20 25
0 2 4 6
B
TE
%
Predicted Experimental
0 5 10 15 20 25
0 2 4 6
B
T
E
%
Available Online at www.ijpret.com
359
Graph 4.3.5: Regression analysis for blend B80%
6) B100%
Graph 4.3.6: Regression analysis for blend B100%
4.4Comparison of Mathematical and Experimental Results
The brake thermal efficiency of all the blends at different load was determined experimentally and mathematically. Comparison of mathematical and experimental results of blended oil is as follows.
From the graphs for brake thermal efficiency Vs load observed that brake thermal efficiency values are close to that of experimental at lower values. Also from the graphs for different load
0 5 10 15 20 25
0 2 4 6
B
T
E
%
Predicted Experimental
0 5 10 15 20 25
0 2 4 6
B
TE
%
Available Online at www.ijpret.com
360 the brake thermal efficiency increases as with the load. The predicted value are nearer to that of experimental showing good results of analysis it is use for finding the values of efficiency at different points.
4.5Justification for Difference
The mathematical results and experimental results show that there is an acceptable correlation between experimental and predicted values. This is because of decreasing viscosity values of oil, it increases mean values. Also the possible reason may be more complete combustion, and additional lubricity of Kusum oil biodiesel. There is little variation between mathematical and experimental values may be due to the experimental error.
5. CONCLUSIONS
In this work a single cylinder four stroke compression engine when it is powered by neat and blends of biodiesel (methyl ester kusum oil)-diesel fuel at various loads and its performance and emission characteristics are analyzed. The concentration of biodiesel blends found to improve the thermal efficiency. KME B20%, B40%, 620%, B80% and B100% biodiesel blends gives good improvement in brake thermal efficiency of diesel engine at different load conditions. Also, reduced emission and brake specific fuel consumption is found out while using blending. Higher the concentration of biodiesel blend, higher is the reduction of smoke density in exhaust gas. The exhaust gas temperature increased as a function of concentration of biodiesel in the blend.
The present experimental results supports that methyl esters of kusum seed oil as biodiesel can be successfully used in existing diesel engines without any modifications. Use of the biodiesel as partial diesel substitute can boost the farm economy, reduce uncertainty of fuel availability in rural and remote areas where grid power is not available, vegetable oil can play a vital role in decentralized power generation for irrigation and electrification and make farmers more self-reliant. Also, this help in controlling air pollution to a great extent.
NOMENCLATURES
BSFC Brake specific fuelconsumption CI Compression Ignition
Available Online at www.ijpret.com
361
REFERENCES
1. Ayhan Demirba, Department of Chemical Education, Karadeniz Technical University “Biodiesel fuels from vegetable oils via catalytic and non-catalytic supercritical alcohol transesterifications and other methods: a survey”, PK 216, Trabzon 61035, Turkey.
2. Mallela Gandhi, N. Ramu and S. Bakkiya Raj “methyl ester production from schlichera oleosa” Mallela et al., IJPSR, 2011; Vol. 2(5): 1244-1250
3. Biodiesel production: a review1 Fangrui Maa, Milford A. Hannab,* a Department of Food Science and Technology, University of Nebraska, Lincoln, NE, USA b Industrial Agricultural Products Center, University of Nebraska, 211 L.W. Chase Hall, Lincoln, NE 68583-0730, USA
4. Lohith.N, Dr. R.Suresh, Yathish.K.V “Experimental Investigation of Compressed Ignition Engine Using Karanja Oil Methyl Ester (KOME) as Alternative Fuel”. / International Journal of Engineering Research and Applications (IJERA) ISSN: 2248-9622Vol. 2, Issue4, July-August 2012, pp.1172-1180.
5. S. Kalligeros, F. Zannikos, S. Stournas, E. Lois, G.Anastopoulos, Ch. Teas and F. Sakellaropoulos “An investigation of using biodiesel/marine diesel blends on the performance of a stationary diesel engine”.
6. Deepak Agarwal, Avinash Kumar Agarwal, “Performance and emissions characteristics of Jatropha oil (preheated and blends) in a direct injection compression ignition engine”. Applied Thermal Engineering 27 (2007) 2314–2323.
7. M.C.Navindgi, Maheswar Dutta and B. Sudheer Prem “Performance evaluation, emission characteristic and economic analysis of four non-edible straight vegetable oils on a single cylinder CI engine”. Kumar ARPN Journal of Engineering and Applied Sciences Voi.7,No.2, Feb2012
8. Magín Lapuerta, Octavio Armas and José Rodríguez-Fernández Escuela Técnica “Effect of biodiesel fuels on diesel engine emissions” Superior de Ingenieros Industriales, University of Castilla-La Mancha, Avda. Camilo José Cela, s/n. 13071 Ciudad Real, Spain
Available Online at www.ijpret.com
362 10.Anh N. Phan and Tan M. Phan “Biodiesel production from waste cooking oils” School of Chemical Engineering and Advanced Materials, Newcastle University, NE1 7RU, UK
11.S.K.Acharya, M.K.Mohanty R.K.Swain “Kusum Oil as a Fuel for Small Horse Power Diesel Engine” International Journal of Engineering and Technology Vol. 1, No.3, August, 2009 ISSN: 1793-8236
12.Avinash Kumar Agarwal and K. Rajamanoharan, 2009, “Experimental investigations of performance and emissions of Karanja oil and its blends in a single cylinder diesel engine”. Applied Energy 86, 106–112.
13.Sagar Pramodrao Kadu and Rajendra H. Sarda 2010, “Experimental Investigations on the Use of Preheated Neat Karanja Oil as Fuel in a Compression Ignition Engine”. International Journal of Mechanical and Materials Engineering, 145–149.