METHODOLOGY
Utilizing trait networks and structural
equation models as tools to interpret multi-trait
genome-wide association studies
Mehdi Momen
1, Malachy T. Campbell
1, Harkamal Walia
2and Gota Morota
1*Abstract
Background: Plant breeders seek to develop cultivars with maximal agronomic value, which is often assessed using numerous, often genetically correlated traits. As intervention on one trait will affect the value of another, breed-ing decisions should consider the relationships among traits in the context of putative causal structures (i.e., trait networks). While multi-trait genome-wide association studies (MTM-GWAS) can infer putative genetic signals at the multivariate scale, standard MTM-GWAS does not accommodate the network structure of phenotypes, and therefore does not address how the traits are interrelated. We extended the scope of MTM-GWAS by incorporating trait network structures into GWAS using structural equation models (SEM-GWAS). Here, we illustrate the utility of SEM-GWAS using a digital metric for shoot biomass, root biomass, water use, and water use efficiency in rice.
Results: A salient feature of SEM-GWAS is that it can partition the total single nucleotide polymorphism (SNP) effects acting on a trait into direct and indirect effects. Using this novel approach, we show that for most QTL associated with water use, total SNP effects were driven by genetic effects acting directly on water use rather that genetic effects originating from upstream traits. Conversely, total SNP effects for water use efficiency were largely due to indirect effects originating from the upstream trait, projected shoot area.
Conclusions: We describe a robust framework that can be applied to multivariate phenotypes to understand the interrelationships between complex traits. This framework provides novel insights into how QTL act within a phe-notypic network that would otherwise not be possible with conventional multi-trait GWAS approaches. Collectively, these results suggest that the use of SEM may enhance our understanding of complex relationships among agro-nomic traits.
Keywords: Structural equation modeling, Bayesian network, Genome-wide association, Multi-trait
© The Author(s) 2019. This article is distributed under the terms of the Creative Commons Attribution 4.0 International License (http://creat iveco mmons .org/licen ses/by/4.0/), which permits unrestricted use, distribution, and reproduction in any medium, provided you give appropriate credit to the original author(s) and the source, provide a link to the Creative Commons license, and indicate if changes were made. The Creative Commons Public Domain Dedication waiver (http://creativecommons.org/ publicdomain/zero/1.0/) applies to the data made available in this article, unless otherwise stated.
Introduction
Elite cultivars are the result of generations of targeted selection for multiple characteristics. In many cases, plant and animal breeders alike seek to improve many, often correlated, phenotypes simultaneously. Thus, breeders must consider the interaction between traits during selection. For instance, genetic selection for one trait may increase or decrease the expression of another
trait, depending on the genetic correlation between the two. While consideration of the genetic correlation between traits is essential in this respect, modeling recur-sive interactions between phenotypes provides important insights for developing breeding and management strate-gies for crops that cannot be realized with conventional multivariate approaches alone. In particular, inferring the structure of trait networks from observational data is critical for our understanding of the interdependence of multiple phenotypes [1–3].
Genome-wide association studies (GWAS) have become increasingly popular approaches for the elucida-tion of the genetic basis of economically important traits.
Open Access
*Correspondence: [email protected]
1 Department of Animal and Poultry Sciences, Virginia Polytechnic Institute and State University, 175 West Campus Drive, Blacksburg, VA 24061, USA
They have been successful in identifying single nucleotide polymorphisms (SNPs) associated with a wide spectrum of phenotypes, including yield, abiotic and biotic stresses, and plant morphological traits [4]. For many studies, multiple, often correlated, traits are recorded on the same material, and association mapping is performed for each trait independently. While such approaches may yield powerful, biologically meaningful results, they fail to adequately capture the genetic interdependancy among traits and impose limitations on elucidating the genetic mechanisms underlying a complex system of traits. When multiple phenotypes possess correlated structures, multi-trait GWAS (MTM-GWAS), which is the applica-tion of mutli-trait models (MTM) [5] to GWAS, is the standard approach. The rationale behind this is to lever-age genetic correlations among phenotypes to increase statistical power for the detection of quantitative trait loci, particularly for traits that have low heritability or are scarcely recorded.
While MTM-GWAS is a powerful approach to capture the genetic correlations between traits for genetic infer-ence, it fails to address how the traits are interrelated, or elucidate the mechanisms that give rise to the observed correlation. The early work of Sewall Wright sought to infer causative relations between correlated variables through path analysis [6]. This seminal work gave rise to structural equation models (SEM), which assesses the nature and magnitude of direct and indirect effects of multiple interacting variables. Although SEM remains a powerful approach to model the relationships among variables in complex systems, its use has been limited in biology.
Recently, Momen et al. [7] proposed the SEM-GWAS framework by incorporating trait networks and SNPs
into MTM-GWAS through SEM [6, 8]. In contrast to
standard multivariate statistical techniques, the SEM framework opens up a multivariate modeling strategy that accounts for recursive (an effect from one pheno-type is passed onto another phenopheno-type) and simultane-ous (reciprocal) structures among its variables [9, 10]. Momen et al. [7] showed that SEM-GWAS can supple-ment MTM-GWAS, and is capable of partitioning the source of the SNP effects into direct and indirect effects, which helps to provide a better understanding of the rel-evant biological mechanisms. In contrast, MTM-GWAS, which does not take the network structure between phe-notypes into account, estimates overall SNP effects that are mediated by other phenotypes, and combines direct and indirect SNP effects.
Current climate projections predict an increase in the incidence of drought events and elevated temperatures throughout the growing season [11]. These elevated
temperatures will drive higher evapotranspirational demands, and combined with the increased unpredict-ability of precipitation events, will increase the frequency and intensity of drought, thus impacting crop productiv-ity [12–16]. To mitigate the effects of climate change on agricultural productivity, the development of drought-tolerant cultivars is important for increasing climate resilience in agriculture. However, progress towards this goal is often hindered by the inherent complexity of traits such as drought tolerance [17–20]. The ability to miti-gate yield losses under limited water conditions involves a suite of morphological and physiological traits [20]. Among these is the ability to access available water and utilize it for growth. Thus, studying traits associated with water capture (e.g., root biomass and architecture) and utilization (e.g., water-use efficiency) is essential. How-ever, of equal importance is a robust statistical frame-work that allows these complex traits to be analyzed jointly and network relationships among traits to be inferred for efficient incorporation of these traits into breeding programs.
In this study, we applied SEM-GWAS and MTM-GWAS to incorporate the trait network structures related to shoot and root biomass and to drought responses in rice (Oryza sativa L.) from a graphical modeling per-spective. Graphical modeling offers statistical inferences regarding complex associations among multivariate phe-notypes. Plant biomass and drought stress responses are interconnected through physiological pathways that may be related to each other, requiring the specification of recursive effects using SEM. We combined GWAS with two graphical modeling approaches: a Bayesian network was used to infer how each SNP affects a focal phenotype directly or indirectly through other phenotypes, and SEM was applied to represent the interrelationships among SNPs and multiple phenotypes in the form of equations and path diagrams.
Materials and methods Experimental data set
The plant material used in our analysis consisted of a rice diversity panel of n=341 inbred accessions of O.
Beagle software version 3.3.2 [24]. Finally, 411,066 SNPs were retained for further analysis.
Phenotypic data
We analyzed four biologically important traits for drought responses in rice: projected shoot area (PSA), root biomass (RB), water use (WU), and water use effi-ciency (WUE). These phenotypes are derived from two previous work [25, 26]. The aim of the first study was to evaluate the effects of drought on shoot growth [26]. Here, the diversity panel was phenotyped using an auto-mated phenotyping platform in Adelaide, SA, Australia. This new phenotyping technology enabled us to produce high-resolution spatial and temporal image-derived phe-notypes, which can be used to capture dynamic growth, development, and stress responses [27–30]. The image analysis pipeline is identical to that described in Camp-bell et al. [31] and several studies have shown that the metric of digitally driven PSA is an accurate representa-tion of shoot biomass [28, 29, 32].
The plants were phenotyped over a period of 20 days, starting at 13 days after they were transplanted into soil and ending at 33 days. Each day, the plants were watered to a specific target weight to ensure the soil was com-pletely saturated. The plants were then imaged from three angles (two side views and a top view image). These images were processed to remove all background objects, leaving just pixels for the green shoot tissue. We summed the pixels from each image to obtain an estimate of the shoot biomass. We refer to this metric as PSA. With this system, we also obtained the weights, prior to watering and after watering, for each pot on each day. From this data, we estimated the amount of water that is used by each plant. WU was calculated as Pot Weight(r−1)−Pot Weight(r) , where r is time, and WUE is the ratio of PSA to WU. Although this data has not yet been published, a description of the phenotyping system and insight into the experimental design can be found in Campbell et al. [29].
The aim of the second study was to assess salinity tol-erance in the rice diversity panel. The plants were grown in a hydroponic system in a greenhouse. Salt stress was imposed for 2 weeks, and destructive phenotyping per-formed at 28 days after transplantation. A number of traits were recorded, including RB. The experimental design of this study is fully described in Campbell et al. [25]. All the aforementioned phenotypes were meas-ured under control conditions. The 15th day of imag-ing was selected for analysis of PSA, WU, and WUE, which is equivalent to 28 days after transplantation, so it matched the age at which RB was recorded. For both studies, best linear unbiased estimates were computed
for each accession prior to downstream analyses. For RB, the details of the model are discussed in Camp-bell et al. [25]. Briefly, a linear model was fitted using the PROC-GLM procedure in SAS that accounted for time of the year, replication, and block effects. For traits derived from high-throughput phenotyping, the linear model included a fixed term for the effect of the experi-ment and a fixed term for replication nested within experiment.
Multi‑trait genomic best linear unbiased prediction
A Bayesian multi-trait genomic best linear unbiased pre-diction (MT-GBLUP) model was used for four traits to obtain posterior means of genetic values as inputs for inferring a trait network.
where y is the vector observations for t=4 traits, X is the incidence matrix of covariates, b is the vector of covariate effects, Z is the incidence matrix relating
acces-sions with additive genetic effects, g is the vector of
addi-tive genetic effects, and ǫ is the vector of residuals. The incident matrix X only included intercepts for the four traits examined in this study. Under the infinitesimal model of inheritance, the g and ǫ were assumed to follow a multivariate Gaussian distribution g∼N(0,
g⊗G)
and ǫ∼N(0,
ǫ⊗I) , respectively, where G is the n×n genomic relationship matrix for genetic effects, I is the
identity matrix for residuals,
g and
ǫ are the t×t
var-iance-covariance matrices of genetic effects and residu-als, respectively, and ⊗ denotes the Kronecker product.
The G matrix was computed as WW′/2m
j=1pj(1−pj) , where W is the centered marker incidence matrix taking values of 0−2pj for zero copies of the reference allele, 1−2pj for one copy of the reference allele, and 2−2pj
for two copies of the reference allele [33]. Here, pj is the
allele frequency at SNP j=1,. . .,m . We assigned flat priors for the intercept and the vector of fixed effects. The vectors of random additive genetic effects and residual effects were assigned independent multivariate normal priors with null mean and inverse Wishart distributions for the covariance matrices.
A Markov chain Monte Carlo (MCMC) approach based on Gibbs sampler was used to explore posterior distributions. We used a burn-in of 25,000 MCMC sam-ples followed by an additional 150,000 MCMC samsam-ples. The MCMC samples were thinned by a factor of two, resulting in 75,000 MCMC samples for inference. Pos-terior means were then calculated for estimating model parameters. The MTM R package was used to fit the above regression model (https ://githu b.com/Quant Gen/ MTM).
Learning structures using Bayesian network
Networks or graphs can be used to model interactions. Bayesian networks describe conditional independence relationships among multivariate phenotypes. Each phenotype is connected by an edge to another pheno-type if they directly affect each other given the rest of the phenotypes, whereas the absence of edge implies conditional independence given the rest of phenotypes. Several algorithms have been proposed to infer plausible structures in Bayesian networks, assuming independ-ence among the realization of random variables [34]. The estimated genetic values from MT-GBLUP were used as inputs, and we applied the Hill Climbing (HC) algo-rithm from the score-based structure learning category to infer the network structure among the four traits examined in this study [35]. We selected this algorithm because it was suggested in a recent study, [36], which showed that the score-based algorithms performed bet-ter for the construction of networks than constraint-based counterparts. The bnlearn R package was used to learn the Bayesian trait network throughout this analysis with mutual information as the test, and the statistically significant level set at α=0.01 [34]. We computed the
Bayesian information criterion (BIC) score of a network and estimated the strength and uncertainty of direction of each edge probabilistically by bootstrapping [37]. In addition, the strength of the edge was assessed by com-puting the change in the BIC score when that particular edge was removed from the network, while keeping the rest of the network intact.
Multi‑trait GWAS
We used the following MTM-GWAS that does not account for the inferred network structure by extending the single-trait GWAS counterpart of Kennedy et al. [38] and Yu et al. [39]. For ease of presentation, it is assumed that each phe-notype has null mean.
where w is the jth SNP being tested, s represents the
vec-tor of fixed jth SNP effect, and g is the vector of additive
polygenic effect. The aforementioned variance-covar-iance structures were assumed for g and ǫ . The MTM-GWAS was fitted individually for each SNP, where the output is a vector of marker effect estimates for each trait, i.e. sˆ=
ˆ
sPSA,ˆsRB,ˆsWU,ˆsWUE.
Structural equation model for GWAS
A structural equation model is capable of conveying directed network relationships among multivariate phe-notypes involving recursive effects. The SEM described in Gianola and Sorensen [40] in the context of linear mixed models was extended for GWAS, according to [7].
y=ws+Zg+ǫ,
where I is the identity matrix, is the lower triangular
matrix of regression coefficients or structural coefficients based on the learned network structure from the Bayes-ian network, and the other terms are as defined earlier.
Note that the structural coefficients determine that
the phenotypes which appear in the left-hand side also appear in the right-hand side, and represent the edge effect size from phenotype to phenotype in Bayesian net-works. If all elements of are equal to 0, then this model is equivalent to MTM-GWAS. Gianola and Sorensen [40] showed that the reduction and re-parameterization of a SEM mixed model can yield the same joint probability distribution of observation as MTM, suggesting that the expected likelihoods of MTM and SEM are the same [41]. For example, we can rewrite the SEM-GWAS model as
where Var(g∗ ) ∼(I−)−1G(I−)′−1 and Var(ǫ∗ ) ∼(I−)−1R(I−)′−1 . This transformation changes
SEM-GWAS into MTM-GWAS, which ignores the network relationships among traits [40, 41]. However, Valente et al. [42] stated that SEM allows for the predic-tion of the effects of external intervenpredic-tions, which can be useful for making selection decisions that are not pos-sible with MTM. We used SNP Snappy software to per-form MTM-GWAS and SEM-GWAS [43]. To identify candidate SNPs that may explain direct (in the absence of mediation by other traits) and indirect (with inter-vention and mediation by other traits) effects for each trait, the SNPs from MTM-GWAS were ranked accord-ing to p-values for each trait. The top 50 SNPs were then selected, and marker effects were decomposed into direct and indirect effects using SEM-GWAS. Since WU and WUE were the only two traits to have indirect effects, we focused on these traits for downstream analysis with SEM-GWAS.
y=�y+ws+Zg+ǫ
y1 y2 y3 y4 =
0 0 0 0
I1PSA→RB 0 0 0
I1PSA→WU I2RB→WU 0 0
I1PSA→WUE I2RB→WUE I3WU→WUE 0
y1 y2 y3 y4 +
wj1 0 0 0
0 wj2 0 0
0 0 wj3 0
0 0 0 wj4
sj1 sj2 sj3 sj4
+
Z1 0 0 0
0 Z2 0 0
0 0 Z3 0
0 0 0 Z4
g1 g2 g3 g4 + ǫ1 ǫ2 ǫ3 ǫ4
Results
Trait correlations and network structure
Multi-phenotypes were split into genetic values and residuals by fitting the MT-GBLUP. The estimates of genomic and residual correlations among the four traits measured in this study are shown in Table 1. Correlations between all traits ranged from 0.48 to 0.92 for genomics and − 0.13 to 0.83 for residuals. The estimated genomic correlations can arise from pleiotropy or linkage disequi-librium (LD). Although pleiotropy is the most durable and stable source of genetic correlations, LD is consid-ered to be less important than pleiotropy because alleles at two linked loci may become non-randomly associated by chance and be distorted through recombination [44, 45].
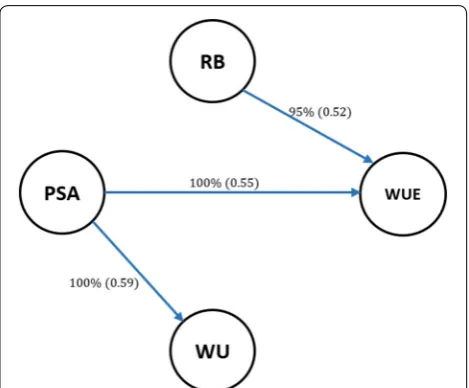
We postulated that the learned networks can provide a deeper insight into relationships among traits than sim-ple correlations or covariances. Figure 1 shows a network structure inferred using the HC algorithm. This is a fully recursive structure because there is at least one incoming or outgoing edge for each node. Unlike the MTM-GWAS model, the inferred graph structure explains how the phe-notypes may be related to each other either directly or indirectly mediated by one or more variables. We found a direct dependency between PSA and WUE. A direct con-nection was also found between RB and WUE, and PSA and WU.
Measuring the strength of probabilistic dependence for each arc is crucial in Bayesian network learning [37]. As shown in Fig. 1, the strength of each arc was assessed with 2500 bootstrap samples with a significance level at
α= 0.01. The labels on the edges indicate the proportion
of bootstrap samples supporting the presence of the edge and the proportion supporting the direction of the edges are provided in parentheses. Learned structures were aver-aged with a strength threshold of 85% or higher to produce a more robust network structure. Edges that did not meet this threshold were removed from the networks. In addi-tion, we used BIC as goodness-of-fit statistics measuring how well the paths mirror the dependence structure of the
data (Table 2). The BIC assign higher scores to any path that fit the data better. The BIC score reports the impor-tance of each arc by its removal from the learned structure. We found that removing PSA → WUE resulted in the larg-est decrease in the BIC score, suggesting that this path is playing the most important role in the network structure. This was followed by PSA → WU and RB → WUE.
Structural equation coefficients
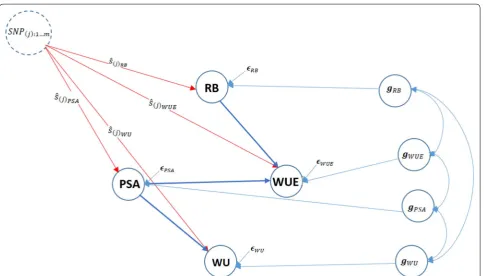
The inferred Bayesian network among PSA, RB, WU, and WUE in Fig. 1 was modeled using a set of structural equa-tions to estimate SEM parameters and SNP effects, as shown in Fig. 2, which can be statistically expressed as
Table 1 Genomic (upper triangular), residual (lower triangular) correlations and genomic heritabilities (diagonals) of four traits in the rice with posterior standard deviations in parentheses
PSA: projected shoot area; RB: root biomass; WU: water use; WUE: water use efficiency
PSA RB WU WUE
PSA 0.677 (0.092) 0.515 (0.102) 0.846 (0.043) 0.920 (0.018) RB 0.030 (0.218) 0.733 (0.083) 0.479 (0.114) 0.517 (0.107) WU 0.443 (0.152) − 0.134 (0.216) 0.643(0.097) 0.744 (0.076) WUE 0.829 (0.052) 0.111 (0.195) 0.106 (0.182) 0.576 (0.092)
Fig. 1 Scheme of inferred network structure using the Hill-Climbing (HC) algorithm, with 0.85, threshold; the minimum strength required for an arc to be included in the network. Structure learning test was performed with 2500 bootstrap samples with mutual information as the test statistic with a significance level at α = 0.01. Labels of
the edges refer to the strength and direction (parenthesis) which measure the confidence of the directed edge. The strength indicates the frequency of the edge is present and the direction measures the frequency of the direction conditioned on the presence of edge. PSA: Projected shoot area; RB: root biomass; WU: water use; WUE: water use efficiency
Table 2 Bayesian information criterion (BIC) for the network learned using the Hill-Climbing (HC) algorithm
BIC denote BIC scores for pairs of nodes and reports the change in the score caused by an arc removal relative to the entire network score
PSA: projected shoot area; RB: root biomass; WU: water use; WUE: water use efficiency
Algorithm From To BIC
HC PSA WU − 427.956
PSA WUE − 488.787
The corresponding estimated matrix is
Table 3 presents the magnitude of estimated structural path coefficients: 13 , 14 , and 24 for PSA on WU, PSA
on WUE, and RB on WUE, respectively. The structural coefficients ( ii′ ) describe the rate of change of trait i
with respect to trait i′ . The largest magnitude of the structural coefficient was 0.963, which was estimated for
y1PSA=wjsj(y1
PSA)+Z1g1+ ǫ1
y2RB=wjsj(y2RB)+Z2g2+ǫ2
y3WU =13y1PSA+wjsj(y3WU)+Z3g3+ǫ3
=13[wjsj(y1
PSA)+Z1g1+
ǫ1] +wjsj(y 3WU)
+Z3g3+ǫ3
y4WUE =14y1PSA+24y2RB+wjsj(y4WUE)+Z4g4+ǫ4
=14[wjsj(y1PSA)+Z1g1+ǫ1] +24[wjsj(y2RB)
+Z2g2+ǫ2] +wjsj(y4WUE)+Z4g4+ǫ4.
=
0 0 0 0
0 0 0 0
13
PSA→WU 0 0 0
14
PSA→WUE 24RB→WUE 0 0
.
PSA → WUE, whereas the lowest was 0.045, which was estimated for RB → WUE.
Interpretation of SNP effects
We implemented SEM-GWAS as an extension of the MTM-GWAS method for analysis of the joint genetic architecture of the four measured traits, to partition SNP effects into direct and indirect [46]. The results of the decomposition of SNP effects are discussed for each trait separately below. Because the network only revealed indi-rect effects for WU and WUE, we focused on these traits for decomposing marker effects.
Fig. 2 Pictorial representation of trait network and SNP effects ( ˆs ) using the structural equation model for four traits. Unidirectional arrows indicate the direction of effects and bidirectional arrows represent genetic correlations (g) among phenotypes. PSA: Projected shoot area; RB: root biomass; WU: water use; WUE: water use efficiency; ǫ : residual
Table 3 Structural coefficients ( ) estimates derived from the structural equation models
PSA: projected shoot area; RB: root biomass; WU: water use; WUE: water use efficiency
Path Structural
coefficient
PSA → WU 13 0.761
PSA → WUE 14 0.963
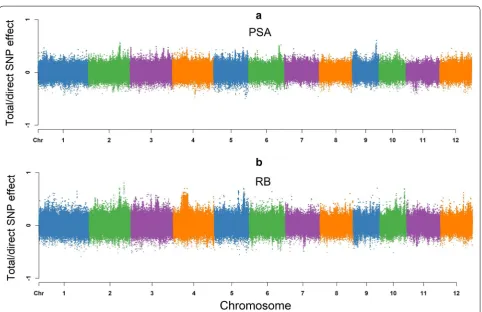
Projected shoot area (PSA)
Figure 3 shows a Manhattan plot of SNP effects on the PSA. According to the path diagram, there is no interven-ing trait or any mediator variable for PSA (Fig. 2). It is pos-sible that the PSA architecture is only influenced by the direct SNP effects, and is not affected by any other media-tors or pathways. Hence, the total effect of jth SNP on PSA is equal to its direct effects.
Root biomass (RB)
No incoming edges were detected for RB, resulting in a sim-ilar pattern to PSA, which suggests that SNP effects on RB were not mediated by other phenotypes. As shown in Fig. 3, a Manhattan plot for RB consists of direct and total effects.
Directsj→y1PSA =sj(y1PSA)
Totalsj→y1PSA =Directsj→y1PSA
=sj(y1PSA)
Directsj→y2RB =sj(y2RB)
Totalsj→y2RB =Directsj→y2RB
=sj(y2RB)
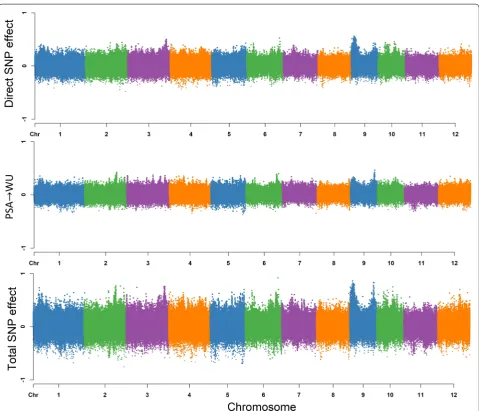
Water use (WU)
Based on Fig. 2, the total effects for a single SNP can be decomposed into direct effects on WU and indi-rect effects in which PSA acts as a mediator as WU has a single incoming edge from PSA. Thus, the SNP effect transmitted from PSA contribute to the total SNP effect on WU. Under these conditions, the estimated total SNP effects for WU cannot be simply described as the direct effect of a given SNP, since the indirect effect of PSA must also be considered. This is different from MTM-GWAS, which does not distinguish between the effects mediated by mediator phenotypes, and only captures the overall SNP effects. Here it should be noted that the extent of SNP effects from PSA on WU are controlled by the structural equation coefficients 13 . Figure 4 shows a
Manhattan plot of SNP effects on WU. Directsj→y3WU =sj(y3WU)
Indirectsj→y3WU =13sj(y1PSA)
Totalsj→y3WU =Directsj→y3WU +Indirectsj→y3WU
Water use efficiency (WUE)
The overall SNP effects for WUE can be partitioned into one direct and two indirect genetic signals (Fig. 2). WU and WUE are the traits that do not have any outgoing path to other traits. According to Fig. 5, the extents of the SNP effects among the two indirect paths were (1) RB → WUE, and (2) PSA → WUE in increasing order.
We found that the SNP effect transmitted through RB had the smallest effect on WUE, suggesting that modi-fying the size of the QTL effect for RB may not have a
noticeable effect on WUE, whereas a change in PSA may have a noticeable effect on WUE. The magnitude of the relationship between RB and WUE is proportional to the product of structural coefficients 24=0.045 . PSA
influenced WUE via a single indirect path, and strongly depends on the structural coefficient 14 =0.963 for PSA → WUE. Collectively these results suggest that WUE can be influenced by selection on PSA.
The direct and indirect effects are summarized with the following equation:
Leveraging SEM‑GWAS to decompose pleiotropic QTL
Pleiotropy can be simply defined as a gene that has an effect on multiple traits, however understand-ing how the gene acts on multiple traits is a challenge. The advantage of SEM-GWAS is that it can be used to understand how a QTL acts on multiple interrelated traits. Thus, it can be used to decompose pleiotropic QTL effects into direct and indirect effects, and under-stand how a given QTL acts on multiple traits. We next sought to identify QTL with pleiotropic effects and elu-cidate how the QTL acts on the traits. To this end, we ranked SNPs from MTM-GWAS based on p-values to select the top 50 SNPs for each trait and used SEM-GWAS to elucidate how marker effects were partitioned among traits (Additional file 1). Since the inferred net-work revealed indirect effects for only WU and WUE, downstream analyses were focused on these two traits.
Top SNPs for WU and WUE showed very different pat-terns of pleiotropy. For WU, the direct SNP effect size was on average 57% higher than the indirect SNP effect size coming from PSA, indicating that the total SNP effects from WU are driven largely by genetic effects acting directly on WU rather than indirectly through PSA. How-ever for WUE, direct SNP effects on WUE had a much smaller contribution to total SNP effects compared to indi-rect effects from PSA. For instance, comparisons between direct SNP effect on WUE and indirect effects from PSA on WUE showed that direct effects were, on average, 16% lower than indirect effects. While indirect contributions from RB on total SNP effects were minimal, with indi-rect effects from RB on WUE showing an approximately 30 fold lower effect than direct effects on WUE. Thus, for many loci associated with WUE, the total effects may be driven largely by the marker’s effect on PSA rather than WUE directly. These patterns may be due to the very high genomic correlation between PSA and WUE.
While most of the top SNPs from MTM for WU showed larger direct effects on WU compared to indirect effects through PSA, several loci were iden-tified where direct effects were nearly equal to indi-rect effects. For instance, the diindi-rect effect on WU for SNP-4.30279060. was − 0.272, while the indirect effect through PSA was − 0.268. Moreover, this SNP was the
Directsj→y4WUE=sj(y4WUE)
Indirect(1)sj→y
4WUE=14sj(y1PSA) Indirect(2)s
j→y4WUE=24sj(y2RB)
TotalSj→y4WUE=Directsj→y4WUE+Indirect(1)sj→y4WUE
+Indirect(2)sj→y4WUE
=sj(y4WUE)+14sj(y1PSA)+24sj(y2RB)
second most significant SNP associated with PSA from MTM-GWAS. The effects of this SNP on both PSA and WU is apparent in Fig. 6. Individuals with the “2” allele had considerably lower shoot biomass and lower water use than those with the “0” allele. Conversely, SNPs with small indirect effects on WU through PSA rela-tive to direct effects on WU were ranked much lower for MTM-GWAS for PSA. The SNP-10.2860531. had considerably smaller indirect effect on WU through PSA relative to the direct effect on WU (− 0.124 and − 0.327, respectively) on WU, and was ranked 17,902 for PSA from MTM-GWAS.
To further examine the putative biological effects of these loci, we next sought to identify candidate genes near SNPs of interest. To this end, we extracted genes within a 200 kb window of each SNP. The window size was selected according to the potential genetic varia-tion that can be tagged by common SNPs as a funcvaria-tion of pairwise SNP LD as reported by Zhao et al. [21]. Sev-eral notable genes were identified that have reported role in regulating plant growth and development, hor-mone biosynthesis or abiotic stress responses. For instance, a gene encoding a gibberellic acid catabolic protein (GA2ox7) was identified approximately 3.5 kb downstream from a SNP (SNP-1.5964363.) associated
with WUE through MTM-GWAS (Table 4) [47, 48].
Interestingly, SEM-GWAS revealed that indirect effect from PSA on WUE was approximately 57% greater than direct effects on WUE ( ˆs=− 0.335 and − 0.213,
respectively). In addition to OsGA2OX7, we identified a second gene, OVP1, that was associated with WUE.
OVP1 is known to influence abiotic stress responses in rice, as well as growth and development in Arabidop-sis [49–51]. Like OsGA2OX7, the SNP closest to OVP1
showed larger indirect effects from PSA on WUE than direct effects ( sˆ= 0.430 and 0.344, respectively).
Several notable genes were identified for WU that have reported roles in regulating plant development and drought tolerance (Table 5). For instance, a gene encoding a lipid transfer protein (OsDIL1) was identi-fied approximately 24 kb upstream of a SNP associated (SNP-10.2860531.) with WU through MTM-GWAS. Guo et al. [52] showed that plants overexpressing
Discussion
The relationship between biomass and WU in rice may involve complex network pathways with recursive effects. These network relationships cannot be modeled using a standard MTM-GWAS model. In this study, we incor-porated the network structure between four phenotypes, PSA, RB, WU, and WUE, into a multivariate GWAS model using SEM. In GWAS, a distinction between undirected edges and directed edges is crucial, because often biologists and breeders are interested in studying and improving a suite of traits rather than a single trait in isolation. Moreover, intervention on one trait often influences the expression of another [54]. As highlighted in Alwin and Hauser [46], one of the advantages of SEM is that it is capable of splitting the total effects into direct and indirect effects. In regards to genetic studies, SEM enables the researcher to elucidate the underlying
mechanism by which an intervention trait may influence phenotypes using a network relationship [55, 56].
Detecting putative causal genes is of considerable inter-est for determining which traits will be affected by spe-cific loci from a biological perspective, and consequently partitioning the genetic signals according to the paths determined. Although the parameter interpretations of SEM as applied to QTL mapping [57, 58], expression QTL [59], or genetic selection [42] have been actively pursued, the work of Momen et al. [7] marks one of the first studies to account for the level of individual SNP effect in genome-wide SEM analyses. The SEM embeds a flexible framework for performing such network analysis in a GWAS context, and the current study demonstrates its the first application in crops. We assumed that mod-eling a system of four traits in rice simultaneously may help us to examine the sources of SNP effects in GWAS in greater depth. Therefore, we used two GWAS methodol-ogies that have the ability to embed multiple traits jointly, so that the estimated SNP effects from both models have different meanings. The main difference between SEM-GWAS and MTM-SEM-GWAS is that the former includes the relationship between SNPs and measured phenotypes, coupled with relationships that are potentially mediated by other phenotypes (mediator traits). This advances GWAS, and consequently the information obtained from trait networks describing such interrelationships can be used to predict the behavior of complex systems [7]. Although we analyzed the observed phenotypes in the current study, the factor analysis component of SEM can be added to SEM-GWAS by deriving latent factors from multiple phenotypes [e.g., 60, 61]. The inference of a trait network structure was carried out using a Bayesian net-work, which has applications in genetics ranging from modeling linkage disequilibrium [62] to epistasis [63]. Fig. 6 Distribution of projected shoot area (PSA) and water use
(WU) for allelic groups at SNP-4.30279060. PSA values are shown in a, while water use values are shown in b. The x-axis shows allele counts at SNP-4.30279060, where 0, 1 and 2 indicate accessions that are homozygous for the reference allele, heterozygous, and homozygous for the alternative allele
Table 4 Candidate genes for water use efficiency (WUE) identified through SEM-GWAS
Chr: chromosome; BP: gene position in base pairs; GA: gibberellic acid
Gene ID Chr BP SNP Rice Annotation Putative Function Reference
LOC_Os01g11150 1 5,968,819 SNP-1.5964363. GA2OX7 GA catabolism [47] LOC_Os01g11054 1 5,899,555 SNP-1.5964363. OsPPC4 Growth, NH+
4 assimilation [65] LOC_Os06g43660 6 26,272,897 SNP-6.26293126. OVP1 Plant growth [49]
Table 5 Candidate genes for water use (WU) identified through SEM-GWAS
Chr: chromosome; BP: gene position in base pairs
Gene ID Chr BP SNP Rice Annotation Putative Function Reference
Effective water use and water capture are essential for the growth of plants in arid environments, where water is a limiting factor. These processes are tightly intertwined, and therefore must be studied in a holistic manner. In the current study, we sought to understand the genetic basis of water use, water capture, and growth by examining PSA, RB, WU, and WUE in a diverse panel of rice acces-sions. The identification of several QTL that affect one or more of these processes highlights the interconnected-ness of PSA, RB, WU, and WUE. Water use is a complex trait that is affected by several morphological character-istics (e.g. leaf area, stomatal density, leaf anatomical fea-tures, root architecture, anatomy, etc.), and physiological processes (e.g. stomatal aperture) that are greatly influ-enced by the environment. Thus, any approach that can partition genetic effects for WU among the multiple bio-logical processes that may influence this trait can greatly enhance our understanding of how WU is regulated. Although many of the factors influencing WU were unac-counted for in the current study, the automated pheno-typing platform provided an effective means to quantify water use for each plant while simultaneously quantify-ing shoot biomass. Thus, with these data and the SEM-GWAS framework we can begin to uncouple the complex interrelationship between plant size and water use.
Several QTL were identified for WU through MTM-GWAS. SEM-GWAS revealed that for most loci, the total SNP effect was driven largely by direct effects on WU rather than indirect effects on WU through PSA. In contrast, SEM-GWAS showed that for WUE, total SNP effects were driven largely by effects originating from PSA and acting indirectly on WUE. In the current study, WUE is a composite trait that is defined as the ratio of PSA to WU. The genomic correlation for PSA and WUE was quite high. Although genetic correlation may be due to pleiotropy or linkage disequilibrium, given the defini-tion of WUE the high genetic correladefini-tion is likely largely due to the pleiotropy [64]. Thus, these two traits are likely controlled by similar QTL, and so it may be very diffi-cult to partition total QTL effect into direct and indirect paths.
Several of the candidate genes associated with loci from MTM-GWAS shed light on the possible biological mechanisms underlying pleiotropic relationships for WU and WUE with PSA. For instance, a SNP located on chro-mosome 4 was identified for WU and harbored a gene encoding a pentatricopeptide repeat protein (MPR25). A closer inspection of this region with SEM-GWAS showed that total SNP effects on WU were largely due to indirect effects originating from PSA. Toda et al. [53] showed that
MPR25 participates in RNA editing and disruption of this gene results in slow growing plants with reduced chloro-phyll content. Although considerable work is necessary
to determine if MPR25 underlies natural variation for shoot growth (i.e., PSA) and water use, the presence of this gene near this SNP and the effects of this SNP on PSA and WU present an interesting direction for future studies. In addition to MPR25, a second gene was found near a SNP associated with WUE that had a large indirect effect through PSA, GA2OX7. The GA2OX gene family are involved in the catabolism of the growth promoting hormone gibberellic acid (GA) [47, 48]. GA play impor-tant roles in many processes, but are most well known for their role in shaping semi-dwarf rice and wheat cultivars [47, 48]. Modifications in shoot size are likely to influence water use, as larger plants will have greater surface are for evapotranspiration. Thus the presence of this gene within this region on chromosome 1 may explain the larger indi-rect effects on WUE through PSA compared to the diindi-rect effects on WUE.
A deep understanding of the complex relationship between effective water use and water capture, and its impact on plant growth in arid environments, is critical as we continue to develop germplasm that is resilient to climatic variability. As with the significant recent advances in phenomics and remote sensing technolo-gies, future plant breeders will have a new suite of tools to quantify morphological, physiological, and environ-mental variables at high resolutions. To fully harness these emerging technologies and leverage these multi-dimensional datasets for crop improvement, new ana-lytical approaches must be developed that integrate genomic and phenomic data in a biologically mean-ingful framework. This study examined multiple phe-notypes using a Bayesian network that can serve as potential factors to allow intervention in complex trait GWAS. The SEM-GWAS seems to provide enhanced statistical analysis of MTM-GWAS by accounting for trait network structures.
Conclusions
into how these traits are regulated and how intervention on one trait may affect the outcome of another.
Supplementary information
Supplementary information accompanies this paper at https ://doi. org/10.1186/s1300 7-019-0493-x.
Additional file 1.p-values of the 50 top SNPs for projected shoot area, root biomass, water use, and water use efficiency using MTM-GWAS. Additional file 2. Best linear unbiased estimates of accessions for pro-jected shoot area, root biomass, water use, and water use efficiency.
Acknowledgements
We thank Haipeng Yu for helping with data analysis.
Authors’ contributions
MTC and HW designed and conducted the experiments. MM and MTC analyzed the data. MM and GM conceived the idea and wrote the manuscript. MTC and HW discussed results and revised the manuscript. GM supervised and directed the study. All authors read and approved the final manuscript.
Funding
This work was supported by the National Science Foundation under Grant Number 1736192 to HW and GM and Virginia Polytechnic Institute and State University startup funds to GM.
Availability of data and materials
Genotypic data regarding the rice accessions can be downloaded from the rice diversity panel website (http://www.riced ivers ity.org/). Phenotypic data used herein are available in Additional file 2.
Ethics approval and consent to participate Not applicable.
Consent for publication Not applicable.
Competing interests
The authors declare that they have no competing interests.
Author details
1 Department of Animal and Poultry Sciences, Virginia Polytechnic Institute and State University, 175 West Campus Drive, Blacksburg, VA 24061, USA. 2 Department of Agronomy and Horticulture, University of Nebraska-Lincoln, Lincoln, NE 68583, USA.
Received: 11 July 2019 Accepted: 6 September 2019
References
1. Valente BD, Rosa GJ, Gustavo A, Gianola D, Silva MA. Searching for recur-sive causal structures in multivariate quantitative genetics mixed models. Genetics. 2010;185:633–44.
2. Wang H, van Eeuwijk FA. A new method to infer causal phenotype net-works using qtl and phenotypic information. PLoS ONE. 2014;9(8):103997. 3. Yu H, Campbell MT, Zhang Q, Walia H, Morota G. Genomic bayesian
confirmatory factor analysis and bayesian network to character-ize a wide spectrum of rice phenotypes. G3 Genes Genomes Genet. 2019;9:1975–86.
4. Huang X, Han B. Natural variations and genome-wide association studies in crop plants. Annu Rev Plant Biol. 2014;65:531–51.
5. Henderson C, Quaas R. Multiple trait evaluation using relatives’ records. J Anim Sci. 1976;43(6):1188–97.
6. Wright S. Correlation and causation. J Agric Res. 1921;20(7):557–85.
7. Momen M, Mehrgardi AA, Roudbar MA, Kranis A, Pinto RM, Valente BD, Morota G, Rosa GJ, Gianola D. Including phenotypic causal networks in genome-wide association studies using mixed effects structural equation models. bioRx iv.25142 1. 2018.
8. Haavelmo T. The statistical implications of a system of simultaneous equations. Econom J Econom Soc. 1943;11:1–12.
9. Goldberger AS. Structural equation methods in the social sciences. Econom J Econom Soc. 1972;40:979–1001.
10. Bielby WT, Hauser RM. Structural equation models. Annu Rev Sociol. 1977;3(1):137–61.
11. Wehner MF, Arnold JR, Knutson T, Kunkel KE, N LA. Droughts, floods, and wildfires. In: Climate science special report: fourth national climate assess-ment. 2017. vol. I. pp. 231–56.
12. Challinor AJ, Watson J, Lobell DB, Howden S, Smith D, Chhetri N. A meta-analysis of crop yield under climate change and adaptation. Nat Clim Change. 2014;4(4):287.
13. Mann ME, Gleick PH. Climate change and california drought in the 21st century. Proc Natl Acad Sci. 2015;112(13):3858–9.
14. Otkin JA, Svoboda M, Hunt ED, Ford TW, Anderson MC, Hain C, Basara JB. Flash droughts: a review and assessment of the challenges imposed by rapid-onset droughts in the United States. Bull Am Meteorol Soc. 2018;99(5):911–9.
15. Zampieri M, Ceglar A, Dentener F, Toreti A. Wheat yield loss attributable to heat waves, drought and water excess at the global, national and subnational scales. Environ Res Lett. 2017;12(6):064008.
16. Zhao C, Liu B, Piao S, Wang X, Lobell DB, Huang Y, Huang M, Yao Y, Bassu S, Ciais P, et al. Temperature increase reduces global yields of major crops in four independent estimates. Proc Natl Acad Sci. 2017;114(35):9326–31. 17. Tuberosa R, Salvi S. Genomics-based approaches to improve drought
tolerance of crops. Trends Plant Sci. 2006;11(8):405–12.
18. Sinclair TR. Challenges in breeding for yield increase for drought. Trends Plant Sci. 2011;16(6):289–93.
19. Mir RR, Zaman-Allah M, Sreenivasulu N, Trethowan R, Varshney RK. Inte-grated genomics, physiology and breeding approaches for improving drought tolerance in crops. Theor Appl Genet. 2012;125(4):625–45. 20. Passioura J. Phenotyping for drought tolerance in grain crops: when is it
useful to breeders? Funct Plant Biol. 2012;39(11):851–9.
21. Zhao K, Tung C-W, Eizenga GC, Wright MH, Ali ML, Price AH, Norton GJ, Islam MR, Reynolds A, Mezey J, et al. Genome-wide association mapping reveals a rich genetic architecture of complex traits in Oryza sativa. Nat Commun. 2011;2:467.
22. McCouch SR, Wright MH, Tung C-W, Maron LG, McNally KL, Fitzgerald M, Singh N, DeClerck G, Agosto-Perez F, Korniliev P, et al. Open access resources for genome-wide association mapping in rice. Nat Commun. 2016;7:10532. 23. Purcell S, Neale B, Todd-Brown K, Thomas L, Ferreira MA, Bender D, Maller J, Sklar P, De Bakker PI, Daly MJ, et al. Plink: a tool set for whole-genome association and population-based linkage analyses. Am J Hum Genet. 2007;81(3):559–75.
24. Browning SR, Browning BL. Rapid and accurate haplotype phasing and missing-data inference for whole-genome association studies by use of localized haplotype clustering. Am J Hum Genet. 2007;81(5):1084–97. 25. Campbell MT, Bandillo N, Al Shiblawi FRA, Sharma S, Liu K, Du Q, Schmitz
AJ, Zhang C, Véry A-A, Lorenz AJ, et al. Allelic variants of oshkt1; 1 underlie the divergence between indica and japonica subspecies of rice (Oryza sativa) for root sodium content. PLoS Genet. 2017;13(6):1006823. 26. Campbell M, Walia H, Morota G. Utilizing random regression models for
genomic prediction of a longitudinal trait derived from high-throughput phenotyping. Plant Direct. 2018;2(9):e00080. https ://doi.org/10.1002/ pld3.80.
27. Berger B, Parent B, Tester M. High-throughput shoot imaging to study drought responses. J Exp Bot. 2010;61(13):3519–28.
28. Golzarian MR, Frick RA, Rajendran K, Berger B, Roy S, Tester M, Lun DS. Accurate inference of shoot biomass from high-throughput images of cereal plants. Plant Methods. 2011;7(1):2.
29. Campbell TM, Avi CK, Berger B, Chris JB, Wang D, Walia H. Integrat-ing image-based phenomics and association analysis to dissect the genetic architecture of temporal salinity responses in rice. Plant Physiol. 2015;168:1476–89.
•fast, convenient online submission •
thorough peer review by experienced researchers in your field • rapid publication on acceptance
• support for research data, including large and complex data types •
gold Open Access which fosters wider collaboration and increased citations maximum visibility for your research: over 100M website views per year •
At BMC, research is always in progress.
Learn more biomedcentral.com/submissions
Ready to submit your research? Choose BMC and benefit from:
architecture of shoot growth dynamics in rice. Plant Genome. 2017. https ://doi.org/10.3835/plant genom e2016 .07.0064.
31. Campbell M, Momen M, Walia H, Morota G. Leveraging breeding values obtained from random regression models for genetic inference of longi-tudinal traits. Plant Genome. 2019. https ://doi.org/10.3835/plant genom e2018 .10.0075.
32. Knecht AC, Campbell MT, Caprez A, Swanson DR, Walia H. Image harvest: an open-source platform for high-throughput plant image processing and analysis. J Exp Bot. 2016;67(11):3587–99.
33. VanRaden PM. Efficient methods to compute genomic predictions. J Dairy Sci. 2008;91(11):4414–23.
34. Scutari M. Learning bayesian networks with the bnlearn R package. J Stat Softw. 2010;35(3):1–22. https ://doi.org/10.18637 /jss.v035.i03.
35. Scutari M, Graafland CE, Gutiérrez JM. Who learns better bayesian network structures: constraint-based, score-based or hybrid algorithms? 2018. arXiv preprint arXiv :1805.11908 .
36. Töpner K, Rosa GJ, Gianola D, Schön C-C. Bayesian networks illustrate genomic and residual trait connections in maize (Zea mays L.). G3 Genes Genomes Genet. 2017;7(8):2779–89.
37. Scutari M, Denis J-B. Bayesian networks: with examples in R. Florida: Chapman and Hall/CRC; 2014.
38. Kennedy B, Quinton M, Van Arendonk J. Estimation of effects of single genes on quantitative traits. J Anim Sci. 1992;70(7):2000–12.
39. Yu J, Pressoir G, Briggs WH, Bi IV, Yamasaki M, Doebley JF, McMullen MD, Gaut BS, Nielsen DM, Holland JB, et al. A unified mixed-model method for association mapping that accounts for multiple levels of relatedness. Nat Genet. 2006;38(2):203.
40. Gianola D, Sorensen D. Quantitative genetic models for describing simultaneous and recursive relationships between phenotypes. Genetics. 2004;167(3):1407–24.
41. Varona L, Sorensen D, Thompson R. Analysis of litter size and average lit-ter weight in pigs using a recursive model. Genetics. 2007;177(3):1791–9. 42. Valente BD, Rosa GJ, Gianola D, Wu X-L, Weigel KA. Is structural equation
modeling advantageous for the genetic improvement of multiple traits? Genetics. 2013;194(3):561–72.
43. Meyer K, Tier B. “snp snappy”: a strategy for fast genome-wide association studies fitting a full mixed model. Genetics. 2012;190(1):275–7. 44. Gianola D, de los Campos G, Toro MA, Naya H, Schön C-C, Sorensen D. Do
molecular markers inform about pleiotropy? Genetics. 2015;201(1):23–9. 45. Momen M, Mehrgardi AA, Sheikhy A, Esmailizadeh A, Fozi MA, Kranis
A, Valente BD, Rosa GJ, Gianola D. A predictive assessment of genetic correlations between traits in chickens using markers. Genet Sel Evol. 2017;49(1):16.
46. Alwin DF, Hauser RM. The decomposition of effects in path analysis. Am Sociol Rev. 1975;40:37–47.
47. Lo S-F, Yang S-Y, Chen K-T, Hsing Y-I, Zeevaart JA, Chen L-J, Yu S-M. A novel class of gibberellin 2-oxidases control semidwarfism, tillering, and root development in rice. Plant Cell. 2008;20(10):2603–18.
48. Sakamoto T, Miura K, Itoh H, Tatsumi T, Ueguchi-Tanaka M, Ishiyama K, Kobayashi M, Agrawal GK, Takeda S, Abe K, et al. An overview of gibberel-lin metabolism enzyme genes and their related mutants in rice. Plant Physiol. 2004;134(4):1642–53.
49. Zhang J, Li J, Wang X, Chen J. OVP1, a vacuolar H+-translocating inor-ganic pyrophosphatase (V-PPase), overexpression improved rice cold tolerance. Plant Physiol Biochem. 2011;49(1):33–8.
50. Khadilkar AS, Yadav UP, Salazar C, Shulaev V, Paez-Valencia J, Pizzio GA, Gaxiola RA, Ayre BG. Constitutive and companion cell-specific overexpression of AVP1, encoding a proton-pumping pyrophosphatase, enhances biomass accumulation, phloem loading and long-distance transport. Plant Physiol. 2015;170:401–14.
51. Schilling RK, Marschner P, Shavrukov Y, Berger B, Tester M, Roy SJ, Plett DC. Expression of the arabidopsis vacuolar H+-pyrophosphatase gene (AVP1) improves the shoot biomass of transgenic barley and increases grain yield in a saline field. Plant Biotechnol J. 2014;12(3):378–86.
52. Guo C, Ge X, Ma H. The rice osdil gene plays a role in drought tolerance at vegetative and reproductive stages. Plant Mol Biol. 2013;82(3):239–53. 53. Toda T, Fujii S, Noguchi K, Kazama T, Toriyama K. Rice MPR25 encodes a
pentatricopeptide repeat protein and is essential for RNA editing of nad5 transcripts in mitochondria. Plant J. 2012;72(3):450–60.
54. Shipley B. Cause and correlation in biology: a user’s guide to path analysis. Cambridge: Structural Equations and Causal Inference with R. Cambridge University Press; 2016.
55. Wu X-L, Heringstad B, Gianola D. Bayesian structural equation models for inferring relationships between phenotypes: a review of methodology, identifiability, and applications. J Anim Breed Genet. 2010;127(1):3–15. 56. Onogi A, Ideta O, Yoshioka T, Ebana K, Yamasaki M, Iwata H. Uncovering
a nuisance influence of a phenological trait of plants using a nonlinear structural equation: application to days to heading and culm length in asian cultivated rice (Oryza sativa L.). PLoS ONE. 2016;11(2):0148609. 57. Li R, Tsaih S-W, Shockley K, Stylianou IM, Wergedal J, Paigen B, Churchill
GA. Structural model analysis of multiple quantitative traits. PLoS Genet. 2006;2(7):114.
58. Mi X, Eskridge K, Wang D, Baenziger PS, Campbell BT, Gill KS, Dweikat I. Bayesian mixture structural equation modelling in multiple-trait QTL mapping. Genet Res. 2010;92(3):239–50.
59. Liu B, de La Fuente A, Hoeschele I. Gene network inference via structural equation modeling in genetical genomics experiments. Genetics. 2008;178:1763–76.
60. Verhulst B, Maes HH, Neale MC. GW-SEM: a statistical package to conduct genome-wide structural equation modeling. Behav Genet. 2017;47(3):345–59.
61. Leal-Gutiérrez JD, Rezende FM, Elzo MA, Johnson D, Peñagaricano F, Mateescu RG. Structural equation modeling and whole-genome scans uncover chromosome regions and enriched pathways for carcass and meat quality in beef. Front Genet. 2018;9:532.
62. Morota G, Valente B, Rosa G, Weigel K, Gianola D. An assessment of link-age disequilibrium in holstein cattle using a Bayesian network. J Anim Breed Genet. 2012;129(6):474–87.
63. Han B, Chen X-W, Talebizadeh Z, Xu H. Genetic studies of complex human diseases: characterizing SNP-disease associations using Bayesian networks. BMC Syst Biol. 2012;6(3):14.
64. Jiang C, Zeng Z-B. Multiple trait analysis of genetic mapping for quantita-tive trait loci. Genetics. 1995;140(3):1111–27.
65. Masumoto C, Miyazawa S-I, Ohkawa H, Fukuda T, Taniguchi Y, Murayama S, Kusano M, Saito K, Fukayama H, Miyao M. Phosphoenolpyruvate car-boxylase intrinsically located in the chloroplast of rice plays a crucial role in ammonium assimilation. Proc Natl Acad Sci. 2010;107(11):5226–31. 66. Verslues PE, Sharma S. Proline metabolism and its implications for
plant–environment interaction. Arabidopsis Book/Am Soc Plant Biol. 2010;8:e0140.
Publisher’s Note