R E S E A R C H
Open Access
A framework and model system to investigate
linear system behavior in
Escherichia coli
Meghdad Hajimorad
1,2,3,4, Paul R Gray
1and Jay D Keasling
2,3,4,5,6,7*Abstract
Background:The ability to compose biological systems from smaller elements that act independently of the other upon assembly may help make the forward engineering of biological systems practical. Engineering biology in this manner is made difficult by the inherent nonlinear response of organisms to genetic devices. Devices are inevitably coupled to one another in the cell because they share the same transcriptional machinery for expression. Thus, new properties can emerge when devices that had been characterized in isolation are expressed concurrently. We show in this report that, similar to physical systems, theEscherichia coli(E. coli) transcriptional system can exhibit linear behavior under“small”perturbation conditions. This, in turn, allows devices to be treated as independent modules.
Results:We developed a framework and model system consisting of three devices to investigate linear system behavior inE. coli. Our framework employed the transfer curve concept to determine the amount of nonlinearity elicited by theE. colitranscriptional system in response to the devices. To this effect, the model system was quantitatively characterized using real-time quantitative PCR to produce device transfer curves (DTCs). Two of the devices encoded the bacterial neomycin phosphotransferase II (nptII) and chloramphenicol acetyl transferase (cat), while the third encoded the jellyfish-originating green fluorescent protein (gfp). Thegfpdevice was the most nonlinear in our system, withnptII andcatdevices eliciting linear responses. Superposition experiments verified these findings, with independence among the three devices having been lost whengfpwas present at copy numbers above the lowest one used.
Conclusions:We show that linear system behavior is possible inE. coli. Elucidation of the mechanism underlying the nonlinearity observed ingfpmay lead to design rules that ensure linear system behavior, enabling the accurate prediction of the quantitative behavior of a system assembled from individually characterized devices. Our work suggests that biological systems follow principles similar to physical ones, and that concepts borrowed from the latter (such as DTCs) may be of use in the characterization and design of biological systems.
Background
Engineering biological systems with predictable, quanti-tative behavior is currently a challenging problem. Pre-sently, this requires months (at times years) of trial-and-error type of experiments, with the engineering of func-tional systems being more akin to art than engineering [1]. Synthetic biology aims to develop foundational prin-ciples and technologies that will enable the systematic forward engineering of biological systems [2-4]. In parti-cular, synthetic biology aims to develop frameworks that
apply the engineering principles of abstraction, modular-ity, and composition to biological engineering. Basic abstraction and physical composition frameworks have been applied to the engineering of biology through the use of BioBricks and the Registry of Standard Biological Parts [5-7]. A characteristic feature of other established engineering disciplines is the ability to design and con-struct systems by way of modularity. The concept of modularity allows engineers to design and build physical systems by bringing together modules that contribute independently to the whole, thereby giving rise to a sys-tem whose quantitative behavior can be predicted from its constituent modules [8-10]. A pressing research question is whether the complexity of living organisms
* Correspondence: [email protected]
2
Synthetic Biology Engineering Research Center, University of California, Berkeley, CA 94720, USA
Full list of author information is available at the end of the article
allows engineers to design and construct biological sys-tems from smaller elements characterized in isolation [11,12]. The success of synthetic biology as an engineer-ing discipline will depend, in part, on establishengineer-ing the conditions necessary for this independence property to hold true in living systems [13]. The research contribu-tion of this study is the applicacontribu-tion of engineering prin-ciples towards realizing modularity and functional composition in biological systems. More specifically, we show that genetic devices (each consisting of a promo-ter, ribosome binding site, gene of interest, and tran-scription terminator) can behave in a standardized, quantitatively predictable manner. The ability to view devices as modules may be of benefit in such applica-tions as metabolic pathway construction for the produc-tion of natural products and other chemicals (microbial chemical factories).
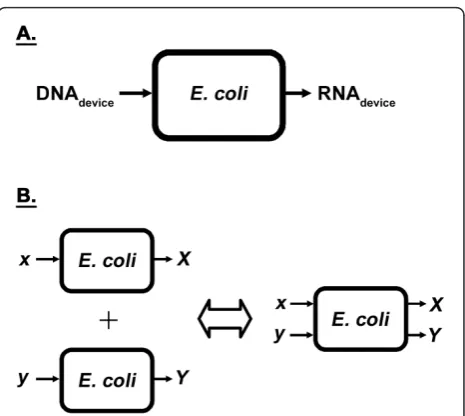
Once introduced into the host cell as DNA, a syn-thetic device must first be expressed by the native tran-scriptional machinery in order to give rise to the desired function (e.g. production of transcript, desired protein, or metabolites, transduction of a signal, etc.). Synthetic devices introduced into Escherichia coli (E. coli) for engineering purposes are, in essence, additional devices imposed on top of those present in the wildtype (base-line) case. Synthetic devices can, thus, only begin to behave independently if their respective transcript levels are not affected by the addition of other synthetic devices. This is because of transcription being the initial process in gene expression. In order to motivate the experimental approach taken, the transcriptional machinery of theE. colihost cell was viewed as a system in this study. Devices in the form of DNA are its input, with the resultant RNA produced its output (Figure 1A). Synthetic devices, however, are not the only inputs to
the system. Thousands of devices are encoded on theE.
coligenome [14], whose regulated expression allow the
organism to survive and grow in a given environment. The same molecular players and building blocks
involved in synthesizing RNA encoded by the host’s
native (chromosomally-encoded) devices are involved in the transcription of synthetic (heterologous) devices. The system (Figure 1A), thus, not only has synthetic devices as inputs, but also the native devices. For inde-pendence among devices (synthetic and native) to be possible, the system must be linear, thereby exhibiting the superposition principle by definition [15]. The superposition property of linear systems states that the net response caused by two or more inputs is the sum of the responses that would have been caused by each
stimulus individually. That is, if x andy amounts of
DNA for a couple of devices alone produce X andY
amounts of transcript, respectively, then the concurrent addition of both devices to the system should lead to
the formation of X andYamounts of transcript (Figure
1B). Systems in practice, however, are nonlinear and do not abide by the superposition principle. As such, the different synthetic and native inputs to the system can-not be studied in isolation. Design for predictable, quan-titative behavior would, thus, not only require an understanding of how synthetic devices couple to one another by way of the nonlinearity present in theE. coli system, but also how they couple to the host’s native devices. Our current level of understanding of these interactions is limited at best qualitatively, much less so in a quantitative manner. This, in part, may explain the difficulty associated with engineering biological systems with predictable, quantitative behavior. As they are embedded inside complex host cells, many interactions are possible between the host cell and introduced constructs.
This study began with the hypothesis that the intro-duced synthetic devices can be viewed as perturbations to theE. colisystem. That is, the amount of DNA acting as input to the transcriptional machinery of the host increases with their addition. So long as this increase (i.e., perturbation) is kept“small,”theE. colisystem may per-haps be approximated as a linear one with respect to the introduced synthetic devices, thereby enabling superposi-tion and the decoupling of synthetic devices from one another. This is the small-signal approximation used in the field of electronic circuit design [16]. There, it is used
in the design of analog amplifiers, where voltage and cur-rent signals act as inputs to nonlinear, transistor-based systems. It should be noted that the copy number of syn-thetic devices may not be the only factor that perturbs microbial organisms. Promoter strength, ribosome binding site (RBS) strength, gene length, codon usage, and product function are perhaps important factors too. As the intent of our study was to investigate whetherE. colican accom-modate linear system behavior with standard elements used to genetically modify the organism, we focused on copy number here. Our approach to investigate system nonlinearity involved varying the copy number of devices to generate transfer curves. Nonlinearity of physical sys-tems is often investigated by using transfer curves, where
the transfer curve of a system specifies how its output var-ies with respect to its input under steady-state conditions [16,17]. We show with our approach that concepts applic-able to physical systems also apply to biological ones, and that superposition is possible in E. coliunder certain conditions.
Results
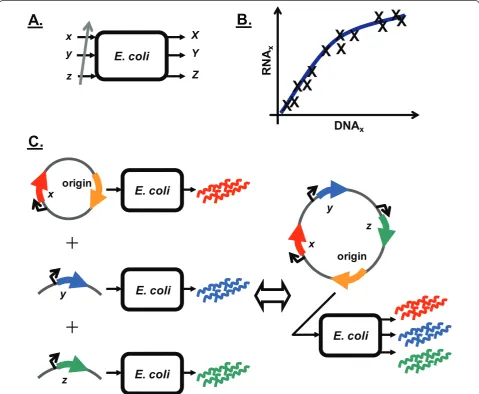
A model system was constructed to enable the
introduc-tion of genetic devices into E. coli at different copy
numbers (Figure 2A). The resultant RNA produced was quantified at each copy number to produce RNA versus DNA device transfer curves (DTCs) (Figure 2B). DTCs were subsequently analyzed to gauge the nonlinearity of
+
+
x
y
z
X
Y
Z
E. coli
E. coli
E. coli
E. coli
E. coli
x
x
y
z
y
z
origin
origin
A.
C.
X
X
X
X
X
X
X
X
X X
XX
X
RNA
x
DNA
xB.
the E. colisystem response to individual devices, with linear system behavior being verified by showing the presence of superposition (Figure 2C).
Copy number of genetic device varied with plasmid origin of replication
The degree to which a plasmid replicates in E. coli is
governed by its origin of replication. Using different ori-gins, one can vary the number of copies of plasmid pre-sent in the host cell. The number of copies of the
synthetic devices introduced into E. coliwould
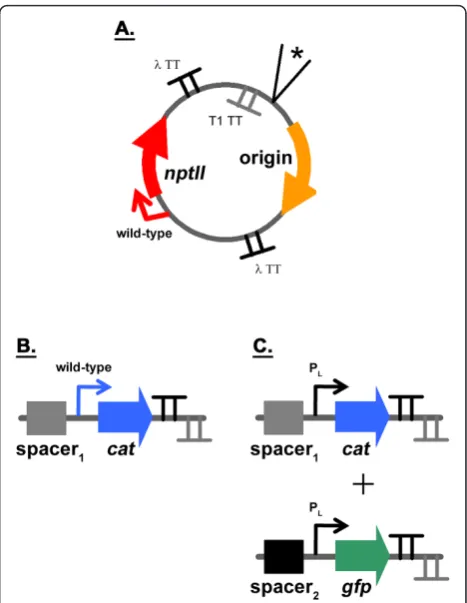
subse-quently be varied as they are harbored on the plasmid. In developing the model system for this work, the plas-mid origin of replication was flanked by terminators (Figure 3A) to minimize possible transcriptional read-through from replicons, which rely on transcription for functionality [18,19], into neighboring devices. The two terminators used in the plasmid backbone (and all of
the other constructs) were the bacterial rrnB T1 and
bacteriophage lambda t0. These strong transcriptional terminators have been widely used [20,21]. We first veri-fied that the number of copies of a device can be varied in our system by using different replicons. To this effect, the origins of plasmids pSC101 [22], p15A [23], pMB1 [24], and pUC [24] were cloned into the backbone to determine whether the copy number of the neomycin phosphotransferase II (nptII) device varied (Figure 3A). This device confers resistance to the antibiotic kanamy-cin. The replicons from pSC101, p15A, and pMB1 are in different incompatibility groups [18,19]. As the origin of pUC is that of pMB1 with a single point-mutation [24], these two replicons are not compatible with one
another.E. coli DH1 cells harboring plasmid backbone
constructs (Figure 3A) were grown in LB and M9 mini-mal media as described in the Methods. The growth rate of cells was comparable among the constructs, with OD600 nm in the log phase doubling every ~50 and ~80
minutes in LB and M9, respectively (Table 1). With the growth rate of cells not varying with replicon (Table 1), it appears unlikely that kanamycin (which was used for selection) elicits an effect onnptIIexpression. That is, it appears that the level of nptII expressed at the lowest copy number of replicon pSC101 surpasses the mini-mum threshold necessary for cell survival. Once in mid-exponential growth, cells were harvested and total DNA extracted. Real-time quantitative PCR (qPCR) was
sub-sequently used to determine the copy number of nptII
for each construct [22,25-27]. Our results were similar to values reported for plasmid copy number (Figure 4A) [22-24]. It should be mentioned that the pUC origin of replication is temperature sensitive. While higher plas-mid copy number values have been reported for this
replicon at 37°C and 42°C, the reduced values observed here are consistent with the 30°C growth temperature used in this study [24]. Our results indicate that the copy number of a device can be varied successfully by changing the origin of replication (Figure 4A), with the range being ~6X for the constructs tested (Figure 3A). The copy number resulting from a particular origin (relative to that of pSC101) also does not appear to be impacted by the growth medium used (Figure 4A).
Linear device transfer curves obtained inE. coli
After verifying that the copy number of nptII can be
varied in our system, we performed experiments to obtain its DTC. Cells that had been harvested above were used to quantify the transcript level of the nptII
device. Total RNA was extracted from cells and tran-script level quantified using real-time qPCR [28-30]. The results were plotted against the copy number values determined prior (Figure 4A), yielding the DTC (Figure 4B). RNA transcript level and copy number values have
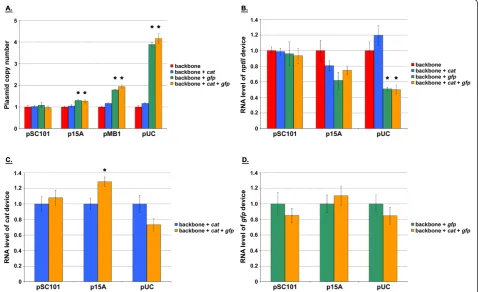
Figure 4DTC characterization of backbone and two-device containing constructs.A.nptIIcopy numbers obtained from the plasmid backbone (Figure 3A) harboring the different replicons used. Each construct was tested at least in duplicate for each medium. The mean value has been reported, with the error bars denoting standard error. Values were normalized to that of the pSC101 construct, which was assigned a mean value of one.B.nptIIDTC obtained from the series of plasmid backbones (Figures 3A) for LB (orange, circle) and M9 (square, blue) media. Each construct was tested at least in duplicate for each medium.C,D.nptIIandcatDTCs obtained from the series of two-device plasmids (Figure 3B). The cumulative data presented were the result of two independent experiments. Constructs were tested in duplicate during each independent experiment. Three data points (and not four) are shown for the pMB1 construct because a replicate was lost during sample preparation. RNA and copy number values in panels B, C, and D were normalized to that of the pSC101 construct, with each having been assigned a mean value of one. The regression lines that minimized the sum of squared residual error are also shown, with their corresponding coefficient of determination R2.
Table 1 Doubling time of cells grown in the indicated media harboring the plasmid backbone (Figure 3A) pSC101
replicon
p15A replicon
pMB1 replicon
pUC replicon
LB 45 ± 1 50 ± 2 54 ± 3 49
M9 80 ± 3 83 ± 3 83 ± 5 84 ± 5
been normalized to that of the pSC101 construct, which were assigned a mean value of one in each case. The y-axis value for each data point indicates how that parti-cular construct’s steady-state transcript level compares relative to that of the pSC101 construct. Similarly, the x-axis value for each data point in the plot indicates how that particular construct’s steady-state copy number compares relative to that of the pSC101 construct. Also shown in the plot are linear regressions fitted to the data. With R2> 0.9, the data suggest that theE. coli
sys-tem response to the nptII device perturbation can be
considered linear. The 95% confidence interval for the y-intercepts were also -0.3 - 0.8 and -0.3 - 0.5 for LB and M9 media, respectively. These included the origin, further suggesting that a linear regression was an appro-priate fit for the data. That is, one cannot have nptII RNA transcript produced when there is no correspond-ing DNA present in the cell. Our results also suggest that the DTC ofnptIIcan be linear under different con-texts. That is, the choice of growth medium does not appear to impact system linearity (Figure 4B).
We next introduced another device into the plasmid backbone to increase the perturbation level. The goal was to see whether the presence of an additional device would lead to nonlinear DTCs. This device encoded chloramphe-nicol acetyl transferase (cat), which confers resistance to
the antibiotic chloramphenicol. The cat device was
expressed from its native promoter (Figure 3B).E. coli DH1 cells harboring the constructs were grown in LB medium as described in the Methods. No chloramphenicol was added to the medium during growth, with only kana-mycin having been used for selection purposes. The growth rate of cells was comparable among the constructs,
with OD600 nm doubling every ~50 minutes in the log
phase (data not shown). At mid-exponential growth, cells were harvested and total RNA and DNA extracted. Rela-tivenptIIandcattranscript levels and copy number were subsequently quantified using real-time qPCR (Figures 4C and 4D). As was done for the backbone (Figure 4B), linear regressions were fitted to the data. With a R2> 0.96 for each device, the data suggest that the combinednptIIand catdevice perturbation level appears to be“small”enough to elicit a linear response from theE. colisystem. The 95% confidence intervals were also -0.7 - 0.2 and -1.0 - 0.8 for nptIIandcaty-intercepts, respectively, including the ori-gin for each device once again. The fact that no chloram-phenicol was present in the growth medium suggests linear transfer curve response is not due to antibiotic resis-tance mechanisms.
Introduction ofgfpgenetic device led to nonlinear device
transfer curves
Considering the results described above, we constructed a model system consisting of three genetic devices to
see if nonlinear DTCs would be obtained (Figure 3C). The model system is the plasmid backbone analyzed previously (Figure 3A) with two additional devices added. One genetic device encodescat, while the other
encodes green fluorescent protein (gfp). In order to
investigate whether other factors besides the identity of a device’s promoter impacts linear system behavior, a derivative of the constitutive bacteriophage PL l
promo-ter was used for bothcatandgfp[31].E. coliDH1 cells harboring the model system constructs (Figure 3C) were grown in LB medium as described in the Methods. At mid-exponential growth, cells were harvested and total
RNA and DNA extracted. Relative nptII, cat, andgfp
transcript levels and copy number were subsequently quantified using real-time qPCR to obtain DTCs (Figure 5). Note that the copy number of the pUC construct relative to its pSC101 counterpart was ~6X greater com-pared to the similar constructs in the previously studied series of plasmids (Figure 4). Unlike the latter series of plasmids, the growth rate of cells was not comparable among constructs harboring the three devices of the model system. While cells harboring the pSC101, p15A, and pMB1 constructs had doubling times comparable to one another (and similar to the ~50 minute doubling time found for the constructs used in the experiments of Figure 4, data not shown), the doubling time of cells harboring the pUC construct was ~2X greater (Table 2). It has been observed that that the plasmid copy number of constructs with ColE1-derived origins (e.g. pUC) increase under slow-growth conditions [32]. Our results are consistent with these findings.
As done for the other systems, a linear regression was fitted to thegfpdata (Figure 5A). The results suggested
that the E. colisystem response to the gfp device was
through the origin. This way, the appropriateness of the fit could later be verified by noting the y-intercept obtained from the slopes and breakpoint numerically computed by the NLIN procedure. No noticeable nor-mality or variance issues were observed after analyzing the residuals in SAS (data not shown), strengthening the argument for the appropriateness of the model. A y-intercept of 0.07 was obtained, which is approximately equal to the origin. The change in slope between the two segments (~7X fold) was taken as a means to report the nonlinearity observed in thegfpDTC.
As was done forgfp, SAS was used to fit
piecewise-lin-ear models to the data for the nptII and cat devices
(Figure 5B and 5C, respectively). Unlike the former, however, the fits that minimized the sum of squared residuals had the first segment consisting of data points for the pSC101, p15A, and pMB1 constructs (data not shown). The second segment could, thus, not be deter-mined because the pUC construct remained as the only available point (i.e. one needs two points to fit a line). As an approximate solution to this problem, a piece-wise-linear model was determined for each device by fit-ting a linear regression to the pSC101, p15A, pMB1 and pMB1, pUC constructs for the first and second ments, respectively (Figures 5B and 5C). The two seg-ments for thenptII andcat devices had similar slopes. This was noticeably smaller than the ~7X fold change observed forgfp(Figure 5A).
Superposition lost at higher expression levels with the
addition ofgfp
We next performed superposition experiments to verify the DTC results of the previous section and to
deter-mine whether theE. colisystem can indeed behave as a
linear system under “small”perturbation conditions. If
the nonlinear E. coli system can be approximated as a
linear one, the perturbing devices may be studied inde-pendent of one another (Figure 2C). This, in turn, would allow one to predict the response ofE. colito the
complete system (backbone with both cat and gfp
devices) from characterization data of the individual devices. In other words, the addition of new devices would not impact the expression levels of the devices
present prior. E. coli DH1 cells harboring either the
empty plasmid backbones or the various backbones
con-taining cator/and gfp devices were grown in LB
med-ium. At mid-exponential growth, cells were harvested and total DNA extracted. Plasmid copy number was subsequently quantified using real-time qPCR (Figure 6A). Our results indicated that the plasmid copy
num-ber was unaffected by the addition of catand/or gfp
devices to the backbone with a pSC101 origin. Device addition, however, began to have an impact at higher
copy numbers. The change in plasmid copy number was most pronounced by the addition of thegfpdevice, with those resulting fromcatnot being statistically significant even with the pUC replicon. While the growth rate data (Table 2) also support this finding, the numbers suggest that a change in the plasmid copy is not necessarily
reflected by a corresponding change in the cell doubling time.
The larger nonlinearity observed in the gfp DTC
(Figure 5A) interestingly also manifested itself in super-position experiments involving device transcript levels. Cells containing the pSC101, p15A, and pUC origins
Table 2 Doubling time of cells grown in LB medium harboring the different constructs in model system pSC101
replicon
p15A replicon
pMB1 replicon
pUC replicon
backbone 45 ± 1 50 ± 2 54 ± 3 49
backbone withcatdevice 45 51 ± 2 58 ± 4 50
backbone withgfpdevice 46 ± 1 53 ± 2 56 ± 1 80 ± 2
backbone withcatandgfpdevices 46 ± 1 53 62 ± 11 103 ± 2
Numbers indicate the time in minutes necessary for the OD600 nmto double in the log phase. The mean value ± 95% confidence interval as determined in duplicate has been reported.
that had been harvested above were used to quantify the transcript levels of the different devices. The latter two replicons were chosen so as to have data points on either side of the DTC breakpoints (Figure 5). The pSC101 origin was selected to investigate whether superposition observed at the plasmid copy level (Figure 6A) also applied to device transcript levels. Total RNA was extracted from cells and transcript levels quantified using real-time qPCR (Figures 6B, 6C, and 6D). As the plasmid copy varied among the constructs for a particu-lar replicon (Figure 6A), transcript levels were not only normalized to the endogenous 16S but also to the plas-mid copy number. That is, values reported are RNA produced per unit plasmid. Superposition would be in
effect if the amount of RNA produced by the nptII
device (Figure 6B) did not change after additional devices had been introduced into the plasmid. That is with superposition, if the plasmid backbone harboring genetic devicenptII led to the production of a certain
amount of that device’s RNA, one would obtain the
same amount upon addition ofcat and/or gfp devices.
Similar arguments apply to superposition for the cat
and gfp devices (Figures 6C and 6D, respectively). As
was the case for plasmid copy (Figure 6A), our results indicated thatnptII transcript level is unaffected by the addition ofcat and/orgfp genetic devices to a plasmid with a pSC101 replicon (Figure 6B). Device addition began to have an impact at higher copy numbers. The changes in nptII transcript level were, once again, the most pronounced by the addition of thegfpdevice, with those resulting fromcatnot being statistically significant
even with the pUC origin. The data forcat andgfpRNA
exhibited a similar pattern. Once again,cator gfp tran-script level was unaffected by the addition of the other device to a plasmid with a pSC101 replicon (Figures 6C and 6D). The addition ofgfp, however, affectedcatRNA at the higher copy numbers (Figure 6C). This was not
the case in the reverse direction. That is, cat device
addition did not impact gfpRNA at the higher copy
numbers of p15A and pUC (Figure 6D). These results suggest that the extent of the changes brought about by gfpis large enough to mask those caused by the addition ofcat.
Discussion
Our results indicate that the E. colibiological system can exhibit linear system behavior (Figure 6). In the model system presented in this work, the necessary con-dition with all three genetic devices present was to use a plasmid backbone harboring the pSC101 replicon. That is, our experimental results showed superposition to be present at this copy number. The presence of superposi-tion, however, was not only a consequence of having used the pSC101 origin. In the absence of thegfpdevice,
superposition was found even with a pUC origin (Figure 6). The finding that superposition is possible under dif-ferent contexts is important. It suggests that the nonli-nearity in theE. colisystem is not complex to the point of preventing design efforts to elicit a linear system response.
A simple mathematical model that captures our DTC results can be derived by noting the rate of change of a molecular entity is a synthesis term minus a degradation term. Assuming that the synthesis of RNA is propor-tional to the amount of DNA present and that its degra-dation is proportional to the amount of RNA, the equation for RNA becomes [35]
d
dtRNA=α·DNA−β·RNA, (1)
wherea andbare proportionality constants that cap-ture the synthesis and degradation rates, respectively. Under steady-state conditions, the left hand side of equation (1) becomes zero and one arrives at the follow-ing equation
RNASS= α
β ·DNASS, (2)
where RNASS and DNASS are the steady-state RNA
and copy number of the encoding DNA, respectively. The nonlinearity observed in the piecewise-linear DTCs
(Figure 5) may, thus, be modeled by a change in the αβ
slope term of equation (2). That is, the synthesis and/or degradation rate varies for the devices at higher copy numbers. Analysis of RNA degradation after cells had been treated with rifampicin did not reveal a noticeable change in the decay rates ofgfp and cat transcripts at the higher copy number of pUC relative to p15A (data not shown). This suggests that the larger nonlinearity observed ingfp is due to a modulation in the synthesis rate. The fact thatgfpandcathave identical PL
guanosine tetraphosphate (ppGpp) [37]. Perhaps, the coupling present between transcription and translation in E. coli facilitates this effect, with ribosomal ppGpp synthesis affecting upstream RNA polymerase that is in the process of transcript elongation. Cooperative activity between RNA polymerase and ribosomes has been shown to modulate the elongation rate of transcripts in E. coli[38], with this linkage involving the NusE-NusG complex [39]. It also needs to be acknowledged that copy number was the only perturbing factor considered
in our study. Thecat andgfp genes were expressed as
done previously [31] (see below). As such, the devices have different RBS sequences/strengths. Promoter strength, RBS strength, and codon usage may be coupled perturbing factors because of the cooperative activity between RNA polymerase and ribosomes. Indeed, a range of promoters, RBS strengths, and codon usage need to be used to better elucidate the mechan-ism underlying the large observed nonlinearity in gfp’s DTC (Figure 5).
Our results do, however, suggest that the transfer curve-based framework has application in the engineer-ing of biological systems. We observed a correspondence between DTC nonlinearity and the break down of linear system behavior. That is, thegfpdevice was found to eli-cit a more nonlinear DTC response from theE. coli sys-tem than the other tested devices (~7X change in slope as compared to no change fornptIIandcatdevices, Fig-ure 5), which was reflected in superposition being lost
when gfp was present at copy numbers above the
pSC101 level. While a change in growth rate offers an alternate gauge for nonlinearity, it does not appear to provide one with the same level of accuracy. The
dou-bling time as monitored by OD600 nm only began to
change noticeably with the pUC replicon (Table 2), fail-ing to indicate changes to copy number (Figure 6A) and
transcript (Figures 6B, C, and 6D) due to gfp at the
other origins. This indicates the significance of quantita-tive techniques (such as DTCs) to synthetic biology characterization efforts because growth rate alone is unable to accurately capture changes that take place due to device addition. DTCs may have application in the general characterization of devices. A device could be characterized by cloning it into a standard plasmid and its copy number varied by way of different replicons. Based on the nonlinearity gauged from its resulting DTC, one may subsequently be able to determine whether the device is well suited for eliciting a predict-able, linear response fromE. coliwhen used in combina-tion with other devices.
Determining factors that impact linear system beha-vior inE. coliwould also be of benefit to synthetic biol-ogy. Such knowledge may enable the construction of
biological systems using superposition because
guidelines for the conditions necessary that ensure lin-ear system behavior would be available. In this study, we focused on device copy number as the perturbing factor. Promoter strength is another important factor (as are RBS strength, gene length, codon usage, and product function). A library of constitutive promoters has been characterized using thecatand gfpgenes [31].
By expressing cat and gfp in the manner done in that
study, the model system constructed in this work can be used to investigate the effect promoter strength has on linear system behavior. Our results appear to suggest that the identity of a device’s promoter is not the only factor that impacts linearity in its RNA expression pro-file. While gfp had a promoter identical to that of cat, the former was the most nonlinear in our three-device model system (Figure 5). In fact, catand nptIIhad simi-lar DTCs in our three-device model system, but yet had
different promoters. Comparison of the cat DTCs in
our two-device (Figure 4D) and three-device (Figure
5C) constructs also supports this premise. The catDTC
was primarily linear for both cases. The cat device in
one experiment, however, had its native promoter
(Fig-ure 4D), while the PL promoter was used in the other
(Figure 5C). Comparison of the DTC results of our two-device (Figures 4C and 4D) and three-device (Fig-ures 5B and 5C) constructs also suggest that the amount of nonlinearity in theE. colisystem response to
devices harboring nptII and cat genes is not impacted
greatly by slow-growth conditions. Our results from the backbone, two-device, and three-device constructs also suggest that the DTC slope (which is the transfer curve gain) may act as a useful metric for characterizing
pro-moter strength of a gene. The gain of the native nptII
promoter was found to be ~1 in the various constructs tested (Figures 4B, 4C, and 5B), with similar values hav-ing been found irrespective of the choice of growth medium (Figures 4B) or a change in growth rate (Figures 4C and 5B).
observed in our model system, however, some systems can have a linear regime. So long as experiments are performed within this regime, one can avoid nonlinear effects and apply the simplifications associated with a small-signal linear model. And even if the system is to be operated in the nonlinear regime, it may be possible to introduce nonlinear correction factors to the obtained small-signal linear model. In Equation (2), for instance,
this can be modeled by having the magnitudes of a
and/orbdependent on the copy number (as opposed to
constant values). With our results suggesting that the transfer curve and small-signal concepts used in electri-cal engineering can likewise be employed towards biolo-gical systems, the application of other concepts may also be of benefit to synthetic biology. The transfer curve concept is primarily of use in studying the steady-state behavior of a system. Linear systems can also be studied in the frequency domain by using Fourier techniques, which enable engineers to predict time-domain system response. These techniques have been used previously to study the yeast osmo-adaptation system [40]. Indeed, the application of analysis and design techniques of other established engineering disciplines may enable the systematic forward engineering of biological systems for improved biotechnology applications.
Conclusions
We have presented a model system and framework to investigate linear system behavior in E. coli. With all three genetic devices present in the model system, we show the existence of superposition at the pSC101 copy
number level. In the absence of the gfp device, linear
system behavior was present even with a pUC replicon. The amount of nonlinearity in our model system appears to be biased towards the gfpdevice. This is in spite of the fact that thegfpandcat devices have identi-cal constitutive promoters. Such a finding suggests addi-tional factors besides promoter strength impact the amount of nonlinearity in a device’s steady-state RNA expression profile. Our developed DTC method may have application in the systematic testing of device non-linearity to determine whether a device will give a pre-dictable output when used in combination with other devices. This, in turn, may enable the design and con-struction of biological systems with predictable, quanti-tative behavior from smaller elements characterized in isolation.
Methods
Bacterial strains, media, and enzymes
E. coli DH10B and DH5awere used for cloning.E. coli DH1 was used for expression work. Luria-Bertani (LB) media was made as described in [41]. M9 minimal media + 0.5% glucose supplemented with micronutrients
was made as described in [42]. Restriction enzymes and T4 DNA ligase were purchased from New England Bio-labs, with digestion and ligation reactions performed as recommended by the enzyme manufacturer. PCR reac-tions were performed with Phusion polymerase from Finnzymes, and the primers used were synthesized by Integrated DNA Technologies, Inc. The composition of the PCR reactions, cycle times, and temperatures fol-lowed those suggested by the enzyme manufacturer. PCR products were sequenced once cloned into the respective plasmids to ensure that no mutations had been introduced during the amplification process. In cases where single digest cloning was performed, sequencing was also used to select for constructs with inserts in the desired orientation.
Plasmid construction
The plasmid backbones with the replicons of pSC101, p15A, pMB1, and pUC (Figure 3A) were constructed using standard molecular biology techniques [41]. These plasmids were named pAmin81 [GenBank:HQ283398], pAmin78 [GenBank:HQ283399], pAmin79 [GenBank: HQ283400], and pAmin80 [GenBank:HQ283401], respectively.
The construction of the two-device series of plasmids (Figure 3B) proceeded as follows. PCR was used to obtain a spacer and thecatgene (with its corresponding native promoter) as inserts. Primers lacZ_1_F and lacZ_1_R (Table 3) were used to obtain the spacer, with p50 gl [43] having been used as template. A spacer was used to create spatial separation between the neighbor-ingnptII and cat devices, and to not have the devices right next to each other. The spacer sequence consisted of a ~600bp fragment taken from within the coding
region of the bacterial lacZ gene. The cat gene was
obtained by using the primers cat_wt_F and cat_wt_R (Table 3), with pACYC184 having served as template.
Table 3 List of PCR primers used in the cloning of the plasmids constructed in this study
Primer Sequence
lacZ_1_F tattatctcgagtacctaggggtaacagtttctttatgg lacZ_1_R tattattctagattcgctggtcacttcgatggtttg cat_wt_F tattattctagagacgtcgaataaatacctgtgacggaag cat_wt_R tattaagagctcaggcctaataactgccttaaaaaaattacg cat_orf_F tattatggtacctttcaggagctaaggaagctaaaatg cat_orf_R taataaacgcgtccaataactgccttaaaaaaattacg PL_F tattatgacgtctccctatcagtgatagagattgacatc lacZ_2_F tattaacctaggaggatccatgttgccactcgc lacZ_2_R taataagacgtcatcggtcagacgattcattg
The spacer and cat inserts were digested with AvrII, XbaI and XbaI, SacI, respectively, and ligated into a AvrII, SacI digested pAmin81 in a three-fragment
liga-tion reacliga-tion. The cat genetic device (complete with
spacer and terminator) was subsequently transferred into pAmin78, pAmin79, pAmin80, and pAmin81 using MluIsingle digest to arrive at the desired series of plas-mids (Figure 3B).
The construction of the model system series of plas-mids (Figure 3C) proceeded by first creating a series of catdevice (with the PLpromoter) containing plasmids.
PCR was used to obtain the catopen-reading frame as
insert. The primer pairs used were cat_orf_F and cat_orf_R (Table 3), with pACYC184 having served as template. This insert was digested withKpnI, MluI, and ligated into pZE21 [44] to create pAmin92. PCR was
subsequently used to obtain thecat gene (with the PL
promoter) as insert using the primer pairs PL_F and cat_wt_R (Table 3) and pAmin92 as template. This insert was digested withAatII, StuI, and ligated into the two-device (Figure 3B) series of plasmids to yield a ser-ies ofcatdevice (with the PL promoter) containing
con-structs. Next, work began on constructing a gfp device
(with the PL promoter) containing construct with
pSC101 as the origin. This plasmid was called pAmin81 +gfpPL. PCR was used to obtain a spacer (different in
sequence from that above) and thecatgene as inserts.
Primer pairs lacZ_2_F and lacZ_2_R (Table 3) were used for the spacer, and p50 gl served as the template.
The cat gene was obtained by using the primers
cat_wt_F and cat_wt_R (Table 3), with pACYC184 hav-ing served as template. The spacer here was to create
spatial separation between the neighboring catand gfp
devices, and consisted of a ~600 bp fragment taken
from within the coding region of the bacterial lacZ
gene. The spacer and cat inserts were digested with
AvrII, AatII and AatII, SacI, respectively, and ligated into aAvrII, SacIdigested pAmin81 in a three-fragment
ligation reaction to create pAmin93. The catgenetic
device (complete with spacer and terminator) was subse-quently transferred into pAmin81 to create pAmin99.
PCR was next used to obtain the gfp open-reading
frame as insert. Primer pairs gfp_F and gfp_R (Table 3) were used, with BBa_E0044 [5] serving as the template. This insert was digested withKpnI, HindIII, and ligated into pZE21 to create pAmin100. PCR was then used to obtain thegfpgene (with PLpromoter) using the primer
pairs PL_F and gfp_2_R (Table 3) and pAmin100 as
template. The creation of pAmin81+gfpPLsubsequently
proceeded by performing a three-fragment ligation reac-tion of this fragment digested with AatII, SacI, the ~2.5
kb fragment released from a AvrII, SacI digested
pAmin93, and the ~2 kb fragment released from a AvrII, AatIIdigested pAmin99. The gfpgenetic device
(complete with spacer and terminator) was finally trans-ferred from pAmin81+gfpPLinto thecatdevice (with the
PL promoter) containing series of plasmids described
prior using BamHI, creating the desired series of plas-mids (Figure 3C). Sub-cloning was used in order to arrive at thegfpdevice (with the PL promoter)
contain-ing constructs with the other three origins of replication.
More specifically, the origins released from a AvrII,
SmaI digested pAmin78, pAmin79, and pAmin80 were
ligated into pAmin81+gfpPL to yield pAmin78+gfpPL,
pAmin79+gfpPL, and pAmin80+gfpPL.
Bacterial growth conditions
E. coli DH1 cells were grown overnight at 30°C, 200 rpm shaking after inoculating 5 mL cultures of LB
media (supplemented with 50 μg/mL kanamycin) with
single colonies from freshly streaked plates. After sub-culturing (1:50) into shake flasks containing 50 mL of either M9 minimal or LB media (supplemented with 50
μg/mL kanamycin), cells were grown at 30°C, 200 rpm
shaking until an OD600 nm of 0.3-0.4 was reached to
approximate steady-state conditions. At this time, 1 mL of cells were added to ice chilled tubes with 100 μL of 10% phenol:90% EtOH stop solution [45], mixed, spun down, supernatant removed, and total RNA isolation proceeded immediately thereafter. Another 1 mL of cells were spun down, supernatant removed, and cell pellets subsequently frozen for total DNA isolation at a future date.
Bacterial total RNA isolation to quantifynptII, cat, andgfp expression levels
Bacterial cell pellets were resuspended in 700μL buffer RLT (Qiagen), to which beta-mercaptoethanol had been
added according to the manufacturer’s instructions.
Cells were subsequently lysed using 0.1 mm diameter glass beads in the Mini-Beadbeater-8 (Biospec).
Follow-ing lysis, tube contents were spun down and 500μL of
lysate was transferred to new tubes. Total RNA
extrac-tion then proceeded by adding 500 μL of 25:24:1
phe-nol:chloroform:isoamyl alcohol, vortexing vigorously for ~1 min, allowing the tubes to sit at bench for a few minutes subsequent, and centrifugation for 15 min at
12000 × g, 4°C. Next, 300 μL of the upper aqueous
phase was transferred to a new tube containing 300 μL
nuclease free water. RNA extraction continued by add-ing 600μL of chloroform to each tube, vigorous vortex-ing for ~1 min, allowvortex-ing the tubes to sit at bench for a few minutes subsequent, and centrifugation for 15 min
at 12000 × g, 4°C. Next, 300 μL of the upper aqueous
phase was transferred to a new tube. Following chloro-form extraction, total RNA was ethanol precipitated overnight, washed with 70% ethanol, and finally
concentration and purity were assayed using a Nano-drop spectrophotometer, and integrity examined on 2% agarose gels.
cDNA synthesis and real-time qPCR quantification of cellularnptII, cat, andgfptranscript levels
Total RNA extracted was treated with Turbo DNase (Ambion) to reduce DNA contamination. First-strand cDNA was synthesized by using reverse gene-specific primers (Table 4) and SuperScript III Reverse Transcrip-tase (Invitrogen) following the manufacturer’s instruc-tions. Transcript levels were normalized to that of endogenous 16S rRNA. The primer sets specific to nptII, cat, gfp, and 16S rRNA (Table 4) amplified a sin-gle product of the expected size as confirmed by the melting temperatures of the amplicons. Real-time qPCR was conducted on a BioRad iCycler with 96-well reac-tion blocks in the presence of SYBR Green under the following conditions: 1X iQ SYBR Green Supermix
(BioRad), 150 nM nptII, 300 nM cat, 100 nM gfp, or
500 nM 16S primers in a 25 μL reaction. Real-time
qPCR cycling was 95°C for 3 min, followed by 40 cycles of 30 sec at 95°C, 30 sec at 60°C, and 30 sec at 72°C. Threshold cycles (Ct) were determined with iCycler (BioRad) software for all samples. A standard curve was prepared for quantification. For this purpose, a fourfold dilution series of a total of seven dilutions was prepared from a digested total DNA sample, and each dilution was subjected to qPCR analysis in triplicate with either thenptII-,cat-, gfp-, or 16S-specific primers. Obtained Ct values were used by the iCycler software package to plot a standard curve that allowed quantification of nptII, cat, gfp, or 16S in the total RNA samples (i.e. unknowns) relative to the RNA sample used to prepare the standard curve.
Bacterial total DNA isolation to quantify plasmid copy number
The DNA isolation method reported in the previous publications [24,46] was adopted. Bacterial cell pellets
were resuspended in 400 μL of 50 mM Tris/50 mM
EDTA, pH 8, by vortex. Cell membranes were
permealized by the addition of 8μL of 50 mg/mL
lyso-zyme (Sigma) in 10 mM Tris/1 mM EDTA, pH 8, fol-lowed by incubation at 37°C for 30 min. To complete cell lysis, 4 μL of 10% SDS and 8μL of 20 mg/mL Pro-teinase K solution (Invitrogen) were added to each tube, mixed with a syringe with 21 gauge 1.5 inch needle, and incubated at 50°C for 30 min. Proteinase K was subse-quently heat inactivated at 75°C for 10 min, and RNA
was digested with the addition of 2 μL of 100 mg/mL
RNase A solution (Qiagen) followed by incubation at 37°C for 30 min. Total DNA extraction then proceeded
by adding 425 μL of 25:24:1 phenol:chloroform:isoamyl
alcohol, vortexing vigorously for ~1 min, allowing the tubes to sit at bench for a few minutes subsequent, and centrifugation for 5 min at 12000 × g, 4°C. Next, 300μL of the upper aqueous phase was transferred to a new tube using a wide-opening pipet tip. DNA extraction continued by adding 400μL of chloroform to each tube, vigorous vortexing for ~1 min, allowing the tubes to sit at bench for a few minutes subsequent, and
centrifuga-tion for 5 min at 12000 × g, 4°C. Next, 200 μL of the
upper aqueous phase was transferred to a new tube using a wide-opening pipet tip. Following chloroform extraction, total DNA was ethanol precipitated over-night, washed with 70% ethanol, and finally resuspended in 40μL of nuclease free water. DNA concentration and purity were assayed using a Nanodrop spectrophot-ometer, and integrity examined on 1% agarose gels.
Real-time qPCR quantification of plasmid copy number
Primer sets specific to thenptIIand 16S rDNA genes
were used (Table 4). These primers amplified a single product of the expected size as confirmed by the melting temperatures of the amplicons. ThenptIIgene is a sin-gle-copy gene of the plasmids characterized in this study,
while 16S is a multi-copy gene ofE. colichromosomal
DNA [47] and was used for normalization purposes [24,26]. Total DNA isolated from each strain was first digested overnight using EcoRI (New England Biolabs) at 37°C. Real-time qPCR was conducted on a BioRad iCy-cler with 96-well reaction blocks in the presence of SYBR Green under the following conditions: 1X iQ SYBR
Green Supermix (BioRad), 150 nMnptII, or 500 nM 16S
primers in a 25μL reaction. Real-time qPCR cycling was 95°C for 3 min, followed by 40 cycles of 30 sec at 95°C, 30 sec at 60°C, and 30 sec at 72°C. Threshold cycles (Ct) were determined with iCycler (BioRad) software for all samples. A standard curve was prepared for quantifica-tion. For this purpose, a fourfold dilution series of a total of seven dilutions was prepared from a digested total DNA sample, and each dilution was subjected to qPCR analysis in triplicate with either thenptII- or 16S-specific primers. Obtained Ct values were used by the iCycler software package to plot a standard curve that allowed
Table 4 List of real-time qPCR primers used in this study
Primer Sequence Reference
quantification ofnptIIor 16S in the digested total DNA samples (i.e. unknowns) relative to the DNA sample used to prepare the standard curve.
List of abbreviations used
cat: chloramphenicol acetyl transferase; DTC: device transfer curve;gfp: green fluorescent protein; ppGpp: guanosine tetraphosphate;nptII: neomycin phosphotransferase II; qPCR: quantitative PCR; RBS: ribosome binding site.
Acknowledgements
The authors thank Murali Raghavendra Rao for helpful discussions concerning SAS and regression analysis. This research was supported by a National Science Foundation Graduate Research Fellowship (to MH); the Synthetic Biology Engineering Research Center (SynBERC), through a grant from the National Science Foundation; and the Joint BioEnergy Institute (JBEI), through contract DE-AC02-05CH11231 between Lawrence Berkeley National Laboratory and the U. S. Department of Energy, Office of Science, Office of Biological and Environmental Research.
Author details
1Department of Electrical Engineering and Computer Sciences, University of
California, Berkeley, CA 94720, USA.2Synthetic Biology Engineering Research Center, University of California, Berkeley, CA 94720, USA.3QB3: California
Institute for Quantitative Biological Research, University of California, Berkeley, CA 94720, USA.4Physical Biosciences Division, Lawrence Berkeley
National Laboratory, Berkeley, CA 94720, USA.5Department of
Bioengineering, University of California, Berkeley, CA 94720, USA.
6Department of Chemical and Biomolecular Engineering, University of
California, Berkeley, CA 94720, USA.7Joint BioEnergy Institute, Emeryville, CA 94608, USA.
Authors’contributions
MH conceived the study, designed and performed all experiments, analyzed the data, and wrote the manuscript. PRG contributed in discussing the study, analysis of the experimental results, and edited the manuscript. JDK contributed in the design and coordination of the study, analysis of the experimental results, and edited the manuscript. All authors read and approved the final manuscript.
Competing interests
The authors declare that they have no competing interests with respect to this work. JDK has a financial interest in Amyris and LS9.
Received: 15 October 2010 Accepted: 22 April 2011 Published: 22 April 2011
References
1. Keasling JD:Synthetic biology for synthetic chemistry.ACS Chem Biol 2008,3:64-76.
2. Andrianantoandro E, Basu S, Karig DK, Weiss R:Synthetic biology: new engineering rules for an emerging discipline.Mol Syst Biol2006,2:E1-E14. 3. Endy D:Foundations for engineering biology.Nature2005,438:449-453. 4. Hartwell LH, Hopfield JJ, Leibler S, Murray AW:From molecular to modular
cell biology.Nature1999,402:C47-C52.
5. Registry of Standard Biological Parts.[http://partsregistry.org]. 6. Shetty RP, Endy D, Knight TF Jr:Engineering BioBrick vectors from
BioBrick parts.J Biol Eng2008,2:5.
7. Anderson JC, Dueber JE, Leguia M, Wu GC, Goler JA, Arkin AP, Keasling JD: BglBricks: A flexible standard for biological part assembly.J Biol Eng 2010,4:1.
8. Sauro HM:Modularity defined.Mol Syst Biol2008,4:166.
9. Del Vecchio D, Ninfa AJ, Sontag ED:Modular cell biology: retroactivity and insulation.Mol Syst Biol2008,4:161.
10. Agapakis CM, Silver PA:Modular electron transfer circuits for synthetic biology.Bioengineered Bugs2010,1:6.
11. Arkin A:Setting the standard in synthetic biology.Nat Biotechnol2008, 26:771-774.
12. Canton B, Labno A, Endy D:Refinement and standardization of synthetic biological parts and devices.Nat Biotechnol2008,26:787-793.
13. Benner SA, Sismour AM:Synthetic biology.Nat Genetics2005,6:533-543. 14. Blattner FR, Plunkett G, Bloch CA, Perna NT, Burland V, Riley M,
Collado-Vides J, Glasner JD, Rode CK, Mayhew GF, Gregor J, Davis NW, Kirkpatrick HA, Goeden MA, Rose DJ, Mau B, Shao Y:The complete genome sequence of Escherichia coli K-12.Science1997,277:1453-1462. 15. Lathi BP:Linear systems and signalsCarmichael: Berkeley-Cambridge Press; 1992. 16. Gray PR, Hurst PJ, Lewis SH, Meyer RG:Analysis and design of analog
integrated circuits.4 edition. New York: John Wiley & Sons, Inc; 2001. 17. Rabaey JM, Chandrakasan A, Nicolic B:Digital integrated circuits.2 edition.
New Jersey: Prentice Hall; 2003.
18. Kües U, Stahl U:Replication of plasmids in gram-negative bacteria. Micriobiol Rev1989,53:491-516.
19. Selzer G, Som T, Itoh T, Tomizawa J:The origin of replication of plasmid p15A and comparative studies on the nucleotide sequences around the origin of related plasmids.Cell1983,32:119-129.
20. Scholtissek S, Grosse F:A cloning cartridge of lambda t(o) terminator. Nucleic Acids Res1987,15:3185.
21. Orosz A, Boros I, Venetianer P:Analysis of the complex transcription termination region of the Escherichia coli rrnB gene.Eur J Biochem1991, 201:653-659.
22. Peterson J, Phillips GJ:New pSC101-derivative cloning vectors with elevated copy numbers.Plasmid2008,59:193-201.
23. Chang AC, Cohen SN:Construction and characterization of amplifiable multicopy DNA cloning vehicles derived from the P15A cryptic miniplasmid.J Bacteriol1978,134:1141-1156.
24. Lin-Chao S, Chen WT, Wong TT:High copy number of the pUC plasmid results from a Rom/Rop-suppressible point mutation in RNA II.Mol Microbiol1992,6:3385-3393.
25. Lee CL, Ow DS, Oh SK:Quantitative real-time polymerase chain reaction for determination of plasmid copy number in bacteria.J Microbiol Methods2006,65:258-267.
26. Lee C, Kim J, Shin SG, Hwang S:Absolute and relative QPCR quantification of plasmid copy number in Escherichia coli.J Biotechnol 2006,123:273-280.
27. Tao L, Jackson RE, Cheng Q:Directed evolution of copy number of a broad host range plasmid for metabolic engineering.Metab Eng2005, 7:10-17.
28. Bustin SA:Absolute quantification of mRNA using real-time reverse transcription polymerase chain reaction assays.J Mol Endocrinol2000, 25:169-193.
29. Giulietti A, Overbergh L, Valckx D, Decallonne B, Bouillon R, Mathieu C:An overview of real-time quantitative PCR: applications to quantify cytokine gene expression.Methods2001,25:386-401.
30. Wong ML, Medrano JF:Real-time PCR for mRNA quantification. Biotechniques2005,39:75-85.
31. Alper H, Fischer C, Nevoigt E, Stephanopoulos G:Tuning genetic control through promoter engineering.Proc Natl Acad Sci USA2005,102:12678-12683. 32. Grabherr R, Bayer K:Impact of targeted vector design on ColE1 plasmid
replication.Trends Biotechnol2002,20:257-260.
33. Weigandt TC:Low-phase-noise, low-timing-jitter design techniques for delay cell based VCOs and frequency synthesizers.Ph.D. thesisUniversity of California, Berkeley, Electrical Engineering Department; 1998.
34. Robbins KR, Saxton AM, Southern LL:Estimation of nutrient requirements using broken-line regression analysis.J Anim Sci2006,84:E155-E165. 35. Bailey JE, Ollis DF:Biochemical engineering fundamentals.2 edition. New
York: McGraw-Hill; 1986.
36. Vogel U, Jensen KF:Effects of guanosine 3’,5’-bisdiphosphate (ppGpp) on rate of transcription elongation in isoleucine-starved Escherichia coli.J Biol Chem1994,269:16236-16241.
37. Krohn M, Wagner R:Transcriptional pausing of RNA polymerase in the presence of guanosine tetraphosphate depends on the promoter and gene sequence.J Biol Chem1996,271:23884-23894.
38. Proshkin S, Rahmouni AR, Mironov A, Nudler E:Cooperation between translating ribosomes and RNA polymerase in transcription elongation. Science2010,328:504-508.
39. Burmann BM, Schweimer K, Luo X, Wahl MC, Stitt BL, Gottesman ME, Rösch P:A NusE:NusG complex links transcription and translation.Science 2010,328:501-504.
41. Sambrook J, Fritsch EF, Maniatis T:Molecular cloning: a laboratory manual.2 edition. New York: Cold Spring Harbor Laboratory Press; 1989.
42. Neidhardt FC, Bloch PL, Smith DF:Culture medium for enterobacteria.J Bacteriol1974,119:736-747.
43. Smolke CD, Carrier TA, Keasling JD:Coordinated, differential expression of two genes through directed mRNA cleavage and stabilization by secondary structures.Appl Environ Microbiol2000,66:5399-5405. 44. Lutz R, Bujard H:Independent and tight regulation of transcriptional
units in Escherichia coli via the LacR/O, the TetR/O and AraC/I1-I2 regulatory elements.Nucleic Acids Res1997,25:1203-1210.
45. Bernstein JA, Khodursky AB, Lin PH, Lin-Chao S, Cohen SN:Global analysis of mRNA decay and abundance in Escherichia coli at single-gene resolution using two-color fluorescent DNA microarrays.Proc Natl Acad Sci USA2002,99:9697-9702.
46. Pushnova EA, Geier M, Zhu YS:An easy and accurate agarose gel assay for quantification of bacterial plasmid copy numbers.Anal Biochem2000, 284:70-76.
47. Lee C, Lee S, Shin SG, Hwang S:Real-time PCR determination of rRNA gene copy number: absolute and relative quantification assays with Escherichia coli.Appl Microbiol Biotechnol2008,78:371-376. 48. Mason G, Provero P, Vaira AM, Accotto GP:Estimating the number of
integrations in transformed plants by quantitative real-time PCR.BMC Biotechnol2002,2:20.
49. Olivares EC, Hollis RP, Chalberg TW, Meuse L, Kay MA, Calos MP: Site-specific genomic integration produces therapeutic Factor IX levels in mice.Nat Biotechnol2002,20:1124-1128.
doi:10.1186/1754-1611-5-3
Cite this article as:Hajimoradet al.:A framework and model system to investigate linear system behavior inEscherichia coli.Journal of Biological Engineering20115:3.
Submit your next manuscript to BioMed Central and take full advantage of:
• Convenient online submission
• Thorough peer review
• No space constraints or color figure charges
• Immediate publication on acceptance
• Inclusion in PubMed, CAS, Scopus and Google Scholar
• Research which is freely available for redistribution Submit your manuscript at