Research Article
Identification of microsatellite markers linked to drought tolerance in rice
(Oryza sativa L.) through bulked line analysis
N. S. Rajendra Prasad1, R. Suresh*2, S. Michael Gomez3, R. Chandra Babu1 andP. Shanmugasundaram4
1
Department of Plant Molecular Biology and Biotechnology, Centre for Plant Molecular Biology, Tamil Nadu Agricultural University, Coimbatore - 641 003, India
2
Tamil Nadu Rice Research Institute, Tamil Nadu Agricultural University, Aduthurai – 612 101, India
3
Biotehnology Unit, Agrobiodiversity Research Area, CIAT, KM17 Rectacali, Palmira, Cali, Colombia
4
Centre for Plant Breeding and Gentics, Tamil Nadu Agricultural University, Coimbatore – 641 003
E-mail: [email protected]
(Received: 28 Mar 2014; Accepted: 13 Nov 2016)
Abstract
Identification of donor parents and markers for traits conferring drought tolerance eventually hastens the breeding for drought tolerance in rice. The extent of variation for water stress indicators, physio-morphological and plant production traits were assessed by evaluating 36 rice genotypes under water stress condition. Significant variation was observed for these traits and thirteen drought tolerant and susceptible genotypes were selected and grouped as tolerant and susceptible bulks based on physio-morphological and biochemical characterization. Genomic DNA was isolated from these rice accessions and pooled, respectively into drought tolerant and susceptible bulks. Bulked line analysis was carried to identify microsatellite markers linked to drought tolerance in rice. Out of 200 SSR primers screened RM 1092; RM 129 and RM157B were polymorphic between the bulks and also co-segregated among the individual genotypes constituting the respective bulks. The genomic regions flanked by these markers have been identified to be associated with various drought tolerance traits in rice and can be useful for marker assisted selection for drought resistance improvement in rice. The genotypes identified as drought tolerant can be used us donars in drought improvement breeding programmes.
Key words
Rice, drought resistance, microsatellite markers, bulk line analysis
Introduction
Rice provides nutrition for more people in the world than any other crop (Phillips et al., 2005), especially in Asia, Africa and Latin America and grown world over on 154 million hectares annually under diverse hydrological conditions. Of which, about 28 per cent is grown in rainfed lowlands and about 13 per cent under upland condition (Singh, 2009:www.niaes.affrc.go.jp/marco/marco2009/eng lish/W2-_Singh_P.pdf). These areas experience water deficit due to uncertain and uneven rainfall and yields are seriously affected due to drought. The frequent occurrence of abiotic stresses such as drought and submergence has been identified as the key to the low productivity of rainfed ecosystems. A recent estimate on climate change predicts the water deficit to deteriorate further in years to come and the intensity and frequency of drought are predicted to become worse (Wassmann
et al., 2009). From the beginning of the Green Revolution era in rice in 1960’s till 2013, on 15 occasions, rice production in India failed to achieve the estimated production, drought was the cause of reduced production on 12 such occasions. Severe drought in the wet season during the reproductive stage adversely effect on rice production. Three most recent severe droughts in 2002, 2009 (http://www.dacnet.nic.in) and 2012 witnessed a significant reduction in rice as well as total food production in India.
Considering the frequent occurrence of drought, development of cultivars with inbuilt drought
resistance will increase rainfed rice production. However, the progress in breeding for drought resistance is limited because of the low heritability of yield under stress, the complexity of the traits governing drought tolerance and difficulty to screen large germplasm precisely for drought resistance. Molecular markers have the potential to dissect quantitative traits into their single genetic components. Through marker-assisted breeding (MAB) it also assists the selection and pyramiding of the beneficial QTL alleles (Altinkut and Gozukirmizi, 2003). Identification of DNA markers associated with drought tolerance is usually carried out with large mapping populations, where each progeny of the population is genotyped. This is highly demanding in resource, time and often costly. Several strategies have been reported to reduce the number of plants to be genotyped. Bulked segregant analysis (BSA) is one such strategy for identifying DNA markers linked to the trait of interest against a randomized genetic background of unlinked loci (Michelmore
et al., 1991).
phenotype can be used instead, identification of DNA markers associated with a target trait will be more flexible (Lawson et al., 1994). Use of bulked line analysis (BLA) by pooling DNAs of genotypes from diverse genetic backgrounds but sharing similar phenotypes (eg. drought tolerance or susceptible) will lead to rapid identification of DNA markers associated with drought tolerance. One requirement of the BLA method is that the bulked lines should have the same target phenotype but vary over non-target phenotypes. The origin of the target gene in bulked lines should be the same for the BLA method to be effective (Tan et al., 1998).
Thus the objectives of this study were to assess the extent of variation in drought response among rice accessions under field conditions and to identify microsatellite markers linked to drought resistance using a method called “bulked line analysis” (BLA).
Materials and methods
Field trial: The rice accessions used in the present study includes landraces and improved cultivars from different locations, known for their varied hydrological habitat (Table 1). Field trial was conducted under upland condition in the experimental fields of Tamil Nadu Agricultural University, Coimbatore, India. Rice accessions were evaluated under water stress and non-stress conditions in a randomized block design with replications. The experimental plot size was 2.0 x 0.2 m2 with 20 x 10 cm spacing between and within rows, respectively. Seeds were hand dibbled into dry soil and required agronomic practices were followed to maintain healthy crop stand. All the plots were surface irrigated to field capacity once in a week, until water stress was imposed by withholding irrigation to stress plots beginning 87th day after sowing (DAS).
Field measurements: During the initial 14 days of stress period, there were intermittent rains and after that there was 22 continuous rain free days. Changes in soil moisture were monitored periodically in stress plots using a Thetaprobe. Relative water content (RWC) (Barrs and Weatherly, 1962) and chlorophyll meter reading (model SPAD-502) (Monje and Bugbee, 1992) were taken 15 days after last rain fall. Leaf rolling and drying scores were recorded at noon, 16 days after last rainfall during the stress using 1 to 7 scales standardized for rice (IRRI, 1996). Canopy temperature was measured 17 days after last rainfall. Leaf samples for estimation of chlorophyll stability index (Murthy and Majumdar, 1962), cell membrane stability index (Blum and Eberocon, 1981) and proline content(Bates et al., 1973) were taken 17 days after rainfall. Stress was relieved on 37th day by irrigating the plots to field capacity and recovery score was recorded 3 days after irrigation.
Following this, both control and stress plots were regularly irrigated until harvest. The plants were harvested 128 DAS and total above ground biomass was recorded.
DNA extraction, pooling of DNA samples and microsatellite marker analysis: Thirteen drought tolerant and thirteen susceptible rice genotypes were selected based on various physio-morphological traits under water stress. Genomic DNA from these rice accessions was extracted using the method described by Gawel and Jarret (1991). The quantity of DNA present in each sample was determined by reading the absorbance at 260 nm in a Hoefer Dyna Quant 2000 fluorometer. To assess the quality, agarose gel electrophoresis was done with 1L of crude DNA sample on (0.8 %) agarose gel and stained with ethidium bromide. Fifteen nanograms µL-1 of diluted DNA each from thirteen drought tolerant and thirteen susceptible rice genotypes were taken and pooled into drought tolerant and drought susceptible bulks, respectively. The bulked DNA samples were screened using 200 SSR primers. Putative polymorphic markers between the bulks were checked for co-segregation among individual genotypes constituting the tolerant and susceptible bulks.PCR reactions were performed in a volume of 15µL reaction mixture in a thermal cycler (PTC-100TM, MJ Research Inc.). The reaction mixture contained each primer at 200µM, dNTPs (2.5 mM), Assay Buffer (10x), Taq DNA polymerase (3 units/L) and template DNA 15 ng/l and the PCR reaction was programmed for 35 cycles as follows, initial denaturation (95˚C for 5 minutes), denaturation (94˚C for 45 seconds), annealing (55˚C for 45 seconds), extension (72˚C for 1 minute), final extension (72˚C for 5 minutes). An aliquot of 3 L of DNA (from each PCR reaction) and 2 L of loading dye (98% Formamide, 10Mm Ethylenediamine Tetraacetate (EDTA), Bromophenol blue, Xylene cyanol), were taken for sample preparation, denatured at 95C for 5 minutes and separated on 5% polyacrylamide gel (acrylamide:bisacrylamide at19:1), at 1750V for 3h in 1x Borate-EDTA (TBE) buffer (0.09M Tris-Borate and 0.002 EDTA). Amplification products were detected by silver staining and band sizes were determined by comparison with a 100-bp DNA ladder size standard from Gene craft, Germany. The bands developed were scored as polymorphic or monomorphic between the two bulks.
Results and discussion
condition. Plant height ranged from 25.50 cm to 81.62 cm with an average of 50.50 cm (Table 2). Water stress adversely affected the growth of the susceptible genoypes which in turn leads to reduction in plant height. The growth of the genotypes was comparable and normal until water stress was imposed, upon stress the susceptible genotypes remain stunted and failed to grow further. Likewise, tillering ability of the tolerant genotypes were profuse in comparison with lanky tillers in susceptible genotypes. Effect of water stress on plant growth and development has been documented in rice in different mapping populations and also in different rice lines (Steel et al., 2013 and Manikanda Boopathi et al., 2013). Leaf rolling score ranged from 1.6 to 7.0 with a mean of 4.6 amongst the genotypes. The genotypes identified for tolerant bulks remained turgid for longer time, which may be due to deep rooting ability of these genotypes. Similar trend for leaf rolling was reported in rice in various populations (Zhang et al., 2001). Correlation among physio-morphological and drought responsive traits under stress reveals that parameters of water stress indicators were correlated morphological traits under stress (data not shown). Gomez et al. 2006 reported relationships among physio-morphological and drought responsive traits under water stress condition. In this study most of the genotypes identified as drought tolerant were
indica land races except TRY-2, PMK-3 and PY-3 growing in different agro-ecological conditions and belong to subspecies indica. Lilley and Ludlow (1996) reported that indica cultivars tend to be dehydration tolerant, desiccating at a low water potential than their japonica counter parts. Drought tolerant and susceptible rice genotypes were selected on the basis of physio-morphological and biochemical traits such as plant height, number of tillers, SPAD chlorophyll value, leaf rolling, leaf drying, drought recovery, relative biomass, relative water content, proline content , chlorophyll stability index and cell membrane stability index under water stress condition. Detailed analysis of these traits enabled to identify thirteen drought tolerant and thirteen drought susceptible genotypes for BLA. The genotypes with extreme values on either side of the grand mean were grouped and bulked as either tolerant or susceptible bulks. The genotypes which had nearer value on either side of the grand mean were omitted and were not considered for bulking in order to have two very distinct bulks amongst the genotypes and to avoid the overlapping of genotypes between the bulks. Therefore, the genotypes which scored high values in all traits and low scores for leaf rolling and drying were considered for the tolerant bulk and those scored lower or negative in all parameters and high scores for leaf rolling and drying were used to form the susceptible bulk.
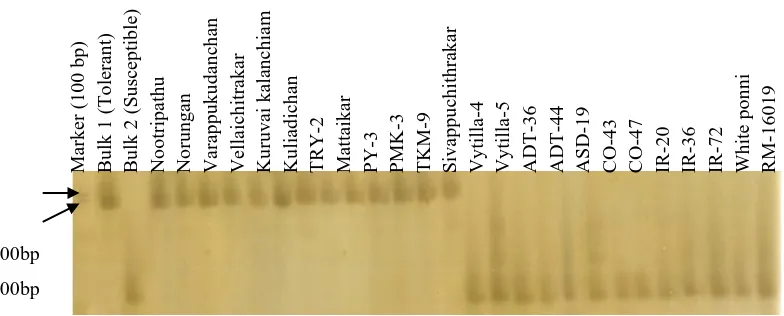
A total of 200 microsatellite primers (Research Genetics Inc., USA) representing different chromosomes of rice were selected randomly and used to amplify the SSR regions among the bulked DNA samples. Polyacrylamide gel electrophoresis was done with amplified products and was silver stained and appropriate scoring was done. Three primers such as RM1092, RM129 and RM157B were polymorphic between the bulks (Fig. 1 and 2) and were found to be putative markers. The primers showing polymorphism between the two bulks were checked in all 26 (13+13) individual rice genotypes along with the bulks, and perfect co-segregation was observed. These three primers cosegregated between the bulks and among genotypes. All the thirteen genotypes, which were considered as drought tolerant, produced similar banding pattern as produced in tolerant bulk, and this banding pattern was different from the susceptible bulk and susceptible genotypes. Although Near isogenic lines and BSA are effective for the identification of the DNA markers associated with target genes, the BLA method allows the genetic stock to be prepared more quickly. In addition, as the BLA method is not based on a segregating population, this method can be useful for asexually propagating organisms where generation of a segregating population is difficult due to various reasons. Although the BLA method cannot be used directly to localize genes, it is useful for the identification of DNA markers that are associated with the target gene and thereby saturating the genomic region of interest. Through such markers, the linked traits can be precisely localized if the markers used have been previously mapped. In this study, the markers deployed were found to be present on the flanking region of previously mapped chromosome region on rice genetic linkage maps for traits associated with drought tolerance. Therefore, the drought linked traits can be localized by the BLA method (Tan et al., 1998).
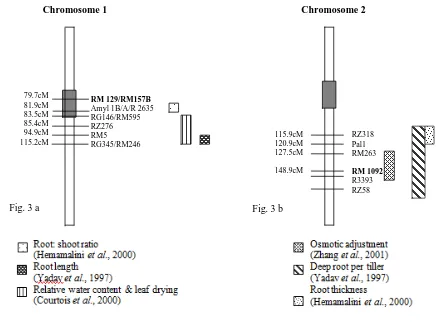
DH population. In this study RM1092 is located on rice chromosome 2 (Fig. 3b) between RZ318 and RZ58 markers and this region was reported to be associated with traits viz. total root number, maximum root length, root thickness, and deep root per shoot ratio in different mapping population (Hemamalini et al., 2000 and Yadav et al., 1997). Interestingly QTLs for osmotic adjustment were also found in this region in CT9993/ IR62266 double haploid population under drought stress (Zhang et al., 2001).
Conclusion
In summary, the rice genotypes evaluated under water stress showed significant variation for physio-morphological and plant production traits. Some of the lines identified as drought tolerant can be used as donors to improve drought tolerance in rice. From the bulked line analysis microsatellite markers such as RM1092, RM129 & RM157B were found to be associated with the regions mapped for various drought tolerant traits. The markers RM129 & RM157B were ~ 2cM away from the root QTLs and these markers may be useful in marker assisted selection for drought tolerance in rice.
Acknowledgement
Financial support from The Rockefeller Foundation, USA for this research is gratefully acknowledged.
References
Anderson Altinkut, A., and Gozukirmizi, N. 2003. Search for microsatellites associated with water stress tolerance in wheat through bulked segregant analysis. Mol Biotech., 23: 97-106.
Barrs, H.D., and Weatherley, P.E. 1962. A re-examination of the relative turgidity technique for estimating water deficits in leaves. Aust. Biol. Sci.,15: 413-128. Bates, L.S., Waldren, I.D., and Teare, R.P. 1973.
Rapid determination of free proline for water stress studies. Plant soil,39: 205-207. Blum, A., and Eberocon, A. 1981. Cell membrane stability as a measure of drought and heat tolerance in wheat. Crop Sci.,21: 43-47. Courtois, B., McLaren, G., Sinha, P., Prasad, K.,
Yadav, R., and Shen, L. 2000. Mapping QTL associated with drought avoidance in upland rice. Mol. Breed.,6: 55-66.
Gawel, N., and Jarret, R.L. 1991. A modified CTAB DNA extraction procedure for Musa and Ipomoea plant. Mol. Biol. Rep.,9: 262-266.
Hemamalini, G.S., Sashidhar, H.E., and Hittalmani, S. 2000. Molecular marker assisted tagging of morphological and physiological traits under two contrasting moisture regimes at peak vegetative stage in rice (Oryza sativa L.). Euphytica, 112: 1-10.
IRRI. 1996. International network for genetic evaluation of rice: Standard evaluation system for rice. International Rice research Institute, Los Banos, Philippines.
Lawson, W.R., Henry, R.J., Kochman, J.K., and Kong, G.A. 1994. Genetic diversity in Sunflower (Helianthus annus. L) as revealed by random amplified polymorphic DNA analysis. Aust. J. Agric. Res.,45 :1319-1327.
Lilley, J.M., and Ludlow, M.M. 1996. Expression of osmotic adjustment and dehydration tolerance in diverse rice lines. Field Crops Res., 48: 185-197.
Manikanda Boopathi, N., Swapnashri, G., Kavith, P., Sathish, S., Nithya, R., Wickneswari, R., and Arvind Kumar. 2013. Evaluation and bulked segregant analysis of major yield QTL qtl12.1 introgressed into indigenous elite line for low water availability under water stress. Rice Sci.,20(1): 25-30
Michael Gomez, S., Satheesh Kumar, S., Jeyaprakash, P., Suresh, R., Biji K.R., Manikanda Boopathi, N., Price, A.H., and Chandra Babu, R. 2006. Mapping QTLs Linked to Physio-Morphological and Plant Production Traits under Drought Stress in Rice (Oryza sativa L.) in the Target Environment. American J. Biochem. Biotech., 2(4): 161-169.
Monje, O.A., and Bugbee. 1992. Inherent limitation of non destructive chlorophyll meter, a comparison of two types of meters.
Hort. Sci., 27: 71-89.
Murthy, K.S., and Majumdar, S.K. 1962. Modifications of the techniques for determination of chlorophyll stability index in relation to studies of drought resistance in rice. Curr. Sci.,31: 470-471.
Phillips, R.L., Odland, W.E., and Kahler, A.L. 2005. Rice as a reference genome and more pp. 3-15, In: D.S. Brar, D. J. Mackill and B. Hardy, (eds.) Rice Genetics V: Proceedings of the Fifth International Rice Genetics Symposium, 19-23 November 2005, The Philippines.
Sweeney, P.M., and Danneberger, T.K. 1994. Random amplified polymorphic DNA in perennial ryegrass: a comparison of bulk samples vs individuals. Hort. Sci., 29 :624-626.
Steele, K.A., Price, A.H., Witcombe, J.R., Roshi Shrestha, Singh, B.N., Gibbons, J.M., and Virk, D.S. 2013. QTLs associated with root traits increase yield in upland rice when transferred through marker-assisted selection. Theor. Appl. Genet.,126:101-108. Tan, X.L., Vanavichit, A., Amornsipla, S., and Trangoonrung, S. 1998 Mapping of rice Rf
Temnykh, S., DeClerk, G., Lukashova, A., Lipovich, L., Cartinhour. S., and McCouch, S. R. 2001. Computational and experimental analysis of microsatellites in rice (Oryza sativa): frequency, length variation, transposon associations and genetic marker potential. Genome Res.,11: 1441-1452. Wassmann, R., Jagadish, S.V.K., Sumfleth, K.,
Pathak, H., Howell, G., Ismail, A., Serraj, R, Redona, E., Singh, R.K., and Heuer, S. 2009. Regional vulnerability of climate change impacts on Asian rice production and scope for adaptation. Advances in Agro.,102: 91-133.
Yadav, R., Courtois, B., Huang, N., and Mclaren, G. 1997 Mapping genes controlling root morphology and root distribution in a doubled-haploid population of rice. Theor Appl Genet., 94: 619-632.
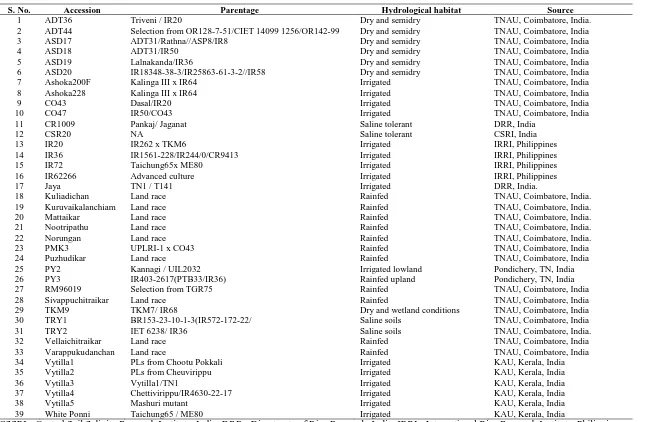
Table 1. Details of rice accessions used in the study
S. No. Accession Parentage Hydrological habitat Source
1 ADT36 Triveni / IR20 Dry and semidry TNAU, Coimbatore, India.
2 ADT44 Selection from OR128-7-51/CIET 14099 1256/OR142-99 Dry and semidry TNAU, Coimbatore, India
3 ASD17 ADT31/Rathna//ASP8/IR8 Dry and semidry TNAU, Coimbatore, India
4 ASD18 ADT31/IR50 Dry and semidry TNAU, Coimbatore, India
5 ASD19 Lalnakanda/IR36 Dry and semidry TNAU, Coimbatore, India
6 ASD20 IR18348-38-3/IR25863-61-3-2//IR58 Dry and semidry TNAU, Coimbatore, India
7 Ashoka200F Kalinga III x IR64 Irrigated TNAU, Coimbatore, India
8 Ashoka228 Kalinga III x IR64 Irrigated TNAU, Coimbatore, India
9 CO43 Dasal/IR20 Irrigated TNAU, Coimbatore, India
10 CO47 IR50/CO43 Irrigated TNAU, Coimbatore, India
11 CR1009 Pankaj/ Jaganat Saline tolerant DRR, India
12 CSR20 NA Saline tolerant CSRI, India
13 IR20 IR262 x TKM6 Irrigated IRRI, Philippines
14 IR36 IR1561-228/IR244/0/CR9413 Irrigated IRRI, Philippines
15 IR72 Taichung65x ME80 Irrigated IRRI, Philippines
16 IR62266 Advanced culture Irrigated IRRI, Philippines
17 Jaya TN1 / T141 Irrigated DRR, India.
18 Kuliadichan Land race Rainfed TNAU, Coimbatore, India.
19 Kuruvaikalanchiam Land race Rainfed TNAU, Coimbatore, India.
20 Mattaikar Land race Rainfed TNAU, Coimbatore, India.
21 Nootripathu Land race Rainfed TNAU, Coimbatore, India.
22 Norungan Land race Rainfed TNAU, Coimbatore, India.
23 PMK3 UPLRI-1 x CO43 Rainfed TNAU, Coimbatore, India
24 Puzhudikar Land race Rainfed TNAU, Coimbatore, India
25 PY2 Kannagi / UIL2032 Irrigated lowland Pondichery, TN, India
26 PY3 IR403-2617(PTB33/IR36) Rainfed upland Pondichery, TN, India
27 RM96019 Selection from TGR75 Rainfed TNAU, Coimbatore, India
28 Sivappuchitraikar Land race Rainfed TNAU, Coimbatore, India
29 TKM9 TKM7/ IR68 Dry and wetland conditions TNAU, Coimbatore, India
30 TRY1 BR153-23-10-1-3(IR572-172-22/ Saline soils TNAU, Coimbatore, India
31 TRY2 IET 6238/ IR36 Saline soils TNAU, Coimbatore, India.
32 Vellaichitraikar Land race Rainfed TNAU, Coimbatore, India
33 Varappukudanchan Land race Rainfed TNAU, Coimbatore, India
34 Vytilla1 PLs from Chootu Pokkali Irrigated KAU, Kerala, India
35 Vytilla2 PLs from Cheuvirippu Irrigated KAU, Kerala, India
36 Vytilla3 Vytilla1/TN1 Irrigated KAU, Kerala, India
37 Vytilla4 Chettivirippu/IR4630-22-17 Irrigated KAU, Kerala, India
38 Vytilla5 Mashuri mutant Irrigated KAU, Kerala, India
39 White Ponni Taichung65 / ME80 Irrigated KAU, Kerala, India
Table 2. Mean variation in physio-morphological traits under water stress among 36 genotypes of rice
S. No. Accessions PH (cm) NT CHL LR LD DR RBM RWC
(%)
PROL
(μg/g) CSI (%) CMS (%)
1 ADT36 29.28 4.50 32.90 5.0 3.6 6 0.35 35.53 1.06 72.02 98.85
2 ADT44 36.83 4.50 32.20 5.6 4.3 4 0.63 39.94 0.43 71.10 83.70
3 ASD17 67.43 5.83 32.5 4.3 2.3 7 0.95 47.16 0.56 91.44 93.78
4 ASD18 33.38 6.83 32.00 4.3 3.6 4 0.24 64.50 0.42 82.37 82.22
5 ASD19 29.05 4.67 31.40 7.0 7.0 2 0.63 30.50 0.16 83.38 83.25
6 ASD20 37.27 6.33 32.60 7.0 7.0 4 0.84 62.50 0.37 73.33 82.16
7 Ashoka200F 45.27 4.00 00.00 7.0 7.0 7 0.77 25.88 ME ME ME
8 Ashoka228 56.22 6.00 00.00 7.0 7.0 7 0.83 39.24 ME ME ME
9 CO43 36.30 5.83 31.60 5.6 5.6 2 0.54 54.99 0.34 76.62 83.44
10 CO47 30.92 5.17 32.50 6.3 6.3 5 0.43 37.85 0.15 77.49 84.68
11 CR1009 28.77 7.00 32.10 4.3 3.6 3 0.69 70.34 0.13 84.12 83.40
12 CSR20 25.50 5.83 32.50 2.3 1.6 1 0.63 57.39 0.18 98.68 80.58
13 IR20 30.88 5.67 31.40 5.0 4.3 2 0.64 54.75 0.14 84.66 84.14
14 IR36 29.22 5.33 32.70 5.6 3.6 5 0.61 42.69 0.19 83.82 89.90
15 IR72 33.13 3.50 31.90 5.0 5.0 4 0.79 63.18 0.02 81.89 88.48
16 IR62266 29.63 7.50 31.30 6.3 6.3 7 0.24 31.68 1.85 848.08 81.37
17 Jaya 31.93 8.67 32.00 1.6 1.6 2 0.39 62.15 0.29 82.57 84.07
18 Kuliadichan 71.22 10.5 38.10 3.0 3.0 1 0.86 74.49 1.71 96.14 99.83
19 KuruvaiKalanchiam 77.15 8.17 38.00 3.0 1.0 3 0.77 59.48 1.81 93.25 97.30
20 Mattaikar 73.58 8.33 36.70 2.3 2.3 2 0.83 65.90 1.10 93.18 92.22
21 Nootripathu 78.10 7.67 38.00 4.3 2.3 5 0.83 60.67 1.27 86.52 98.93
22 Norungan 81.62 7.50 36.00 3.0 1.6 4 0.84 66.93 1.51 87.36 96.06
23 PMK3 65.92 7.33 37.90 4.3 2.3 6 0.84 71.97 1.48 91.06 91.07
24 Puzhudikar 61.17 10.67 36.70 2.3 1.6 1 0.79 59.37 1.40 91.14 95.76
25 PY2 59.88 8.50 33.00 3.6 3.0 1 0.46 53.45 1.28 82.24 80.72
26 PY3 65.18 10.83 33.80 3.0 3.0 3 0.68 57.25 0.11 80.10 95.41
27 RM96019 42.67 4.67 30.50 5.6 3.6 5 0.20 52.42 0.15 72.94 84.76
28 Sivappuchitraikar 77.27 8.50 36.50 3.0 1.6 2 0.87 65.84 1.70 88.36 88.03
29 TKM9 61.35 6.83 35.80 3.0 1.6 1 0.73 75.91 0.37 76.62 81.61
30 TRY1 34.75 5.83 31.50 6.3 6.3 7 0.47 40.95 1.33 77.85 83.06
31 TRY2 65.40 8.33. 36.10 4.3 4.3 1 0.49 62.75 1.60 87.84 87.53
32 Vellaichitraikar 80.02 8.33 34.20 3.6 3.0 3 0.81 67.02 1.46 94.76 89.08
33 Varappukudanchan 77.13 8.00 34.20 3.6 2.3 3 0.92 68.58 1.07 87.93 89.83
34 Vytilla1 45.95 5.33 32.50 5.6 5.6 3 0.61 57.15 0.42 81.29 84.16
35 Vytilla2 46.28 3.50 30.00 5.6 3.6 6 0.62 45.75 0.15 78.61 84.80
36 Vytilla3 42.42 3.00 32.10 7.0 5.0 4 0.64 46.44 0.10 74.81 80.00
PH = Plant height, CHL = Chlorophyll content, NT = Number of tillers, RBM = Relative biomass, RWC = Relative water content, LD = Leaf drying, LR = leaf rolling, PROL = Proline content, DR = Drought recovery, CSI = Chlorophyll stability index, CMS = Cell membrane stability index, ME = matured early before
Fig. 1. SSR profile of bulks and individuals using primer RM1092 Ma rk er ( 1 0 0 b p ) B u lk 1 ( T o ler an t) B u lk 2 ( Su sce p tib le) No o tr ip ath u No ru n g an Var ap p u k u d an ch an Vellaic h itra k ar Ku ru v ai k ala n ch iam Ku liad ich an T R Y -2 Ma ttaik ar PY -3 PMK -3 T KM -9 Siv ap p u ch ith ra k ar Vy till a-4 Vy till a-5 ADT -36 ADT -44 ASD -19 CO -43 CO -47 IR -20 IR -36 IR -72 W h ite p o n n i RM -16019 9 300bp 200bp 100bp Ma rk er ( 1 0 0 b p ) B u lk 1 ( T o ler an t) B u lk 2 ( Su sce p tib le) No o tr ip ath u No ru n g an Var ap p u k u d an ch an Vellaic h itra k ar Ku ru v ai k ala n ch iam Ku liad ich an T R Y -2 Ma ttaik ar PY -3 PMK -3 T KM -9 Siv ap p u ch ith ra k ar Vy ti lla -4 Vy till a-5 ADT -36 ADT -44 ASD -19 CO -43 CO -47 IR -20 IR -36 IR -72 W h ite p o n n i RM -16019 9 300bp 200bp
Fig. 3. The genomic regions of rice chromosomes 1 and 2 (Fig. 3a and 3b) showing identified microsatellite markers (in bold) and QTLs for different drought resistance traits across genetic back grounds in rice. The markers were aligned based on the linkage map of Temnykh et al., (2001)
RM 129/RM157B Amyl 1B/A/R 2635 RG146/RM595 RZ276 RM5 RG345/RM246 79.7cM
81.9cM 83.5cM 85.4cM 94.9cM 115.2cM
Chromosome 1
115.9cM 120.9cM 127.5cM
148.9cM
RZ318 Pal1 RM263
RM 1092 R3393 RZ58 Chromosome 2