TRANS Asian Research Journals
http://www.tarj.in 31
ASSESSING SINGLE AUTHOR’S RESEARCH CONTRIBUTIONS IN
ARTIFICIAL INTELLIGENCE: A COMPREHENSIVE ANALYSIS
Dr. Saravanan. T*
*Assistant Professor,
Department of Library & Information Science, Annamalai University,
Tamilnadu, India.
ABSTRACT
The aim of the present study is to measure the single author’s journal articles contributions on Artificial Intelligence for the selected countries namely USA, UK, Germany and Japan. The period of coverage is 4 years spanning between
2003-2006. The analysis method referred as “relative to an identified distribution1” has
been adopted to carry out the present study. Analysis helps to measure the significance of differences among the groups. The year wise comparisons also have been made to capture the single author research output on the same discipline. Study has been focused on single author contribution on AI towards journal sources only and didn’t cover any other joint authors and other sources.
KEYWORDS: Computer Science; Artificial Intelligence; journals; single author; USA; UK; Germany; Japan.
_____________________________________________________________________________ INTRODUCTION
TRANS Asian Research Journals
http://www.tarj.in 32
LITERATURE REVIEW
Virgo applied correlation procedures to compare a group of expert’s judgements of a number of articles with the frequency with which the same article was cited. Schubert et al used Regression model to perform analysis between stated research quality and citation counts. Jeppe Nicolaisen applied chi-square model to trace the relationship between peer evaluations reflected in scholarly book reviews and citation frequencies of reviewed books.
OBJECTIVES
The aim of this study is to measure the single author’s contributions on Artificial Intelligence towards Journal Sources for the selected countries during the period 2003 -2006. They are;
1. To trace single author’s journal articles contributions in Artificial Intelligence for the specific periods towards the countries namely USA, UK, Germany and Japan.
2. To trace and compare the means of single author’s research contributions in Artificial Intelligence between the identified years.
HYPOTHESES
The study encompasses enough hypotheses in order to complete the assigned task. They are; H1 -Single author’s research contributions in Artificial Intelligence during the selected years follow a normal distribution.
H2 -There would be no statistically significant differences among the single author’s research contributions between the countries and years.
H3 -There would be no statistically significant differences between the single author’s research contributions with respect to pair wise comparisons for the period 2003 vs. 2004, 2005 & 2006. H4 - There would be no statistically significant differences between the single author’s research contributions with respect to pair wise comparisons for the period 2004 vs. 2003, 2005 & 2006. H5 - There would be no statistically significant differences between the single author’s research contributions with respect to pair wise comparisons for the period 2005 vs. 2003, 2004 & 2006. H6 - There would be no statistically significant differences between the single author’s research contributions with respect to pair wise comparisons for the period 2006 vs. 2003, 2004 & 2005. EDGE
TRANS Asian Research Journals
http://www.tarj.in 33
Study encompasses the single author’s research output from the Journals only during the period 2003-2006 and didn’t include other years, documents and countries.
EXPERIMENTAL DESIGN
To test the significance between groups of years and the selected countries the analysis namely “Relative to an identified distribution” has been adopted. This analysis was proposed by Bross4 and briefed by William G Miller5 in OpenStat©. The analysis begins with the identification of a population to serve as a standard or reference group. For the reference group, we estimate that the proportion of all cases with a value on the underlying continuum is falling at or below the midpoint of each interval, that is, each interval's relative to an identified distribution. The final values are the relative to an identified distribution associated with the various categories. The relative to an identified distribution for a category, then, is nothing but the proportion of all subjects from the reference group falling in the lower ranking categories, plus half the proportion falling in the given category. Given the distribution of any other group over the same categories, the mean relative to an identified distribution for that group may be calculated. The resulting mean value is interpretable as a probability. The mean relative to an identified distribution for a group is the probability that a randomly-selected case from it will get better score than a randomly-selected case from the standard group. In addition to that Shapiro-Wilk and Jarque-Bera JB tests were applied to trace the normal distribution.
TRANS Asian Research Journals
http://www.tarj.in 34
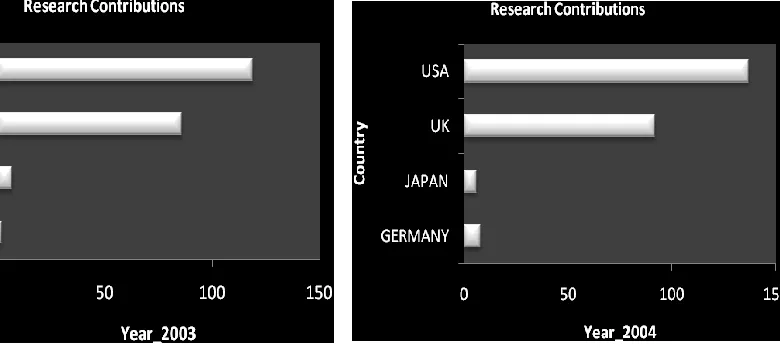
SCREEN SHOT 1: RESEARCH OUTPUT IN 2003 SCREEN SHOT 2: RESEARCH OUTPUT IN 2004
SCREEN SHOT 3: RESEARCH OUTPUT IN 2005 SCREEN SHOT 4: RESEARCH OUTPUT IN 2006
TABLE 1.1: EXPECTED FREQUENCIES TABLE 1.2: ROW PROPORTIONS
TRANS Asian Research Journals
http://www.tarj.in 35
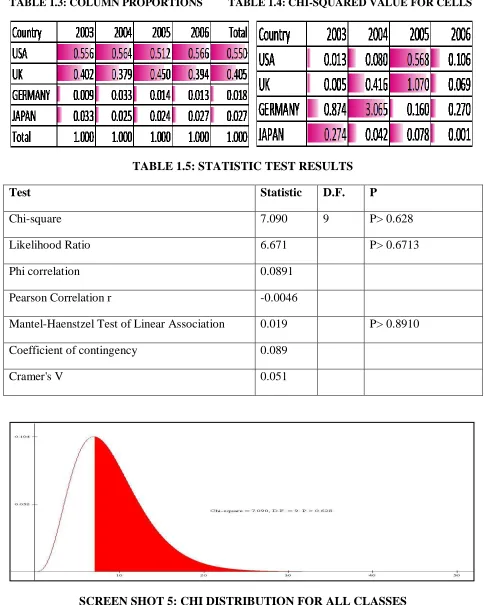
TABLE 1.3: COLUMN PROPORTIONS TABLE 1.4: CHI-SQUARED VALUE FOR CELLS
TABLE 1.5: STATISTIC TEST RESULTS
Test Statistic D.F. P
Chi-square 7.090 9 P> 0.628
Likelihood Ratio 6.671 P> 0.6713
Phi correlation 0.0891
Pearson Correlation r -0.0046
Mantel-Haenstzel Test of Linear Association 0.019 P> 0.8910
Coefficient of contingency 0.089
Cramer's V 0.051
TRANS Asian Research Journals
http://www.tarj.in 36
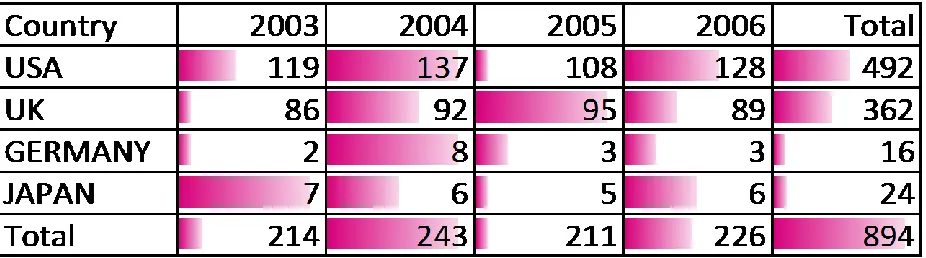
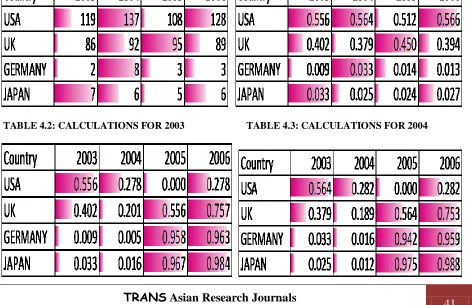
Of the selected countries USA has maximum research output (492) followed by UK with 362 records and the remaining countries (Germany & Japan) have secured less than 25 records. The dispersions of records according to the countries across the years are given in Table 1 whereas their basic statistic measures are given in the annexure-i. Frequency distributions could be clearly observed from the screen shots 1-4. Data classification depicts that the country USA has the highest count 137 during the year 2004. This indicates 0.278 proportion for the research contributions from USA (Table 1.2) and the proportion for the research contributions in the year 2004 is identified as 0.564 (Table 1.3). Maximum records for the country UK is traced as 95 for the year 2005. This represents 0.262 proportion for the research contributions from UK (Table 1.2) and 0.450 proportion for the research contributions during the year 2005 (Table 1.3). The country Germany has 8 contributions in its credit during the year 2004. This shows 0.500 Proportion for the research contributions from Germany (Table 1.2) while the proportion for the research contributions during the year 2004 is found with 0.033 (Table 1.3). Single authors from the country Japan have contributed 7 papers in the year 2003. This represents 0.292 proportion for the research contributions from Japan (Table 1.2) and 0.033 proportion for the research contributions during the year 2003 (Table 1.3). The Likelihood ratio is traced as 6.671 with p>0.6713. The Mantel-Haenstzel test has the statistic value 0.019 with p>0.8910, indicating that the observed difference between countries and years is not statistically significant. The above results reflect that there would not be a possible significance statistically identified between the countries*years and based on these enough evidences, I can claim support to the structured Hypothesis 2 against the alternative. Screen Shot 5 clearly explores the status of hypothesis 2 for better understanding. However, the Pearson Correlation value indicates the low negative linear relationship between the groups.
ANALYSIS FOR STANDARD 2003
Detailed Analysis for Standard 2003 would be observed from the given calculations.
TABLE 2: FREQUENCIES OBSERVED TABLE 2.1: COLUMN PROPORTIONS OBSERVED
TRANS Asian Research Journals
http://www.tarj.in 37
TABLE 2.2: CALCULATIONS FOR 2003 TABLE 2.3: CALCULATIONS FOR 2004
TABLE 2.4: CALCULATIONS FOR 2005 TABLE 2.5: CALCULATIONS FOR 2006
TABLE 2.6: CALCULATIONS FOR ALL VARIABLES-RELATIVE TO AN IDENTIFIED DISTRIBUTION
TABLE 2.7: MEAN USING THE REFERENCE VALUES TABLE 2.8: Z CRITICAL RATIOS
TRANS Asian Research Journals
http://www.tarj.in 38
Overall mean for “Relative to an identified distribution” in non-reference groups = 0.5042 Chi squared = 1.075 with probability < 0.7831
Significance level used for comparisons = 2.394
SCREEN SHOT 6: CHI DISTRIBUTION FOR STANDARD 2003 STATISTICS TEST RESULTS
The comparison between 2004 vs 2003 is identified as not significant. The comparison between 2005 vs 2003 is identified as not significant. The comparison between 2006 vs 2003 is identified as not significant.
TRANS Asian Research Journals
http://www.tarj.in 39
ANALYSIS FOR STANDARD 2004
Detailed Analysis for Standard 2004 would be observed from the given calculations.
TABLE 3: FREQUENCIES OBSERVED TABLE 3.1: COLUMN PROPORTIONS OBSERVED
TABLE 3.2: CALCULATIONS FOR 2003 TABLE 3.3: CALCULATIONS FOR 2004
TABLE 3.4: CALCULATIONS FOR 2005 TABLE 3.5: CALCULATIONS FOR 2006
TRANS Asian Research Journals
http://www.tarj.in 40
TABLE 3.6: CALCULATIONS FOR ALL VARIABLES- RELATIVE TO AN IDENTIFIED DISTRIBUTION
TABLE 3.7: MEAN USING THE REFERENCE VALUES TABLE 3.8: Z CRITICAL RATIOS
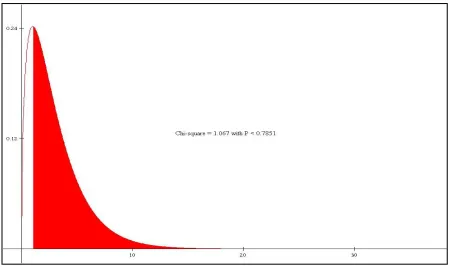
Overall mean for “Relative to an identified distribution” in non-reference groups = 0.5052 Chi squared = 1.067 with probability < 0.7851
Significance level used for comparisons = 2.394
TRANS Asian Research Journals
http://www.tarj.in 41
STATISTICS TEST RESULTS
The comparison between 2003 vs 2004 is identified as not significant. The comparison between 2005 vs 2004 is identified as not significant. The comparison between 2006 vs 2004 is identified as not significant.
Analysis for the reference period 2004 shows the frequency dispersions and proportions towards the Tables 3 & 3.1. Tables 3.2-3.5 explore the calculation details for the observed years. Calculations for all the variables may be traced via table 3.6. The z critical scores for the years 2003, 2005 & 2006 are traced as 0.025, 0.751 and -0.181. Year 2005 is found with the highest mean 0.520 (Table 3.7) followed by 2003 and 2006 in that order. The above results reflect that there would not be a possible significance statistically identified between the years wise output and based on these evidences, I can claim support to the structured Hypothesis 4 against the alternative. The visualization is given via the Screen Shot 7 in order to capture the status of hypothesis 4. It is inferred that single authors’ research contributions in AI do not differ in the pairs comparisons.
ANALYSIS FOR STANDARD 2005
Detailed Analysis for Standard 2005 would be observed from the given calculations.
TABLE 4: FREQUENCIES OBSERVED TABLE 4.1: COLUMN PROPORTIONS OBSERVED
TABLE 4.2: CALCULATIONS FOR 2003 TABLE 4.3: CALCULATIONS FOR 2004
TRANS Asian Research Journals
http://www.tarj.in 42
TABLE 4.4: CALCULATIONS FOR 2005 TABLE 4.5: CALCULATIONS FOR 2006
TABLE 4.6: CALCULATIONS FOR ALL VARIABLES- RELATIVE TO AN IDENTIFIED DISTRIBUTION
TABLE 4.7: MEAN USING THE REFERENCE VALUES TABLE 4.8: Z CRITICAL RATIOS
Overall mean for “Relative to an identified distribution” in non-reference groups = 0.4779 Chi squared = 3.030 with probability < 0.3871
TRANS Asian Research Journals
http://www.tarj.in 43
SCREEN SHOT 8: CHI DISTRIBUTION FOR STANDARD 2005 STATISTICS TEST RESULTS
The comparison between 2003 vs 2005 is identified as not significant. The comparison between 2004 vs 2005 is identified as not significant. The comparison between 2006 vs 2005 is identified as not significant.
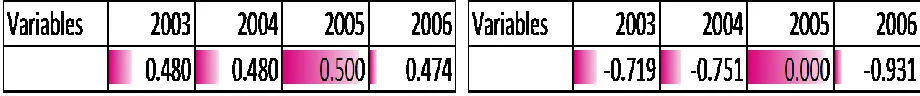
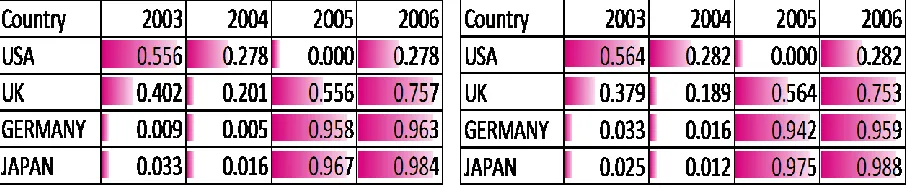
Analysis for the reference period 2005 shows the frequency dispersions and proportions towards the Tables 4 & 4.1. Tables 4.2-4.5 explore the calculation details for the observed years. Calculations for all the variables may be traced via table 4.6. The calculated z critical scores for the years 2003, 2004 & 2006 are respectively -0.719, -0.751 and -0.931. The years 2003 and 2004 are found with the equal mean 0.480 (Table 4.7) and the year 2006 has received the last position. The above results reflect that there would not be a possible significance statistically identified between the years wise output and based on these evidences, I can claim support to the structured Hypothesis 5 against the alternative. The visualization is given via the Screen Shot 8 in order to capture the status of hypothesis 5. It is inferred that single authors’ research contributions in AI do not differ in the pairs comparisons.
ANALYSIS FOR STANDARD 2006
TRANS Asian Research Journals
http://www.tarj.in 44
TABLE 5: FREQUENCIES OBSERVED TABLE 5.1: COLUMN PROPORTIONS OBSERVED
TABLE 5.2: CALCULATIONS FOR 2003 TABLE 5.3: CALCULATIONS FOR 2004
TABLE 5.4: CALCULATIONS FOR 2005 TABLE 5.5: CALCULATIONS FOR 2006
TRANS Asian Research Journals
http://www.tarj.in 45
TABLE 5.7: MEAN USING THE REFERENCE VALUES TABLE 5.8: Z CRITICAL RATIOS
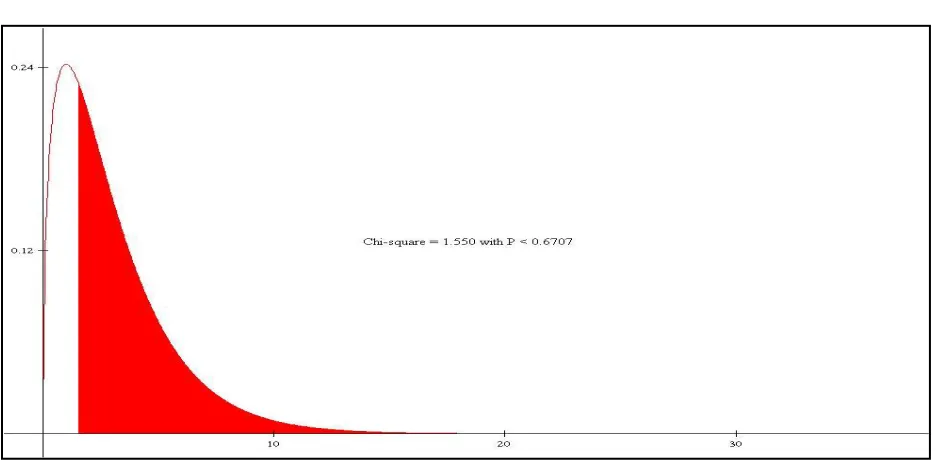
Overall mean for “Relative to an identified distribution” in non-reference groups = 0.5117 Chi squared = 1.550 with probability < 0.6707
Significance level used for comparisons = 2.394
SCREEN SHOT 8: CHI DISTRIBUTION FOR STANDARD 2006 STATISTICS TEST RESULTS
The comparison between 2003 vs 2006 is identified as not significant. The comparison between 2004 vs 2006 is identified as not significant. The comparison between 2005 vs 2006 is identified as not significant.
TRANS Asian Research Journals
http://www.tarj.in 46
hypothesis 6. It is inferred that single authors’ research contributions in AI do not differ in the pairs comparisons.
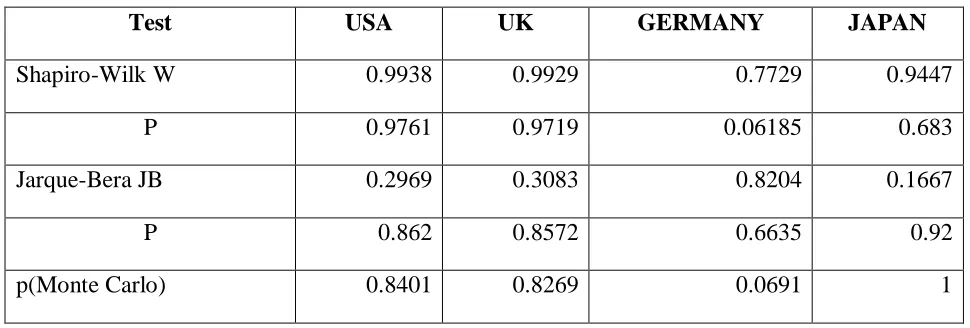
TABLE 6: TEST RESULTS FOR NORMAL PROBABILITY
Test USA UK GERMANY JAPAN
Shapiro-Wilk W 0.9938 0.9929 0.7729 0.9447
P 0.9761 0.9719 0.06185 0.683
Jarque-Bera JB 0.2969 0.3083 0.8204 0.1667
P 0.862 0.8572 0.6635 0.92
p(Monte Carlo) 0.8401 0.8269 0.0691 1
TABLE 7: HYPOTHESIS (H1) TEST RESULTS
Country Status
USA Accepted
UK Accepted
GERMANY Not Accepted
JAPAN Accepted
TABLE 8: HYPOTHESES (H2- H6) TEST RESULTS
Hypotheses Statistic Value Status
H2 7.090 Not Accepted
H3 1.075 Not Accepted
H4 1.067 Not Accepted
H5 3.030 Not Accepted
H6 1.550 Not Accepted
DETERMINATIONS
TRANS Asian Research Journals
http://www.tarj.in 47
contributions in Artificial Intelligence have followed a normal distribution for the countries USA, UK and Japan that led me to support the first hypothesis against the alternative. In contrary the country Germany didn’t show the normal distribution, which would be the reason for not accepting the first hypothesis for this country in favour of the alternative. The 3D visualization that are (Screen Shots 9-12) given in the annexure-ii would help for greater understanding about the status of structured first hypothesis. It is inferred that single author contribution during the period 2003-2006 has been found as not significant as the secured chi-square value is 7.090 with d.f. 9 (p. > value = 0.628), which is the reason for claiming support to the second hypothesis. Table 1.4 explores the chi-squared value for cells that represents the relationship between the countries research contribution for the study period. It is inferred that the countries USA and UK are associated with the year 2005 as their cell values have been traced as 0.568, 1.070. The country Germany is associated with the year 2004, where it shows the cell value 3.065. The relationship of the country Japan is identified with the year 2003 as the cell value is 0.274. In the analysis for standard 2003 the overall mean in non-reference groups is identified as 0.5042. The Chi-Square value is identified as 1.075 (p < 0.7831) and z critical ratios show the negative scores for the years 2004 and 2006 as they have secured less mean compared to the non-reference groups. Comparisons test clearly indicates that there would be no possibilities to reject the third hypothesis in favour of the alternative. In the analysis for standard 2004 the overall mean in non-reference groups is identified as 0.5052. The Chi-Square value is identified as 1.067 (p < 0.7851) and z critical ratios shows the negative score for the year 2006 as it has secured less mean compared to the non-reference groups. Comparisons Test clearly indicates that there would be no possibilities to reject the fourth hypothesis. In the analysis for standard 2005 the overall mean in non-reference groups is identified as 0.4779. The Chi-Square value is identified as 3.030 (p < 0.3871) and z critical ratios shows the negative scores for the years 2003, 2004 and 2006 as they have secured less mean compared to the non-reference groups. Comparisons Test clearly indicates that there would be no possibilities to reject the fifth hypothesis. In the analysis for standard 2006 the overall mean in non-reference groups is identified as 0.5117. The Chi-Square value is identified as 1.550 (p < 0.6707) and other comparisons clearly indicate that there would not be a possible reasons to reject the sixth hypothesis in favour of alternative. Hence, single author’s contributions in artificial intelligence for the identified countries during the period 2003-2006 are not statistically differed. However, this estimate would vary over repeated samples of data. LIS researchers may step forward to conduct further research in order to measure the knowledge productivity in any other fields with various attributes.
REFERENCES
1. Fleiss, F; N.W. Chilton; S. Wallenstein. (1979). Analysis in Dental Studies. Journal of Dental Research. 58, 2080-2084.
2. Garfield, E.(1980). Essays of an Information Scientist. 4, 586-591
3. Hawkins, D. (1978). The Literature of noble gas compounds. Journal of Chem. Inform. Comp. Sci. 18,190-9.
TRANS Asian Research Journals
http://www.tarj.in 48
5. Miller, W. G.(2009). Non-Parametric Statistics. Openstat Reference Manual. 6. Potter, W.G.(1981). Introduction to Bibliometrics. Library Trends. 30,5-7.
7. Price, D.; Gursey, S. (1976). Studies in Scientometrics 1. Transience and continuance in scientific authorship. International Forum on Information and Documentation. 1(2). 17-24.
8. Schubert,A. et al.(1984). Quantitative analysis of a visible tip of the peer review iceberg: book reviews in chemistry. Scientometrics. 6(6), 433-43.
9. Virgo,J.A.(1977).A Statistical Procedure for evaluating the importance of science papers. The Library Quarterly. 47(4), 415-30.
ANNEXURE-I
TABLE-I: YEAR WISE STATISTIC TEST RESULTS
Measures 2003 2004 2005 2006
Mean 53.5 60.75 52.75 56.5
Standard Error 29.09896905 32 28 31
Median 46.5 50 50 48
StdDev. 58.19793811 65 57 62
Variance 3387 4190 3198 3860
Kurtosis -4.425065916 -4 -6 -4
Skewness 0.264493445 0 0 0
Range 117 131 105 125
Minimum 2 6 3 3
Maximum 119 137 108 128
Sum 214 243 211 226
Count 4 4 4 4
95% CI for the Mean from -39.105 -42.253 -37.229 -42.365
TRANS Asian Research Journals
http://www.tarj.in 49
TABLE-II: COUNTRY WISE STATISTIC TEST RESULTS
Measures USA UK GERMANY JAPAN
Mean 123 90.5 4 6
Standard Error 6.204836823 1.936491673 1.3540064 0.40824829
Median 123.5 90.5 3 6
StdDev. 12.40967365 3.872983346 2.7080128 0.816496581
Variance 154 15 7.333 0.6667
Kurtosis -0.861275089 -1.2 3.48347107 1.5
Skewness -0.198839433 1.36E-20 1.81280196 0
Range 29 9 6 2
Minimum 108 86 2 5
Maximum 137 95 8 7
Sum 492 362 16 24
Count 4 4 4 4
95% CI for the Mean from 103.25344 84.33721923 -0.3090527 4.700771736
TRANS Asian Research Journals
http://www.tarj.in 50
ANNEXURE-II
3D-SCREEN SHOT 9: RESEARCH OUTPUT FROM USA
TRANS Asian Research Journals
http://www.tarj.in 51
3D-SCREEN SHOT 11: RESEARCH OUTPUT FROM GERMANY