ISSN 1392-2785 ENGINEERING ECONOMICS. 2005. No 2 (42) THEECONOMICCONDITIONSOFENTERPRISEFUNCTIONING
Structural Funds as Instruments for Regional Economic Development in Lithuania
Vaida Kvainauskait
ė
, Vitalija Kardokait
ė
Kauno technologijos universitetas K. Donelaičio g. 73, LT-44029, Kaunas
In Lithuania, as in other countries of the world, eco-nomic and social development of the regions differs, thefore, the EU regional policy goal is to ensure equal gional economic and social development, decrease of re-gional divergence and growth of rere-gional market competi-tiveness.
The article deals with the theories of regional eco-nomic convergence and divergence, their reflections in current regional economic development policy; Structural funds as stimulating means of regional convergence; Structural fund impact on regional development in Lithua-nia; and relationship between regional economic and so-cial development level and Structural fund allocation level. Based on Structural fund allocation level in different Lithuanian regions, current status of Structural fund allo-cation among the regions is analyzed and its key issues are disclosed.
Keywords: Regional economic development, Regional convergence, Regional divergence, Structural funds, Single Programming Document.
Introduction
Economists have proved that co-operation among the regions leads to economic development and increases re-gional competitiveness, whereas, distinctive diversities among the regions hinder these indispensable changes. Regional development diversities caused the appearance and development of the theories of divergence. As it is claimed in the European Union Commission Report (Sixth Periodic Report, 1999), a competitive and economically developed region sustains high income and employment level even under the circumstances of strong local and in-ternational competition. As regional competitiveness de-pends on the density of competitive enterprises, regional competitive advantages, developed infrastructure and fa-vorable governmental policy on regional development (Charles, Benneworth, 1996), the European Union aims that its regional policy would ensure equal economic and social development of all EU regions, decrease their diver-gence and secure competitiveness in local and global mar-kets.
Structural funds, being financial mechanisms of regional policy, have become one of the driving forces that stimulate regional development. Originally established to reduce diver-sities between town and country in the EU through regional economic and social development by expanding opportunities of less favored regions in common market, EU Structural funds have become a powerful tool for regional development and regional strategic planning in relevant application of
re-gional financial policy mechanisms.
Actually, the assistance of Structural funds is con-stantly oriented toward backward regions (with a GDP per capita below 75 % of the average) and focused mainly on productive investments, infrastructures and business de-velopment.
The EU Commission reports state that the structure of the Lithuanian economy has become similar to that of the EU-15 and other new EU members. Still, the disparities between Lithuania and the EU average are huge. Imple-mentation of regional convergence policy and allocation of financial resources for the development of backward re-gions slow down the development of economically power-ful regions. Financial resources of developed regions are allocated for the reduction of backwardness of economi-cally less developed regions. Thus, under Single Program-ming Document (SPD), European Commission allocated 895.2 million EUR for Lithuania to promote economic and social development in the period of 2000-2006.
The article deals with the impact of Structural funds on regional development in Lithuania, and the correlation between the levels of regional economic and social devel-opment and structural allocation of resources. Based on the EU Structural fund financial resource allocation level for different Lithuanian regions, current status of Structural fund resource distribution among the regions is analyzed and the key issues are disclosed.
Problem – evident divergence among regions causes different levels of regional development and competitive-ness, which result in diversified productivity, innovations, labor skills and infrastructure. There is still lack of detailed research on the analysis of the EU Structural funds as re-gional policy development and convergence reinforcement tools.
Article objective – to assess the correlation between regional economic development level and ability to absorb the EU Structural funds in Lithuania.
Research methods – systematic scientific literature analysis taking into account current opportunities of the EU Structural fund financial resource allocation for the Lithuanian regions.
Regional Economic Development Theories
Theories of regional convergence or divergence are long run. In general, convergence theory is the theory that explains the tendency of poorer countries or regions to grow faster than richer ones. Along with globalization and competitiveness, the theme of convergence has spilled over into public discussions on policies and prospects of devel-oping countries and regions.
Already Marshall (1898) focused on factors determin-ing the location of industries such as agglomeration and spillover effect meaning scale effects external to all com-panies in a region’s industrial district. Schumpeter (1934) gave a star role to enterprises when explaining that an eco-nomic growth of a country is related to their ability to commercialize inventions into profitable innovations.
Two different lines of research can be usefully distin-guished. The first one has been traced by macroeconomists interested in applying the inter-regional scale analysis as a tool originally developed for the international one: cross section regressions between growth rates and initial levels of per capita incomes (Barro and Sala-i-Martin, 1991, 1992, Maxwell and Hite, 1992). The regional development, free competition and factor mobility will tend to equalize factor returns across region within a state. Assuming factor mobility, labor will migrate from low to high wage areas; leading regions would serve to a rise of productivity and wages in the poorer regions, and, in the long run, these disparities would be self-corrected. This new tendency explains why, at the regional level, it is not necessary to distinguish absolute and conditional convergences because regions within a country are likely to converge to the same steady state.In recent literature (Barro and Sala-i-Martin, 1991, Cardoso, 1993, Quah, 1996, Badinger, Muller and Tondl, 2004) different concepts of convergence have been introduced. The most used ones are the following: absolute convergence and conditional convergence. Absolute con-vergence theories explain that poor countries and regions grow faster than rich ones in the same steady state. Before explaining the conditional convergence hypothesis, the structural characteristics of the regions, such as the ten-dency of saving, rate of growth of the population, levels of technology, institutions, policies and so on, must be exam-ined. The dispersion of per capita GDP levels must de-crease over time.
The interest in regional convergence, therefore, seems to be derived from the principle interest, which is in inter-national convergence (Blanchard, 1991). The same scheme proposed by the authors for international convergence analysis fits to explain regional convergence with the only difference that the mobility of capital labor has been intro-duced accelerating the press of convergence according to the neoclassical model. In this way, the essential role of spatial factors in the regional convergence may be ne-glected (Chesshire and Carbonaro, 1995).
In sum, the economic theories do not provide unambi-guous predictions about convergence or divergence of per capita income levels across countries or regions, but they identify a series of factors that are capable in principle generate either convergence or divergence. At some risk of oversimplifying, scientists classify growth models into two families according to their convergence predictions (de la Fuente, 2000).
According to the pattern that poorer countries or
re-gions grow faster than their richer neighbors, to be poor in some extent is an advantage. Finally, it means that the dis-tribution of relative income per capita across territories will tend to stabilize in the long run; this is a sample of convergence. The first condition for convergence is the existence of decreasing returns to scale in capital when the output grows less than proportionally with the stock of capital. This implies that marginal productivity will de-crease with capital accumulation, reducing the incentive to save and the contribution to grow of a given volume of investment, and creating the tendency for growth to slow down over time (Maxwell and Hite, 1992). The same mechanism generates a convergence prediction in the cross-section: poor countries or regions will grow faster than rich ones. When the pattern of explanation is that the return on investment is increasing with the stock of capital per worker, favoring rich regions that tend to grow faster and increase their lead at the expense of poorer; this is con-sidered to be a sample of divergence.
The second factor to consider either convergence or divergence in progressing in the region is the development and implementation of new technologies in the region. If countries differ in generating and adopting new technolo-gies, their long-term growth rates will distinguish. Techni-cal progress could be an important divergence factor, but there are forces that point in the opposite direction. As Gerschenkron (1952), Abramovitz (1986), Dowrick and Nguyen (1989) and de la Fuente (2000) pointed out, the public good properties of technical knowledge have an international dimension to favor less advanced countries or regions to absorb foreign technologies without impedi-ment. The resulting process of technological catch-up can contribute to convergence, particularly with the example of industrialized and fairly developed countries that exploit the advantages derived from technological imitations.
In addition to decreasing returns and technological dif-fusion, the literature identifies the third mechanism of con-vergence that, although featured less prominently in theo-retical models, works through structural change or the real-location of productive factors across the sectors (de la Fuente, 2000).
The perceived failure of optimistic convergence mod-els motivated the search for the alternatives and contrib-uted to the development of new theories incorporating various divergence facts.
may result in diseconomy of developing agglomerations, which at some point later starts to hinder speedy economic development, so the divergence produces not only negative social consequences (living standard in peripheral regions is lower than in the center), but economic (production fac-tors are not effectively used) as well. In the peripheral re-gions as well as in the center, the difference between the labor demand and supply may increase: in the center the capital may be ineffectively used due to the lack of labor force, while, in the periphery, there may be lack of quali-fied labor force (Hardy, 1995, Alden, Boland, 1996). This inadequacy results not only in the increase of unemploy-ment in the country but also in the increase of inflation.
Another popular divergence theory is growth pole the-ory. It emphasizes the theoretical factor and states that eco-nomic development concentration in most urbanized areas creates agglomerations. The theory rests on the ability of the main industry sectors to attract the related business and form the growth pole (Cohen, 1992, Swan, 1995). Such agglom-erations and localizations are speeding economic develop-ment and are considered to be a perspective economic de-velopment model, which could explain successful develop-ment of Irish economy in recent years.
The capital and labor might not be perfectly mobile, and persistent disparities among regions may exist in pro-duction technology, economies and diseconomies of scale and obstacles to the market mechanism. Therefore, re-gional disparities can be self-perpetuating, and, in the ab-sence of intervention in support of the forces, self-reinforcing. New industry and trade may be attracted where industry and trade already exists and necessary in-frastructure is more developed than in other areas.
This gravitation process causes the intra-country polari-zation, by which relatively developed areas continue to grow fast clustering in “poles of development” providing new investments, exploiting economies of scale and growing at the expense of other regions of the economy, while rela-tively backward regions experience cumulative economic decline. The unbalanced growth within the borders of coun-tries may cause problems for sustainable and balanced eco-nomic growth of a global market.
The emphasizing of the importance of local human re-sources and creation of favorable conditions for business in periphery rests upon the goals of the EU structural policy and helps to promote the convergence theories and policies.
Structural Funds and Regional Convergence
Regional policies usually take the instruments to han-dle sustainable growth as government assistance for in-vestment in new and existing industry to help solve the problems due to regional unemployment, decentralization and slow growth, public expenditure on infrastructure, general subsidies, negative inducement when the centrali-zation is controlled and etc.
In the EU, as well as in Lithuania, state aid destroying perfect competition is banned, but a special dispensation is provided for aid to promote the economic development of areas where the standard of living is abnormally low or where there is serious underemployment to aid facilitation of the development of certain economic areas (Treaty of European Community, 1992). These statutes define the
regulation of national aid in order to limit resulting distor-tions of competition.
To promote regional development and convergence in the Community, an integrated regional policy based on the regional activities of the structural funds as structural pol-icy financial instruments has been formed. The regulations laying down general provisions on the Structural Funds are Council Regulations (EC): No 1260/99, No 1447/2001, and No 1105/2003.
Meanwhile, there are four funds to fight unemploy-ment and stimulate the growth in poor regions, and the Cohesion fund financing directly individual environment and transport projects, namely, the European Regional Development Fund (ERDF) contributing mainly to finance infrastructure, job-creating investments, local development projects and aid for small firms; the European Social Fund (ESF) promoting projects solving social regional problems, financing education and professional learning, R&D growth, social economic projects, the educational and pro-fessional learning systems development; the Guidance Section of the Agricultural Guidance and Guarantee Fund (EAGGF) helping in both the development and the struc-tural adjustment of rural areas, whose development is lag-ging behind, by improving the efficiency of their structures for producing, processing and marketing agricultural and forest products; the Financial Instrument for Fisheries Guidance (FIFG) supporting the modernization and reno-vation of fishing industry and the European Cohesion Fund (ECF) called the fifth Structural fund providing as-sistance in the fields of the environment and transport in-frastructure of common interest with a view of promoting economic and social cohesion and convergence between separate regions.
To improve the effectiveness of structural measures, three objectives have been set for the years 2000-2006 (Regulation (EC) No 1260/1999):
Objective 1: promote the development and structural adjustment of regions, whose development is lagging behind, i.e., whose average per capita GDP, is less than 75% of the European Union average. Two thirds of the Structural Fund operations concentrate on Objective 1 and almost 20% of the EU total population is affected by measures taken under this objective.
Objective 2: contribute to the economic and social con-version of regions in structural difficulties other than those eligible for the new Objective 1. It covers areas undergoing economic change, declining rural areas, de-pressed areas dependent on fisheries and urban areas in difficulty. Objective 2 covers not more than 18% of the EU population.
Objective 3: gather all the measures for human resource development outside the regions eligible for Objective 1. Assistance is constantly focused on backward regions (with a GDP per capita below 75 % of the average) and concentrates mainly on productivity investments, infra-structures and business development. For 2000-2006 budg-etary periods, 18 billion EUR have been allocated to the Cohesion fund (at the moment, gross domestic product (GDP) per capita of Luxembourg is twice that of Greece).
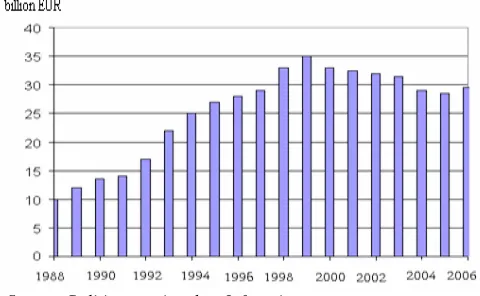
development, undergo restructuring or face specific geo-graphical, economic or social problems are to be put in a better position to cope with their difficulties and to benefit fully from the opportunities offered by the single market. Over the seven-year budget planning period (for the years 2000-2006), about 213 billion EUR have been allocated for structural policy (Figure 1).
Source: Politique regionale – Inforegio, http://www.europa.eu.int/regional_policy/
Figure 1. The EU allocations from Structural and Cohesion Funds for regional development in the years of 1988-2006, billion EUR
From year 1988, the EU considerations for structural policy have increased. The EU allocated 10 billion EUR from its budget to support the structural policy expanding aims and priorities of Structural funds and increasing alloca-tions to finance them. In 1999, there were 35 billion EUR allocated for the structural policy instruments to realize the structural policy aims. By stressing the influence of struc-tural policy on so-called purely economic determinants of
the location of economic activity – comparative advantage and agglomeration – EU influenced the regional economic development of regions. The best study in this area, Midel-fart-Knarvik and Overman (2002), find that EU structural policy with its financial instruments affected the geographi-cal location of industry. From year 2000, the financing of structural policy decreased due to the EU enlargement when the preparation for the accession of 10 candidate states was financed to satisfy the convergence requisitions. The second reason of structural allocations decrease was the shake-up of structural policy and reformation of sponsorship priorities. In the years 2000-2006, the total Structural Funds budget has amounted to 195 billion EUR excluding the European Cohesion Fund.
To improve the effectiveness of the appropriations committed in the regions whose development is lagging behind, the new rules have been provided for significant concentration of funding on Objective 1: 135.9 billion EUR or 69.7% of the total allocation goes to Objective 1 promoting the development and structural adjustment of regions, whose development is lagging behind. Another significant part of about 43 billion EUR or 24% of the total allocations goes to contributing to the economic and social conversion of regions and to human resources develop-ment. A part of allocations (21 706 million EUR) was dedicated to accelerate the development of new EU form-ers for the period of 2004-2006 (EUDEL, 2004).
The EU Structural funds have become a means of finan-cial assistance for the EU regional problem solution. Per-forming the role of intermediary between policy theories and economic-social factors, they help governments to imple-ment economic developimple-ment programs and to control re-gional economic development by reducing divergence and increasing convergence (Figure 2).
Figure 2. The Structural Funds impact on regional convergence promotion/implementation among regions
Figure 2 depicts the EU regional policy and its financial instruments in the role of intermediary between regional di-vergence and condi-vergence. Economic and social infrastruc-ture development levels define regional development level indicators. Economic infrastructure development level is de-termined by agglomeration density, transport and communica-tion infrastructure, GDP per capita, foreign investments and unemployment level in the regions, while social infrastructure development level is defined by skilled labor density, human resources, life quality and state social policy. The economic and social development gaps among the regions hinder versa-tile co-operation due to a lot of diversities taking into account the above-mentioned indicators. As shown in Figure 2, the
implementation of regional policy might approximate eco-nomic and social infrastructure indicators that would precon-dition regional convergence.
Structural Fund Programs Encourage
Sus-tainable Regional Development in Lithuania
Regional problems differ among countries in nature and intensity. The EU Commission reports state that the structure of the Lithuanian economy has become much more similar to that of the EU-15 and other new EU mem-bers. Disparities between Lithuania and the EU average are still huge (Table 1).
Table 1 Disparities between Lithuania and the EU (in year 2002)
Indicator Lithuania EU average Assessment of disparity
Gross Domestic Product (GDP) per capita
39.1 % 100 % Large
Unemployment 13.1 % 7.7 % Large
Labour
Productiv-ity 41.7 % 100 % Large
Unit Labour Cost
Growth -0.5 % -0.4 % Small
Total Employment Growth (annual change in em-ployed population)
+4 % 1.3 % Large
Total employment
rate 59.9 % 64.3 % Small
Source: Single Programming Document, 2004-2006.
Lithuania had neither means of regional policy within the scope of economic and social development nor institu-tions responsible for regional policy till 1998. The first Act on Regional Development of the Republic of Lithuania was adopted only in 2000.
Regional diversities intensified in the period of transition to market economy. The gap of GDP per capita between the best and the worst developed Lithuanian regions increased 2.6 times, and, within the regions, even more.
According to the data in Table 1, in 2002, the Lithua-nian GDP per capita comprised 39.1 % of the EU average. Economists assess that regional divergence between the Lithuanian regions and the EU average is rather big. De-spite the fact that the Lithuanian economy has been devel-oping rapidly, the diversities between the Lithuanian and the EU regions remain quite big taking into account other regional development level indicators such as the EU un-employment rate (the latter tends to decrease when re-gional economic development level goes up) or labor pro-ductivity that comprises 41.7% of the EU average. Indeed, due to very rapid economic development in recent years, Lithuania excels the EU in employment growth (Table 1).
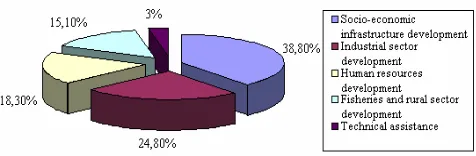
It should be noted that the implementation of regional convergence policy and allocation of financial resources for the development of backward regions slow down the growth of economically developed regions. The resources that should have been allocated for developed regions are used to overcome the backwardness of other regions. On this ground, under the Single Programming Document (SPD), the European Commission allocated 895.2 million EUR to Lithuania for promoting economic and social de-velopment in the period of 2000-2006 (Figure 3).
Figure 3. Split of Structural fund allocations among sectors in years 2000-2006
Figure 3 demonstrates the split of the total Structural fund allocations among the main fields based on the level of regional development, namely, 347.1 million EUR or 38.8 % of Structural fund resources have been assigned to the development of economic and social infrastructure projects; 222.4 million EUR or 24.8 % are assigned to the develop-ment of industrial sector projects; about 163.8 million EUR or 18.3 % – to the projects of human resources; to the meas-ures in the fisheries and rural sector development – about 135.0 million EUR or 15.1 %; to the technical assistance – about 26.9 million EUR or 3 % of Structural fund resources (Single Programming Document, 2003).
Research shows that due to uneven regional economic and social development, regional convergence is disrupted, and geographically bigger region or union development and competitiveness in the global market are impaired. In spite of the substantial EU support to the Lithuanian struc-tural development, the Lithuanian regions can rarely sub-mit exact data on regional human resources and infrastruc-ture capacity that might be attractive to capital investment or search for investors who might comply with regional specifics. Therefore, the first EU structural support pro-gramming stage was only a trial to forecast regional devel-opment and its prospects by using the EU Structural funds.
Relation Between Regional Socio-economic
Development Level and Capacity of
Assimila-tion of Structural AllocaAssimila-tions
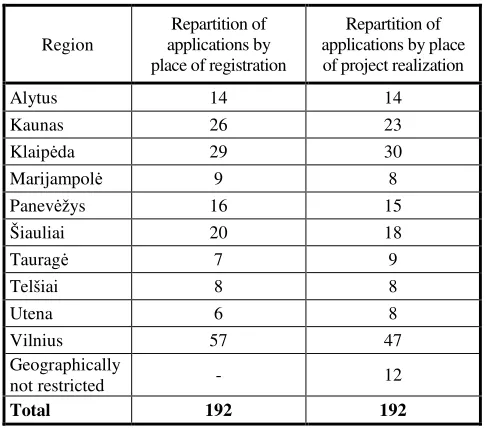
Under the data supplied by the Lithuanian Business Development Agency (LBDA), 192 applications were reg-istered in July-November 2004. The planned expenditures amounted to 728.4 mio. LTL.
Taking into account regional convergence level in Lithuania, some disproportion has been observed in the applications for the EU structural financial support. Most of the applications were submitted by the regions with the centers in the biggest towns of Lithuania: Vilnius – 57 ap-plications, Klaipeda – 29 and Kaunas – 26. Correlatively, most of the projects are planned to be implemented in Vil-niaus region – 47, Klaipeda region – 30 and Kaunas – 23 (Table 2).
Regional divergence can be observed on the country level – economically developed regions tend to receive the biggest share of the EU structural financial support. Though the EU considers Lithuania to be one region, within the country, the structural financial resources are allocated unproportionately.
contribution to country industrial production, unemploy-ment rate and attraction of direct foreign investunemploy-ment. We will try to measure the Lithuanian regional development diversities under the indicators of the regional GDP share in country economy and regional contribution to total in-dustrial output of the country.
As per data of Table 2, taking into account the finan-cial resource accumulation and repartition among the re-gions under the submitted applications for the Structural funds, it should be highlighted that 80 applications or 42 % of the total application number have been submitted by three economically well-developed regions of Lithuania – Vilnius, Klaipeda and Kaunas.
Assessing the Lithuanian regions under regional share of GDP in total country economy, it should be indicated that the above-mentioned three regions create the GDP share of 37325 mio. LTL or 64.5 %: Vilnius – 19851 mio. LTL or 33.4 %, Kaunas – 10793 mio. LTL or 19.2 %, and Klaipeda – 6681 mio. LTL or 11.9% (2003). The fewest number of applications was submitted by Taurage (7 appli-cations), Telsiai (8) and Utena (6) regions. Meanwhile, all together, these three regions create app. 6122 mio. LLT or 10.9 % of country GDP, i.e., less than Klaipeda region (11.9% of country GDP) (www.std.lt, 2004).
Table 2 Repartition of applications by place of registration
and project realization
Region
Repartition of applications by place of registration
Repartition of applications by place of project realization
Alytus 14 14
Kaunas 26 23
Klaipėda 29 30
Marijampolė 9 8
Panevėžys 16 15
Šiauliai 20 18
Tauragė 7 9
Telšiai 8 8
Utena 6 8
Vilnius 57 47
Geographically
not restricted - 12
Total 192 192
Source: Data indicated in applications (www.lvpa.lt).
Assessing the Lithuanian regions under regional share of GDP in total country economy, it should be indicated that the above-mentioned three regions create the GDP share of 37325 mio. LTL or 64.5 %: Vilnius – 19851 mio. LTL or 33.4 %, Kaunas – 10793 mio. LTL or 19.2 %, and Klaipeda – 6681 mio. LTL or 11.9% (2003). The fewest number of applications was submitted by Taurage (7 appli-cations), Telsiai (8) and Utena (6) regions. Meanwhile, all together, these three regions create app. 6122 mio. LLT or 10.9 % of country GDP, i.e., less than Klaipeda region (11.9% of country GDP) (www.std.lt, 2004).
It could be concluded that Vilnius, Kaunas and Klaipeda regions, creating app. 64.5% of country GDP, could attract more than 50 % of the EU Structural fund
resources that have been allocated for the reduction of re-gional economic backwardness.
0 10 20 30 40 50 60 A ly tu s K a un a s K la ip ė d a M ar ija m po l ė P an ev ė žy s Š ia ul ia i Ta u ra g ė T el ši a i U te n a V iln iu s A pp lic ati on s 0 10 20 30 40 50 60 G D P p er c a pi ta , th ou sa n d L TL
Total of applications received GDP per capita, thousand LTL
Figure 4. Ratio of application number and GDP per capita, thou. LTL, 2004
Based on the data of Figure 4, it could be stated that regions with the highest GDP per capita submit the biggest number of applications for Structural fund subsidies, while regions with lower GDP per capita tend to submit very few applications.
Looking through the ratio of the number of applica-tions and GDP per capita in the regions, we can see that the biggest ratio is in Vilnius region followed by Kaunas, Klaipeda and Siauliai regions (Figure 5).
Results in Figure 5 correlate with the previous results. Under the ratio of the number of applications received to regional GDP per capita, the same regions are in the lead-ing position as under the ratio of application number to the share of GDP in country economy. Comparison with the previous results highlights one non-conformity that can be observed on the ratio of application number to regional GDP per capita, namely, Siauliai region appears among the leaders with regional GDP per capita, thou. LTL making 1,639 applications. As in previous results, the fewest num-ber of applications to regional GDP per capita thou.LTL falls to Marijampole (0,81 application to regional GDP per capita thou.LTL), Taurage (0,804), Telsiai (0,575) and Utena (0,437) regions.
Figure 5. Applications devolving to GDP per capita, thou. LTL and 10 thou. Inhabitants in the region, 2004
output, Telsiai region excels Vilnius, Kaunas and Klaipeda regions by selling 23.4% of country industrial production. In this case, particular attention should be drawn to the fact that more than 90% of Telsiai regional sales share within the scope of 23.4% at country regional level is being created by „Mažeikių nafta“ (21 % of country GDP). Taurage and
Utena regional shares of the country industrial output com-prise 1.2 % and 3.4 % respectively.
Taking into account regional economic development level indicators, the results are very similar – all eco-nomic indicators of Vilnius, Kaunas and Klaipeda regions with very few exceptions exceed the other Lithuanian regional indicators. Greater regional result differences can be found with regards to the ratio of application number to 10 000 inhabitants (Figure 5). According to the ratio of application number to 10 000 inhabitants, the leading regional position is taken by Vilnius with 0,68 application to 10 000 inhabitants and Klaipėda (0,77),
however, the mentioned regions are excelled by Alytus region with 0,78 application to 10 000 inhabitants. Being so far the most Structural fund consuming region, Kaunas ranks at the end of the list according to this ratio, i.e., 0,39 application to 10 000 inhabitants. The other regions occupy the same positions as according to their competi-tiveness based on the above-mentioned economic and social indicators.
Despite recent results and taking into account the analyzed regional economic and social development level indicators such as regional GDP, regional input into country industrial production and their ratio to regional application number, it could be stated that market laws are applicable to Structural fund resource allocation among the regions. Economically developed regions that are business, foreign investment and labor force attraction centers, accumulate the most of the Structural fund allo-cations.
Comparing statistical regional economic develop-ment indicators with the EU Structural fund application ratio, it becomes obvious that the most economically de-veloped regions accumulate the sizeable part of regional convergence resources. Despite the EU and member-states continuous regional development policy and statis-tical Structural fund allocation data, it is possible to fore-cast interregional development level according to the sta-tistical Structural fund allocation data on the analyzed regions.
Conclusions
1. Economic theory identifies forces with contrasting implications on income dynamics. Convergence mechanisms feature prominently in the neo-classical and catch-up models that have dominated in literature until recently. The perceived failure of optimistic convergence models motivated the search for alternatives and contributed to the development of new theories incorporating various facts of di-vergence.
2. Traditional regional economics gives reasons for the concentration of activities in a few areas leaving be-hind peripheral regions: economies of scale and ag-glomerations, increase of labor market due to search
and match effects, monopoly power generated by in-novation leadership, externalities associated to the generation of productive knowledge and etc.
3. It could be stated that with the implementation of regional convergence policy and the allocation of financial resources to increase the development level of lagging behind regions, the development of economically strong regions slows down. The should be resources for economically developed re-gions are allocated to overcome the backwardness of less economically developed regions.
4. Regional economic and social development diversi-ties hinder regional convergence and disrupt con-tinuous development and global competitiveness of geographically bigger regions and unions.
5. Even though the EU Structural funds are not the most efficient way to ensure economic growth, the carried out research proves that they reduce regional development diversities and stimulate the economic growth of the country.
6. Taking into account the analyzed regional economic and social development level indicators such as re-gional GDP in country economy, rere-gional share of country industrial production, unemployment rate, labor force compensation factor and direct foreign investment, and their relation to regional application number, it could be asserted that market laws are applicable to Structural fund resource allocation among the regions. Economically developed re-gions that are business, foreign investment and la-bor force attraction centers, accumulate the most of the Structural fund allocations.
7. Comparing statistical regional economic develop-ment indicators with the EU Structural fund appli-cation ratio, it becomes obvious that the most eco-nomically developed regions accumulate the size-able part of regional convergence resources. De-spite the EU and member-states continuous re-gional development policy and statistical Struc-tural fund allocation data, it is possible to forecast interregional development level according to the statistical Structural fund allocation data on the analyzed regions.
References
1. Abramovitz, M. Rapid Growth Potential and Its Realization, in Thinking about Growth and Other Essays on Economic Growth and Welfare. Cambridge U. Press, 1989. 187-219 p.
2. Badinger, H. Regional Convergence in the European Union, 1985-1999: A Spatial Dynamic Panel Analysis / Badinger, H., Muller, W.G., Tondl, G // Regional Studies 38 (3), Carfax Publishing, Eng-land, 2004. 241-253 p.
3. Barro, R. Convergence Across States and Regions / Barro, R., Salla-i-Martin X // Brookings Papers 1:107-82, 1991.
4. Barro, R. Convergence / Barro, R., Salla-i-Martin X // Journal of Political Economy 100:223-51, 1992.
5. Blanchard, O.J. Comments and Discussion of Barro and Salla-i-Martin “Convergence across states and regions” / Brookings Papers 1:159-174, 1991.
6. Canova, F. The Poor Stay Poor: Non-convergence across Countries and Regions / Canova, F. and Marcet A. // CERP Discussion Paper no. 1265, 1995.
Convergence in the European Union / Cappelen A., Castellacci F., Fagerberg J., Verspagen B. // Journal of Common market Studies 41 (4), Springer-Verlang, USA, 2003. 621-644 p.
8. Cardoso, A.R. Regional Inequalities in Europe – Have They Really Been Decreasing / Applied Economics 25 (8), Routledge, London, 1993. 1093 – 1100 p.
9. Charles, D. The Competitiveness Project: North East Regional Com-petitiveness Report. Part 1: Overview and Summary/ D. Charles, P. Benneworth. 2004─09─25. Available from the Internet:
<http://searc.global.epnet.com>
10. Chesshire P. Convergence – Divergence in Regional Growth Rates: An Empty Black Box? / Chesshire P. and Carbonaro G. in: Amstrong H.W., Vickerman R.W. (eds) Convergence and Divergence Among European Regions. London, 1995. 89-111 p.
11. Cohen, D. Tests of the “convergence hypothesis”: a critical note. CERP Discussion Paper, 1992, No. 691.
12. De la Fuente, A. Convergence Across Countries and Regions: Theory and Empirics // EIB Papers, 2000, Vol. 5, No. 2.
13. Dowrick, S. OECD Comparative Economic Growth 1950-85: Catch-up and Convergence / Dowrick, S. and Nguyen, D. T // American Economic review 79 (5), 1989. 1010-1030 p.
14. Europos Komisijos Delegacijos Lietuvoje duomenų bazė. Prieiga per internetą: <www.eudel.lt>
15. Faberberg, J. Heading for divergence? Regional Growth in Europe Reconsidered / Journal of Common Market Studies 34 (3), 1996. 431-448 p.
16. Fan, CC. The Spatial and temporary dynamics of US regional income inequality, 1950-1989 / Fan, CC. and Casetti E // Ann Reg Sci 28, 1994. 177-195 p.
17. Gerschenkron, A. Economic Backwardness in Historical Perspective. Chicago University Press, 1952.
18. Krugman, P. Development, Geography and Economic Theory. Cam-bridge, MA: The MIT Press, 1995.
19. Lewis, W.A. The Theory of Economic Growth. London: George Allen and Unwin, 1995.
20. Mankiw, G. The Growth of Nations / Booking Papers on Economic Activity I, 1995. 275-326 p.
21. Maxwell, P. The Recent Divergence of Regional per Capita Incomes: some evidence from Australia / Maxwell, P. and Hite, J.C. // Growth and Change 32 (winter), 1992. 37-53 p.
22. Porter, M. E. The Competitive Advantage of Nations. New York: The Free Press, 1990.
23. Quah, D. Empirics for economic growth and convergence / European Economic Review 40, 1996. 1353-1375 p.
24. Rodrik, D. Has globalization gone too far? Washington, DC: Institute for International Economics, 1997.
25. Selingson, Mitchell A. Development and Underdevelopment: The Political Economy of Global Inequality (Second Edition) / Selingson, Mitchell A., Passe-Smith, John. T. // Lynnc Rienner Publishers, Inc, USA, 1998.
26. Single Programming Document 2004-2006. Available from the Inter-net: <www.finmin.lt>
27. Swan, D. The Economics of the Common Market. New York: Pen-guin Books, 1995.
Vaida Kvainauskaitė, Vitalija Kardokaitė
Struktūriniai fondai kaip regioninės ekonomikos vystymo priemonė
Lietuvoje
Santrauka
Ryškėjanti divergencija tarp šalies regionų sąlygoja skirtingą re-gionų išsivystymo bei konkurencingumo lygį, kurį paprastai lemia skirtingas gamybos našumas, inovacijos, darbo jėgos kvalifikacijos kėlimas, infrastruktūros plėtra, stabdo ekonominę bei socialinę plėtrą Europos ar pasauliniu mastu.
Ekonomistai įrodė, jog regionų bendradarbiavimas yra kelias į ekonominę plėtrą bei regionų konkurencingumo didinimą, o ryškė-janti divergencija tarp atskirų regionų stabdo šiuos būtinus
poky-čius. Regionų vystymosi skirtingumai sąlygojo konvergencijos bei divergencijos teorijų atsiradimą ir nagrinėjimą. Europos Sąjungos Komisijos ataskaitoje (Sixth Periodic Report, 1999) teigiama, jog konkurencingas ir ekonomiškai stiprus regionas išlaiko aukštų pa-jamų ir užimtumo lygį, netgi veikiant tiek vietinei, tiek tarptautinei konkurencijai. Kadangi regiono konkurencingumas priklauso nuo jo konkurencingų įmonių tankio, regiono turimų konkurencinių prana-šumų, išplėtotos infrastruktūros bei palankios regionų vystymuisi vyriausybės vykdomos politikos (Charles, Benneworth, 1996), Europos Sąjunga siekia, jog jos vykdoma regioninė politika garan-tuotų visų ES regionų tolydų ekonominį bei socialinį vystymąsi, mažintų jų divergenciją ir taip užtikrintų konkurencingumą tiek vietinėje, tiek pasaulinėje rinkose.
Konvergencijos teorija aiškina skurdesnių šalių ar regionų spar-tesnio augimo tendenciją labiau išsivysčiusių regionų atžvilgiu, kuo-met periferiniai regionai gali naudotis labiau išsivysčiusių regionų pasiekimais (Barro and Sala-i-Martin, 1991; Cardoso, 1993; Quah, 1996; Badinger, Muller and Tondl, 2004). Intensyvėjant globalizaci-jos procesams bei konkurencingumui, regionų konvergenciglobalizaci-jos būti-nybė tampa vis aktualesnė priimant šalių ar regionų vystymosi politi-kas. Pastarojo meto tyrimai rodo, kad, nepaisant regionų konvergen-cijos teorijų taikymo regionų plėtroje, regionų skirtingumai tik didėja (ES pavyzdžiu). Optimistiniams konvergencijos modeliams nepasitei-sinus, imta kalbėti apie regionų divergenciją ir jos teorijas, teigta, jog turtingesni regionai pritraukia kapitalą, tapdami verslo ir pramonės traukos centrais, taip vystydamiesi dar greičiau ir didindami atotrūkį nuo periferiniais likusių regionų (Fan and Casetti, 1994; Faberberg and Verspagen, 1996), bei apie būdus regionų divergencijai sustabdy-ti. Vis daugiau dėmesio skiriama regionų konvergencijos politikai ir jos vykdymą užtikrinančioms priemonėms.
Regioninės politikos finansiniais instrumentais laikomi struktū-riniai fondai tapo viena iš jėgų, skatinančių tolydų regioninį vystymą-si. Sukurti ES sanglaudai jos pirminių plėtrų metu skatinti, tiesiogiai skatinant ekonominį bei socialinį regionų vystymąsi, didinant atsilie-kančių regionų galimybes bendroje rinkoje, ES struktūriniai fondai tapo galinga priemone skatinant regionų vystymąsi bei įgalinant re-gionus diegti strateginius planavimus, norint pasinaudoti šiomis fi-nansinėmis regioninės politikos priemonėmis. Struktūriniais fondais siekiama regionų konvergencijos, nes pramonė bei verslai, planuo-dami gauti subsidijas iš struktūrinių fondų, stengiasi kurti Bendrojo programavimo dokumento prioritetus atitinkančias verslo strategijas, taip realizuodami ilgalaikes Europos Sąjungos bei šalių Vyriausybių numatytas regionų konvergencijos strategijas.
Struktūrinių fondų finansinė parama skiriama labiausiai atsiliku-siems ES regionams paremti (BVP mažiau nei 75% nuo ES regionų vidurkio) ir orientuojama į ekonominės bei socialinės infrastruktūros plėtrą, verslo vystymą, ilgalaikių investicijų skatinimą.
Ekonomistų vertinimu, regioninė divergencija tarp Lietuvos re-giono ir ES vidurkio yra gana didelė. Nepaisant spartaus Lietuvos ekonomikos vystymosi, skirtumai tarp Lietuvos ir ES regionų lieka ganėtinai dideli vertinant ir kitus regionų išsivystymo lygio indikato-rius: ES nedarbo lygį (pastarasis turi tendenciją mažėti regiono eko-nominiam išsivystymo lygiui didėjant), darbo jėgos produktyvumą, kuris sudaro 41,7% ES vidurkio. Tiesa, dėl itin spartaus ekonomikos vystymosi pastaraisiais metais, Lietuvos užimtumo augimas didesnis už ES vidurkį.
Regionų skirtumai labai padidėjo perėjimo į rinkos ekonomiką laikotarpiu. Vienam gyventojui tenkančios BVP dalies skirtumai geriausiai ir blogiausiai išvystytuose Lietuvos regionuose padidėjo 2,6 karto, o pačiuose regionuose – dar daugiau. Reikia atkreipti dė-mesį, jog iki 1998 metų Lietuvoje nebuvo nei regionų politikos prie-monių, atskirų nuo kitų socialinės ir ekonominės plėtros prieprie-monių, nei už regionų politiką atsakingų institucijų, nes pirmasis Lietuvos Respublikos regioninės plėtros įstatymas buvo priimtas tiktai 2000 metais. Stengiantis realizuoti regionų konvergencijos politiką ir skiriant fi-nansines priemones atsiliekančių regionų vystymosi lygiui didinti, lėtėja ekonomiškai stipriausių regionų vystymasis. Stipriųjų regionų lėšos skiriamos ekonomiškai silpnesnių regionų atsilikimui mažinti. Šiuo pagrindu pagal Bendrąjį programavimo dokumentą (BPD) Euro-pos Komisija skyrė Lietuvai 895,2 mln. eurų skatinti ekonominiam bei socialiniam vystymuisi 2000─2006 metams.
žmogiškuosius išteklius regione, apie regiono infrastruktūrinius pajė-gumus, kurie būtų patrauklūs kapitalui į regioną pritraukti, apie in-vestuotojų, atitinkančių regiono specifiką, paieškas, labiausiai para-mos reikalingą regiono sritį ir t.t. Todėl pirmasis ES struktūrinės paramos programavimo etapas buvo tik bandymas nuspėti regionų plėtrą ir perspektyvas, pasitelkus ES struktūrinius fondus.
Vertinant regionų konvergencijos lygį Lietuvoje, pastebimi neto-lygumai teikiant paraiškas ES struktūrinei finansinei paramai gauti. Daugiausia paraiškų gauta iš apskričių, kurių centrai yra didieji Lie-tuvos miestai: Vilnius, Kaunas, Klaipėda. Šalies mastu pastebima regionų divergencija – ekonomiškai stipriausiems regionams tenka daugiausia ES struktūrinės finansinės paramos. ES mastu Lietuva laikoma vienu regionu, tačiau žemesniame lygyje, t.y. šalies viduje, struktūriniai asignavimai pasiskirsto netolygiai. Vertinant Lietuvos regionus pagal regionuose sukuriamą BVP dalį šalies ekonomikoje, reikia pažymėti, kad minėtos trys apskritys sukuria 37 325 mln. Lt vertės, arba 64,5 %, šalies BVP: Vilnius ─ 19 851 mln. Lt, arba 33,4 %, Kaunas ─ 10 793 mln. Lt, arba 19,2 %, ir Klaipėda ─ 6 681 mln. Lt, arba 11,9% (2003 m.). Mažiausiai paraiškų pateikta iš Tauragės, Telšių ir Utenos apskričių. Palyginimui, šios trys apskritys sukuria apie 6 122 mln. Lt, arba 10,9 %, šalies BVP, t.y. mažiau nei Klaipė-dos regionas (11,9% šalies BVP) (2003 m.). Vadinasi, Vilniaus, Kau-no ir Klaipėdos regionai, kartu sukurdami apie 64,5% šalies BVP, gebės pritraukti daugiau nei 50 % ES struktūrinių fondų lėšų, skirtų atsiliekančių regionų ekonominio vystymosi atotrūkiui mažinti. Re-gionuose kuriuose BVP gyventojui yra didžiausi, paraiškų struktūri-nių fondų subsidijoms gauti pateikiama daugiausia. Atsiliekančiuose regionuose pagal BVP dalį vienam gyventojui paraiškų pateikiama mažiausia.
Pagal pateiktų paraiškų santykį su BVP, sukuriamu vienam gy-ventojui, pirmauja tie patys regionai kaip ir vertinant pateiktų paraiš-kų santykį su regionuose sukuriamomis BVP dalimis šalies ekonomi-koje. Tik tarp pirmaujančių regionų atsiradęs Šiaulių regionas papildo jų sąrašą. Kaip ir ankstesniuose apskaičiavimuose, mažiausia
paraiškų dalis sukuriamai 1000 Lt BVP vienam gyventojui daliai regione tenka Marijampolės, Tauragės, Telšių ir Utenos regionams.
Vertinant visus ekonominio regionų išsivystymo lygio rodiklius, gauti rezultatai labai panašūs – visi ekonominiai rodikliai Vilniaus, Kauno ir Klaipėdos regionų (su retom išimtim) pranoksta kitų Lietu-vos regionų rodiklius. Didesnių rezultatų neatitikimų randama tik vertinant paraiškų skaičių, tenkantį 10 000 regiono gyventojų tarp regionų. Pagal pateiktas paraiškas, tenkančias 10 000 regiono gyven-tojų, tarp pirmaujančių regionų išlieka Vilniaus bei Klaipėdos regio-nai, tačiau juos lenkia Alytaus regionas. Lig šiol tarp daugiausia struktūrinių lėšų pasisavinsiančių regionų minėtas Kauno regionas šiuo atveju lieka vienas iš paskutiniųjų. Likę regionai išsidėsto ta pačia tvarka kaip ir vertinant jų konkurencingumą pagal anksčiau minėtus ekonominius bei socialinius rodiklius.
Atsižvelgiant į išanalizuotus regionų ekonominį ir socialinį išsi-vystymo lygį įvertinančius rodiklius, regione sukuriamą BVP dalį šalies ekonomikoje, regiono indėlį į sukuriamą šalies pramonės pro-dukcijos dalį bei jų santykį su regionams tenkančių paraiškų skaičiu-mi, galima teigti, kad rinkos dėsniai galioja ir struktūrinių fondų lėšų pasiskirstymui regionuose. Stipriausieji regionai, būdami verslo struktūrų, užsienio investicijų ir darbo jėgos traukos centrais, pritrau-kia didžiausias struktūrinių fondų lėšas.
Palyginus statistinius ekonominius regionų išsivystymo rodiklius ir paraiškų struktūrinėms ES lėšoms gauti santykį, tampa akivaizdu, jog labiausiai ekonomiškai išsivystę regionai pritraukia didžiąją dalį regionų konvergencijai skirtų lėšų, nepaisant ES ir šalių vyriausybių tolydžios regionų plėtros politikos, ir pagal statistinius struktūrinių lėšų panaudojimo rodiklius šalies regionuose galima numanyti atskirų regionų išsivystymo lygį tarp kitų pagal statistinius struktūrinių lėšų įsisavinimo rodiklius įvertintų regionų.
Raktažodžiai: regionų ekonominis vystymasis, regionų konvergencija, re-gionų divergencija, struktūriniai fondai, Bendrasis progra-mavimo dokumentas.
The article has been reviewed.