Vol.8 (2018) No. 3
ISSN: 2088-5334
Comparison of WF & Tubular Links on the Eccentrically Brace Frame
System due to Cyclic Loads
Budi Suswanto
#, Aniendhita Rizki Amalia
#, Endah Wahyuni
#, Najibullah Al Farisy
# #Department of Civil Engineering, Institut Teknologi Sepuluh Nopember, Surabaya, 60111, Indonesia E-mail: [email protected]
Abstract— Eccentrically Brace Frame system develops its ductility using link inelasticity. Therefore, the strength of the structure in
resisting the lateral force is highly dependent on the link and some types of link that are commonly used. Furthermore, it needs to compare the behavior of two section frames that most commonly used as a link in EBF system building; they are WF section and tubular section. In addition to the cross-sectional factors, deformation of the link is also highly dependent on the length of the link, hence the test will also be done on three different type of link lengths, they are short links, intermediate links, and long links, that are according to the classification of link lengths defined in AISC Seismic Provision. Before starting the analysis, a literature study has been reviewed to learn more about the behavior of a link under cyclic load. The numerical analysis has been done to find the strength of the link and modeling with the Finite Element Analysis (FEA) using ABAQUS. After all analysis and the calculation are completed, the results will appear in three-dimensional modeling form, Displacement versus Force diagrams and the stress-strain curves to show the ductility of all specimens. The result of the study showed that in short links, both WF link and tubular link achieve nominal shear force is equal to Vp plastic shear force with values 390 kN for tubular section and 437 kN for WF section, and the value of shear force
to the classification of the short link is very dependent on the body cross-sectional area. Tubular link’s body with an area of 89% of the WF link total weight generates shear forces 89% of the shear force from WF link because the formulation of the plastic shear force Vp is highly dependent on factors of body cross-sectional area (Aw). According to the research result, it shows that for both WF
and tubular link cannot reach nominal shear force when the length of the link over the requirement of the shear link.
Keywords— tubular link, WF link, EBF, cyclic loads tubular.
I. INTRODUCTION
Eccentrically Braced Frame (EBF) structural system is one of the types of earthquake resistance building that commonly uses around the world, that is a system that limits the inelastic behavior to only the link beam that lies between two eccentric braces, while the outer beam, column, and diagonal braces remain elastic during the seismic loading. Therefore, Eccentrically Braced Frame (EBF) systems can meet high ductility levels such as Moment Resisting Frame (MRF), and can also provide high elastic stiffness levels such as Concentrically Braced Frame (CBF) [5].
The link is a part of EBF system that needs particular attention because when the lateral force being loaded, the highest value of internal force such as moment and shear will happen at the link. There are two types of link that are commonly used; they are WF link and tubular link. Berman and Bruneau [7] [8] wrote that tubular link with a different cross-section from its flange and body could reach rotation value until 0.15 rad. That tubular link value is two times more than IWF section (that is only 0,08 rad), as written in AISC.
The links in the EBF are formed from offsets at the braces connections on beam or braces adjacent to the columns so that during the seismic load the link becomes active and yielding [11]. Alternatively, in other words, the link acts as a ductile fuse during an earthquake loading so that the link will undergo an inelastic rotation while the other components of EBF remain elastic [12].
There are three possible link beam criteria in the EBF structural system that are; short links, intermediate links and long links [13]. This criterion are determined by the normalization of link length with the ratio between plastic moment capacity (Mp) and plastic shear capacity (Vp). Length of the link is classified into three types by AISC [1], as its relationship graph of plastic rotation with its length.
reach the real value that will happen when the EBF building receives real earthquake load.
A study conducted by Musmar [9] showed that the EBF system with the shear link was more stable and showed more ductility than the moment-shear link. This is due to the constant internal shear force along the links, and the yielding on the web takes place along the web plane of the link. Numerical analysis carried out by Hashemi [6] to the EBF frame with long link criteria indicates that yielding on the link beam is because of the bending force. The energy absorption on the flange is less than the shear link condition due to the occurrence of premature buckling on the flange part of the link beam. To reduce this, it can be controlled by placing web stiffeners on the link beam although it is not very efficient because of the influence of torque. Yurisman et al. [14] and Budiono et al. [4] perform experimental testing and numerical analysis of short-link beam elements (shear links) and long links (bending links) using diagonal web diagonals (diagonal web stiffeners). Suswanto [2] said Link with classification as a short link, will have a higher ductility than the long link. EBF concept design makes sure the link as the firstly fail and the element of the other remain elastic.
II. MATERIAL AND METHOD
A. General
Firstly, literature studies have been done before the research started. The research started with define the specimen to be modeled and then be analyzed. Each model
has different section and categories. There was 7 type of models to be analyzed with, as seen below:
1. Tubular link 150.150.16.18 – Short link (e = 46 cm). 2. Tubular link 150.150.16.18 – Intermediate link (e = 75
cm).
3. Tubular link 150.150.16.18 – Long link (e = 175 cm). 4. WF 200.200.12.12 – Short link (e = 46 cm).
5. WF 200.200.12.12 – Intermediate link (e = 105 cm). 6. WF 200.150.6.9 – Intermediate link (e = 150 cm). 7. WF 200.150.6.9 – Long link (e = 175 cm).
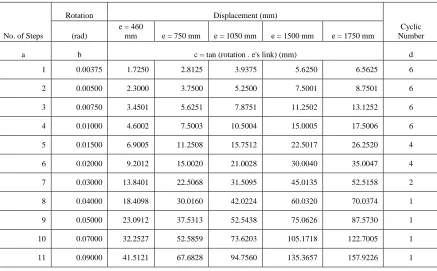
In analysis process, each model geometry and type of the material have to be defined first like the following type. Then from study literature result, displacement load of each link was defined as seen in AISC 2010, chapter 4c ”Cycle test for Qualification – Loading Sequence for the link to column connection.” The defined displacement load then used to chosen steps and cyclic load numbers as seen in Table 1.
After that, the cyclic displacement loading process started using Finite Element Analysis software. The output of that process was created to be table and graphs.
B. Structural Modelling
Before modeling link structure using Finite Element Analysis software, specimen dimension has to be checked first, from the tendency of lateral and local buckling. As a result, each section that chosen to be modelled were a short section. Displacement control load was chosen to be loading input. The value that is used as a result of tan of radian that is multiplied with the length of the link, as labeled in Table 1.
TABLE I
DISPLACEMENT VALUE OF EACH MODEL TYPE
No. of Steps
Rotation Displacement (mm)
Cyclic Number (rad)
e = 460
mm e = 750 mm e = 1050 mm e = 1500 mm e = 1750 mm
a b c = tan (rotation . e's link) (mm) d
1 0.00375 1.7250 2.8125 3.9375 5.6250 6.5625 6
2 0.00500 2.3000 3.7500 5.2500 7.5001 8.7501 6
3 0.00750 3.4501 5.6251 7.8751 11.2502 13.1252 6
4 0.01000 4.6002 7.5003 10.5004 15.0005 17.5006 6
5 0.01500 6.9005 11.2508 15.7512 22.5017 26.2520 4
6 0.02000 9.2012 15.0020 21.0028 30.0040 35.0047 4
7 0.03000 13.8401 22.5068 31.5095 45.0135 52.5158 2
8 0.04000 18.4098 30.0160 42.0224 60.0320 70.0374 1
9 0.05000 23.0912 37.5313 52.5438 75.0626 87.5730 1
10 0.07000 32.2527 52.5859 73.6203 105.1718 122.7005 1
Modeling in this research used a non-linear model, with cyclic loading. Each model was fixed in its one end, then was given a displacement control load in another end, as seen in Figure 1 below.
Fig. 1 Link model was fixed in its one end and was given a displacement control load in another end
III.RESULT AND DISCUSSION
A. Short Link
The used data are the displacement data of Y-axis direction, along with shear force that works on the Y-axis. In cantilever beam, the maximum shear force was located in the fixed end of the beam.
Next, the used RF2 and U2 data were combined so that it becomes a related curve. Where rotation angle is used as the x-axis and shear force is on the y-axis. As seen in Hysteresis curve of the short link in Figure 2.
Fig. 2 Hysteretic Curves of Short Link
Others thing to be calculated are analytical nominal shear force using an equation in SNI 1729-2002 [3], as follows:
• For the Tubular link: Vp = 0.6 fy Aw
Vp tub= 0.6 . 345. (8 x (150 – 2 x 16)) 2 = 390816 N
= 390 kN MpTUB = Zx Fy
= 377296 mm3 x 345 MPa = 130167120 Nmm
e = 460 mm
2Mp/e = 2 . 130167120 Nmm / 460 mm
= 565944 N = 566 kN Vn TUB ≤ 390 kN ≤ 566 kN
Vn TUB = 390 kN (from Figure 2)
• For WF link:
Vp WF = 0.6 345 (12 x (200– 2x12)) = 437184 N
= 437 kN
e = 460 mm
MpWF = Zx Fy
= 841000 mm3 x 345 MPa = 290145000 Nmm
2Mp/e = 2 . 290145000 Nmm / 460 mm = 1261500 N
= 1261 kN VnWF ≤ 437kN ≤ 1261 kN
Vn WF = 437 kN (from Figure 2)
From the following calculation, shear value from hysteresis curves was same with nominal shear from the calculation. This cases happened because the link was in stable condition.
Graphically, the stress and strain curves can be seen in Figure 3. From that graph, the ductility data can be calculated. The calculation could be done by dividing the last step strain with the value of strain when start yielding, as seen below:
Tubular Ductility = εu tub / εy tub = 0.0757 / 0.0046 = 16.569
WF Ductility = εu WF / εy WF = 0.0709 / 0.0068 = 10.482
In conclusion, the Tubular short link has a better ductility than WF short link. It shows that Tubular short link was more stable resisting the cyclic load.
Fig. 3 Stress-Strain Curves of Short Link
B. Long Link
as the x-axis and shear force is on the y-axis. As seen in Hysteresis curve of the long link in Figure 4.
Fig. 4 Hysteretic Curves of Long Link
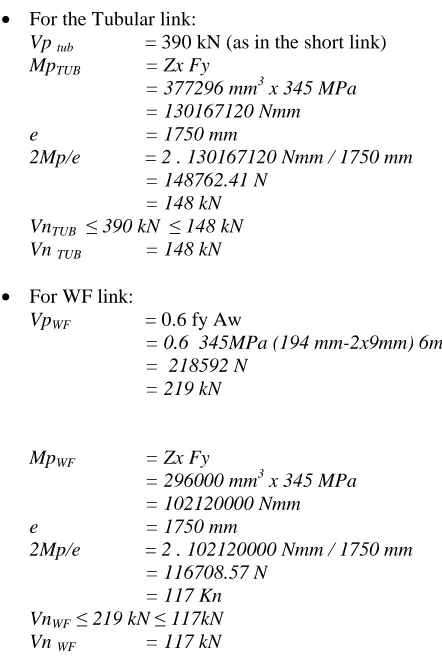
Others thing to be calculated are a nominal shear force, as follows:
• For the Tubular link:
Vp tub = 390 kN (as in the short link) MpTUB = Zx Fy
= 377296 mm3 x 345 MPa = 130167120 Nmm
e = 1750 mm
2Mp/e = 2 . 130167120 Nmm / 1750 mm = 148762.41 N
= 148 kN VnTUB ≤ 390 kN ≤ 148 kN Vn TUB = 148 kN
• For WF link:
VpWF = 0.6 fy Aw
= 0.6 345MPa (194 mm-2x9mm) 6mm = 218592 N
= 219 kN
MpWF = Zx Fy
= 296000 mm3 x 345 MPa = 102120000 Nmm
e = 1750 mm
2Mp/e = 2 . 102120000 Nmm / 1750 mm = 116708.57 N
= 117 Kn VnWF ≤ 219 kN ≤ 117kN Vn WF = 117 kN
From the analysis in the Figure 4., both Tubular link and WF link have shear forces value that was lower than Vn; it is almost half of the Vn. As an example, in the Tubular link, Vn from hysteresis curve is found 90 kN. Moreover, Vn from calculation was 148 kN, the different from hysteresis Vn is 39,19%. Moreover, WF link had the same trend, Vn from hysteresis curve are found 75 kN. Moreover, Vn from
calculation was 117 kN, the different from hysteresis Vn is 35,9%.
Fig. 5 Stress-Strain Curves of Long Link
Graphically, the stress and strain curves can be seen in Figure 5. From that graph, the ductility data can be calculated. The calculation could be done by dividing the last step strain with the value of strain when start yielding, as seen below:
Tubular Ductility = εu tub / εy tub = 0.0622 / 0.0050 = 12.400
WF Ductility = εu WF / εy WF = 0.0639 / 0.006854 =11.799
In conclusion, the Tubular link has a better ductility than WF link. It shows that tubular link was more stable resisting the cyclic load.
C. Intermediate Link
The data of the intermediate link used the same method as seen in the short link and short link. The used RF2 and U2 data were combined so that it becomes a related curve. Where rotation angle is used as the x-axis and shear force is on the y-axis. Hysteresis curve of the intermediate link in Figure 6.
Others thing to be calculated are a nominal shear force, as follows:
• For the Tubular link:
Vp tub = 390 kN (short link) MpTUB = Zx Fy
= 377296 mm3 x 345 MPa = 130167120 Nmm
e = 1750 mm
2Mp/e = 2 . 130167120 Nmm / 750 mm = 347112.30 N
= 347 kN VnTUB ≤ 390 kN ≤ 347 kN Vn TUB = 347 kN
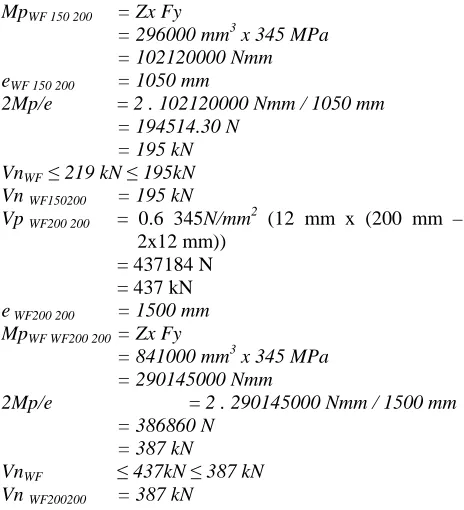
• For WF link:
VpWF 150 200 = 0.6 fy Aw
= 0.6 345MPa (194 mm-2x9mm) 6mm = 218592 N
MpWF 150 200 = Zx Fy
= 296000 mm3 x 345 MPa = 102120000 Nmm eWF 150 200 = 1050 mm
2Mp/e = 2 . 102120000 Nmm / 1050 mm = 194514.30 N
= 195 kN VnWF ≤ 219 kN ≤ 195kN Vn WF150200 = 195 kN
Vp WF200 200 = 0.6 345N/mm2 (12 mm x (200 mm – 2x12 mm))
= 437184 N = 437 kN e WF200 200 = 1500 mm MpWF WF200 200 = Zx Fy
= 841000 mm3 x 345 MPa = 290145000 Nmm
2Mp/e = 2 . 290145000 Nmm / 1500 mm = 386860 N
= 387 kN
VnWF ≤ 437kN ≤ 387 kN Vn WF200200 = 387 kN
From analysis result in Figure 6, both Tubular wand WF link had a lower hysteresis curves shear force than the analytical calculation of Vn. As an example, Tubular link shear force has 30.84% different from its nominal shear force analytical calculation, in analytical it was 347 kN, and from hysteresis curve, it was 240 kN. Moreover, for WF 150 link had the same trend with a Tubular link, in its hysteresis curve the Vn is 110 kN, but from the analytical calculation the value of Vn = 194 kN, it was 43.45 % ratio.
Fig. 6 Stress-Strain Curves of Intermediate Link
WF 200 200 links had a higher ratio, Vn from its hysteretic curve was 150 kN, but its analytical load calculation was Vn = 387 kN, and the different ratio was 61,23 %. That might be because WF 200.200 link was chosen because of approximately in the shear link, whereas standard link classification that was taken was approximate to long link with ratio Mp/Vp = 2.25.
It shows that Tubular link works more optimal indue to cyclic loading, as seen in its ratio that is less than other WF
link. WF link specimen could not reach plastic shear due to reducing stiffness because of lateral buckling.
Fig. 7 Hysteretic Curves of Intermediate Link
Graphically, the stress and strain curves can be seen in Figure 7. From that graph, the ductility data can be calculated. The calculation could be done by dividing the last step strain with the value of strain when start yielding, as seen below:
Tubular Ductility = εu tub / εy tub = 0.0454 / 0.0025 = 18.222
WF 200.150 Ductility = εu WF / εy WF = 0.1475 / 0.0055 = 27.066
WF 200.200 Ductility = εu WF / εy WF = 0.715 / 0.0051 = 14.145
In conclusion, the Tubular link has a better ductility than WF link with the same area. However, the Tubular link has less ductility than WF link with the same inertia. On the other side, found that WF 200.150 link had decline trend when cyclic load value added, different with a tubular link that was more stable resisting the cyclic load. It shows that Tubular link stiffness is better than WF link.
IV.CONCLUSIONS
Short-classified links achieve shear forces whose values are highly dependent on the cross-sectional area of the body, so that the WF cross-section may achieve a higher shearing force than the tubular link. With an 89% body area of the WF body area, the tubular link also achieves an 89% shear value of the WF link shear force.
The larger rotation angle given on the short link, the shear force values that occur in the WF link decreases (from step 8 to step 11 down by 2.75% of average per step), this is due to local buckling that occurs on WF links. Meanwhile, the shear force values in tubular links are more stable when there is the addition of cyclic rotation angle.
On the Long links, neither WF links nor tubular links could not achieve the nominal shear force shear value. The tubular link only achieves a value of V about 61.81% of its nominal shear force value, whereas the WF link reaches 64.10% of its nominal shear value.
The larger rotation angle is given in the Long Link, the shear force value that occurs in the WF link decreases, this is caused by lateral buckling that occurs in the WF link. Meanwhile, the shear force values in tubular links are more stable when there is the addition of cyclic rotation angle.
On the Intermediate links, both WF links and tubular links, the achieved shear force could not reach nominal shear force shear value. The tubular link only reaches V value 69.16% of its nominal shear force value, whereas the WF 200.150 link reaches 57.55% of the nominal shear value, and the WF 200. 200 link reaches only about 38.77% of the crossed Vn value.
The larger the rotation angle given in the Intermediate Link, the shear force value that occurs in the WF link decreases, this is caused by lateral buckling that occurs in the WF link. Meanwhile, the shear force values in tubular links are more stable when there is the addition of cyclic rotation angle.
ACKNOWLEDGMENT
Authors wishing to acknowledge assistance or encouragement from colleagues, technical staff and
especially for Civil Engineering Department, LPPM ITS, and Institut Teknologi Sepuluh Nopember.
REFERENCES
[1] American Institute of Steel Construction. “AISC Seismic Provision,” Chicago: AISC, 2010.
[2] B. Suswanto, AR Amalia, E. Wahyuni “Numerical Behavior Study Of Short Link, Intermediate Link And Long Link In Eccentrically Braced Frame Steel Structure,” International Journal of Applied Engineering Research ISSN 0973-4562 Volume 12, Number 21 (2017) pp. 11460-11471
[3] Badan Standardisasi Nasional. “SNI 03 –1729 2002 Tata Cara Perencaaan Struktur Baja Untuk Bangunan Gedung. Departemen Pekerjaan Umum,” 2010.
[4] Budiono, Bambang, Yurisman, Nidiasari. (2011), “Perilaku Link Panjang dengan Pengaku Diagonal Badan pada Sistem Struktur Rangka Baja Tajan Gempa”. Seminar dan Pameran HAKI. Jakarta. [5] Daneshmand, Ardeshir, dan Behrokh H. Hashemi. (2011),
“Performance of Intermediate and Long Links in Eccentrically Braced Frames.” Journal of Constructional Steel Research, 70 (11): 167-176.
[6] Hashemi, Seyed H. (2011), “Ductility and Ultimate Strength of Eccentric Braced Frame.” Proceeding of International Conference on Advanced Materials Engineering, Cairo, Mesir, 1-3 October. [7] JW Berman and M Bruneau, “Experimental and analytical
investigation of tubular links for eccentrically braced frames.” Science Direct – Engineering Structure, 2006
[8] JW Berman and M Bruneau, “Development of Self-Stabilizing Links for Eccentrically Braced Frames.” Structure Congress – New Horizons and Better Practice, 2007.
[9] Musmar, M.A. 2012. “Effect of Link on Eccentrically Braced Frames.” Journal of Engineering Sciences, Assiut Universiy. Vol 40, 1 (1): 35-43.
[10] T. Okazaki, “Cyclic loading behavior of EBF links constructed of ASTM A992 steel”. Science Direct – Engineering Structure, 2006. [11] Ricles, James M., dan Egor P. Popov. (1994), “Inelastic Link
Element for EBF Seismic Analysis.” Journal of Structural Engineering, 120 (2): 441-463.
[12] Ricles, James M., dan Egor P. Popov. (1994), “Inelastic Link Element for EBF Seismic Analysis.” Journal of Structural Engineering, 120 (2): 441-463.
[13] Richards, Paul W., dan Chia-Ming Uang. (2005), “Effect of Flange Width-Thickness Ratio on Eccentrically Braced Frames Link Cyclic Rotation Capacity.” Journal of Structural Engineering, 131 (10): 1546-1552.