Relationship between assimilable-nutrient content
and physicochemical properties of topsoil**
Przemysław Tkaczyk1, Wiesław Bednarek1, Sławomir Dresler2, Jaromir Krzyszczak3*, Piotr Baranowski3, and Cezary Sławiński3
1Department of Agricultural and Environmental Chemistry, University of Life Sciences, Akademicka 15, 20-033 Lublin, Poland 2Department of Plant Physiology, Institute of Biology and Biochemistry, Maria Curie-Skłodowska University, Akademicka 19,
20-033 Lublin, Poland
3Institute of Agrophysics, Polish Academy of Sciences, Doświadczalna 4, 20-290 Lublin, Poland Received February 28, 2017; accepted August 17, 2017
*Corresponding author e-mail: [email protected] **This paper was co-funded by the Polish National Centre for Research and Development as part of the LCAgri project, Contract No. BIOSTRATEG1/271322/3/NCBR/2015.
A b s t r a c t. In the years 2008-2011, an environmental study was conducted for Polish soils, focusing on the south-eastern Poland soils, as they exhibit significant acidification. This study aimed at assessing the current pHKCl and the supply of basic mac-ro- (P, K, Mg and S-SO4) and microelements (B, Cu, Fe, Mn and
Zn) in the collected soil samples, and also at deter mining their relationship with the soil agronomic category, humus content and pH class. Soil reaction and humus and macronutrient content were positively correlated with the amount of colloidal clay and particles < 0.02 mm. In the majority of cases, the macro-element content in the soil was positively correlated with soil pH and humus content. As for microelements, a usual ly significant and positive correlation was found between the soil agronomic cate-gory and the content of manganese, iron and zinc, whereas for the content of boron and copper, no such relationship was observed. A significant and positive correlation between soil reaction and the content of manganese, iron and boron was also found. Such correlations were not observed in relation to copper and zinc con-tent. Statistical analysis indicated that the content of boron and manganese depended to the greatest extent on the investigated physicochemical properties.
K e y w o r d s: soil nutrients, soil reaction, macroelements, microelements, topsoil
INTRODUCTION
The soil cover in Poland was formed mostly after the
latest glaciation period (Ber, 2005) and includes several soil
types of which, according to the taxonomy of soil in Poland
developed by the Polish Society of Soil Science (Polish
Soil Classification, 2011), the brown earth and podzols are the most commonly reported soil types. Brown earth soils (brown soils and lessive soils) cover about 51.5% of the country’s area and podzols (podzolic soils, podzols and rusty soils) cover about 26% of the area (Bednarek et al.,
2004). Albeluvisols soils, which are typical for this part
of Europe, are also commonly found. When analysing the soil cover of Poland in relation to the soil cover of Central
Europe, which lies almost entirely in the subboreal belt and, at a first glance, exhibits homogeneity (Jones et al., 2005),
one can easily notice that the area coverage of brown earth soils increases westwards, whereas the share of podzols increases eastwards and northwards (Niewiadomski and Tołoczko, 2014). As for soil cover towards the southern and south-eastern directions, mostly podzols, luvisols and albe -luvisols soils can be found. Although Poland’s soil cover
shows a considerable productivity, inappropriate soil man
-agement, resulting in, for example, high acidification and a very low renewability index of organic matter resources in soil (Skłodowski and Bielska, 2009), makes it poorly rated when compared to the soil cover of Central Europe.
One of the basic agro-technical soil management treat
-ments which has a remarkably high impact on yield and crop quality is the fertilisation of soil and plants (Antonkiewicz
et al., 2012). In order to properly identify plant fertilisation needs, the current supply of certain macroelements to the
fertilised soils has to be known. These include such ele
-ments as phosphorus (Berg and Joern, 2006; Bünemann et al., 2011; Fernandes et al., 2000; Mc Dowell and Sharpley,
2003), potassium (Brennan and Bell, 2013; Fotyma, 2007; Moody and Bell, 2006), magnesium (Tkaczyk et al., 2016; Tyler and Olsson, 2001) and sulphate-sulphur (Gąsior and Alvarez, 2012; Szulc et al., 2014), and microelements such
as boron (Majidi et al., 2010; Shaaban, 2010; Szulc and Rutkowska, 2013), copper (Rutkowska et al., 2013; Su and
Yang, 2008), iron (Mcgrath and Zhao, 2006), manganese
(Antonkiewicz et al., 2016) and zinc (Barczak et al., 2009; Domańska, 2009; Rutkowska et al., 2014a). This
know-ledge should be complemented by the equally important data on other physicochemical properties of the fertilised soils, such as pHKCl or humus content (Aponte et al., 2010; Lipiński and Bednarek, 1998). Another agro-technical treatment which should be considered as greatly influenc
-ing crop yield and quality is acidic-soil lim-ing (Tkaczyk
and Bednarek, 2011).
The knowledge of physicochemical soil parameters, among which micro- and macronutrients contents play a
par-ticularly important role, is fundamental to precision agriculture, since the technical and economic viability of re- gulating these parameters can vary. Soil physical charac-teristics can be improved by appropriate agro-technical treatments, i.e. proper cultivation, melioration and fertili-sation (Lamorski et al., 2013; Walczak et al., 1997). Crop
production modellers are also looking for representative data on micro- and macroelement content and their
inter-actions with various properties of soils by employing
increasingly sophisticated simulation models, including soil sub-models. Such models, despite phasic development, organ formation, biomass production, yield and quality for-
mation, can consider soil-crop water relations and the nu-trient (N, P, K) balance. Frequently, the enforced system is used in crop growth simulation models to assess indi
-vidual and comprehensive management patterns, with a
va-riety of environments and totally different genotypes in-
cluded (Fronzek et al., 2017; Pirttioja et al., 2015;
Ruiz-Ramos et al., 2017). Spatio-temporal changes in climate
dynamics are also often analysed and assessed (Baranowski
et al., 2015; Hoffmann et al., 2017; Krzyszczak et al., 2017). This provides valuable information on the impact of climate change on crop production and macro- and micro-nutrient content in the soil.
Notably, the use of mineral fertilisers in Poland, espe
-cially calcium fertilisers, has been very low in recent years. As a consequence, Poland arable soils exhibit significant acidification (Siebielec et al., 2012). This is caused by both natural and anthropogenic factors, the main reason
being, however, the insufficient usage of calcium fertilisers (Filipek and Skowrońska, 2013). This applies overwhelm
-ingly to the soils of south-eastern Poland, especially when
compared to other parts of the country.
Therefore, our study aimed to assess, for a representa-tive set of soils typically found in south-eastern Poland, the
reaction of soils and their basic-macro- (P, K, Mg, S-SO4)
and microelement (B, Cu, Fe, Mn, Zn) supply. The specific aim was to relate macro- and micronutrient contents to the
agronomic categories, humus content and soil reaction.
MATERIALS AND METHODS
A number of environmental studies were conducted
for soils in Poland over a period of four consecutive years,
from 2008 to 2011. Our primary focus was on the soils of south-eastern Poland, since they exhibit significant acidifi
-cation. First, soil sample collection locations were selected
to cover the studied area uniformly. Then, the designated
soil collection locations were matched with farms located
on soils belonging to each of the agronomy categories, i.e.
very light, light, medium or heavy (< 10, 11-20, 21-35,
or >35% of the fraction with a diameter of < 0.02 mm, respectively). However, no soil collection locations were
designated if a category of soil in a given area accounted
for less than 10% of the area of land under agricultural use. The locations were additionally verified using GPS during sample collection. The samples were collected using the
Egner soil probe sampler from a 0-20 cm layer and each
sample was weighted approximately 500 g. In line with the IUNG-PIB recommendations, the number of repetitions for each area was determined based on livestock density. Accordingly, one repetition was made for areas with a live-stock density of less than 40 livelive-stock units (LSU)/100 ha agricultural land (AL), two repetitions for areas with 40-80 LSU/100 ha AL and three repetitions for areas with
more than 80 LSU/100 ha AL. All of the chemical
analy-ses were conducted in an accredited lab of the Regional Agrochemical Station in Lublin. Particle size distribution (PSD) in the collected soil samples was measured using the
laser diffraction method (LDM). The pH in 1 mol KCl dm-3
and soil humus content were measured using the Tiurin method, and phosphorus and potassium contents were identified using the Egner-Riehm (DL) method. The atomic absorption spectrometry (AAS) method was employed to
assay magnesium after the extraction of 0.0125 mol CaCl2 dm-3 from soil. Sulphur levels in sulphates (S-SO
4) were
determined using the nephelometric method. Assimilable
forms of copper, iron, manganese and zinc were assayed
using the AAS method after dissolution in 1 mol HCl.
Boron was assayed using the colorimetric method with
curcumin (A catalogue of methods, 2011). Macronutrients
were assayed in 32 741 soil samples, while microelements were assayed in 2 194 samples. The results were assessed statistically using the one-way non-orthogonal analysis of variance classification with Tukey confidence intervals (p=0.05). The relationships between the content of analysed soil nutrients and particle size distribution, humus content and the reaction of the investigated soils were determined by calculating correlation coefficients. Subsequently, mul
RESULTS AND DISCUSSION
An analysis was conducted of soil reaction, humus
content and macronutrient content in topsoil, divided into
specific agronomic categories, in all soil samples (Table 1). The results indicate that a relationship between agronomic
categories and soil reaction can be established, since very light soils are acidic, light and medium soils are slightly acidic, and heavy soils are neutral. We found that the pHKCl
of very light soils is significantly lower than the pHKCl of
light, medium and heavy soils. Also, it was evident that soil reaction is significantly higher for heavy soils compared to the other categories. Conversely, no statistically significant differences were found between the pH of light and medi
-um soils. These results are in agreement with the results of previous studies (Filipek and Skowrońska, 2013; Lipiński and Bednarek, 1998; Tkaczyk and Bednarek, 2011). These
studies indicated that soil reaction is an important characte-
ristic of soil, as it has a significant impact on the
availabi-lity of the assimilable forms of macro- and microelements.
In his follow-up study, Lipiński (2000; 2005a) noticed a slow but steady improvement in the pH of Polish soils. He concluded that most strongly acidified soils can be found
in eastern and central parts of the country. He also found that almost half the arable soils are in great need of
lim-ing. Tkaczyk and Bednarek (2011) established that 52.1%
of arable soils in south-eastern Poland exhibited very acidic
or acidic pH, with 22.8% being slightly acidic; soil liming was necessary for 47.2% of the examined area and recom
-mended for 13.0% of the area. Optimum levels of pH and humus content in soil, combined with the availability of
assimilable forms of macroelements in quantities adequate to meet crop fertilisation needs, are of crucial importance
to achieving large high-quality yields (Antonkiewicz et al.,
2012; Sharpley, 1995).
The mean values of humus content in the analysed soils, as assigned to their agronomic categories, ranged
from 1.46 to 2.41%. In very light, light and medium soils,
the variability of humus content was statistically insignifi
-cant, whereas for heavy soils, it was significantly higher.
Phosphorus content in the analysed soil samples varied
from 6.1 to 1 312.4 mg P kg-1, while the mean values of phosphorus content in the analysed soils, as assigned to
their agronomic categories, ranged from 67.7 to 109.2 mg
P kg-1. According to the Egner-Riehm limit values,
phos-phorus content in very light, light and medium soils was high, with only little variation between these categories. Conversely, phosphorus content in heavy soils was very
high and differed statistically from the three mentioned categories. This result suggests some changes in
phospho-rus content distribution compared to what was found by Lipiński (2005b), who observed that soils with very low and low phosphorus content accounted for about 38% of agricultural land in Poland, and that most were located in
eastern and south-eastern Poland.
The mean values of assimilable potassium content dif- fered statistically in each category. According to the
Egner-Riehm limit values, this content was moderate in very light soils and high in light, medium and heavy soils. This find
-ing sheds new light on the previous studies by Lipiński (2005c), who claimed that nearly half the agricultural soils in Poland had very low or low potassium content, and also that it was the most deficient plant nutrient in agriculture. However, the percentage area of soils with very low and low amounts of potassium had been decreasing as of the early 1990s (Lipiński, 2000). The results presented in this
paper suggest that this trend continues.
The mean values of magnesium content were average
in very light and heavy soils, and high in light and medium
soils. In medium and heavy soils, magnesium content was significantly higher than in very light and light soils. This finding confirms that there has been a steady improvement
in magnesium content in the soils of south-eastern Poland.
This is in disagreement with the study by Dudziak (1973), who observed that almost 70% of arable land in
south-eastern Poland had an undersupply of assimilable forms of T a b l e 1. Mean, minimum and maximum (under the mean in brackets) values of soil reaction, humus content and the content of the essential nutrients in topsoil, depending on the agronomic category
Soil agronomic
category pHKCl Humus content (%)
P K Mg S-SO4
(mg kg-1)
Very light (3.78 ÷ 8.3)5.24 b (0.1 ÷ 9.47)1.47 a (10 ÷ 453.4)67.7 a (19.1 ÷ 309.6)82.2 a (6 ÷ 118)28.5 a (0.01 ÷ 91.7)4.81 b
Light (4 ÷ 8.42)5.97 a (0.6 ÷ 7.61)1.46 a (8.72 ÷ 545)79.7 a (22.4 ÷ 655.7)141.9 b (6 ÷ 170)58.8 a (0.18 ÷ 225.1)15.60 a
Medium (4 ÷ 8.78)6.00 a (0.17 ÷ 8.25)1.48 a (6.1 ÷ 654)82.7 a (19.1 ÷ 1037.5)169.2 c (7 ÷ 465)90.2 b (1.49 ÷ 161.3)14.70 a
magnesium and that at least half of them should be fertilised
with this macroelement. Czuba and Zaniuk (1968) reported that magnesium content is significantly correlated with the
occurrence of colloidal clay and, to a slightly lesser extent,
with organic carbon. Lipiński and Bednarek (1998) corrob
-orated this finding. Our findings seem to be consistent with Lipiński (2005d), who reported that the supply of assimila -ble magnesium to soil had been improving, and that most of
the soils deficient in this element – more than 40% of arable land – are located in the central-western and south-eastern parts of Poland (Greater Poland, Opole, Łódz, Mazovia and
Lublin regions).
The abundance of sulphate sulphur varied
substantial-ly, from 0.01 to 225.1 mg S-SO4 kg-1, whereas the mean
values of sulphate-sulphur content in the analysed soils, as assigned to their agronomic categories, ranged from
4.81 to 16.92 mg S-SO4 kg-1. In very light soils, this
con-tent was significantly lower than in the other categories. The content of this form of sulphur showed no statistical variation between light, medium and heavy soils. Similar conclusions were drawn by Lipiński (2000), who inves
-tigated the influence of certain factors which affected the
occurrence of sulphate-sulphur in the arable soils of
south-eastern Poland. Szulc et al. (2004), who examined the
variations in the content of the various forms of sulphur in
the soil profile under different tillage systems, found that
a reduction in soil cultivation caused an increase not only in humus content, but also in the content of all the examined
forms of sulphur, including S-SO4. Conversely, Jakubus
(2000) observed that organic matter significantly affected
the content of total sulphur and organic sulphur, and, to a lesser extent, of sulphate-sulphur, in very light and light
soils. Kozłowska-Strawska and Kaczor (2004) expanded
this conclusion by observing that sulphur content in soil depends not only on the species of cultivated plants, but also on the employed form of sulphur fertilisation. Terelak
et al. (1995), following extensive research, concluded that about 53% of Polish agricultural soils (in a 0-20 cm layer) were characterised by low (<15.0 mg kg-1) S-SO
4 content,
with only 5% exhibiting very high (>50.0 mg kg-1) S-SO
4
content.
The assessment of pHKCl and humus content, and phos-phorus, potassium, magnesium and sulphur content in soil indicates that these quantities are strongly and positively dependent on the amount of the smallest fraction in a soil,
i.e., colloidal clay, and particles smaller than 0.02 mm. The reason is probably that as the amount of the smallest soil fractions increases, so does the cation-exchange capacity of an adsorption complex, resulting in an increased amount of exchangeable potassium and magnesium. The increase in the content of the assayed nutrients, including phosphorus
and sulphur, in heavy soils was brought about by a higher
amount of humus, and thus higher mineralisation rates of organic compounds. A further analysis of the impact of soil
organic matter on the occurrence of macronutrients shows
that the contents of macroelements are generally higher for
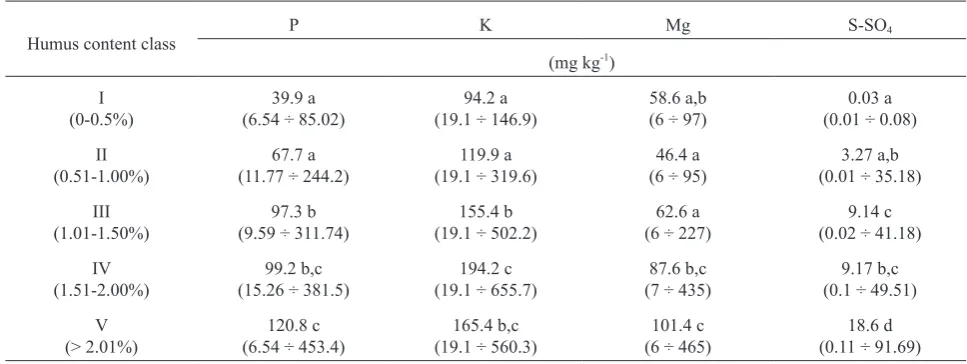
soils with higher humus contents (Table 2 and Fig. 1). The mean values of phosphorus content increased steadily with increasing amounts of humus. However, the differences between classes I and II, III and IV, as well as IV and V were too small to be considered statistically significant. It
should be noted here that the content of this nutrient in class
III was demonstrated to have been statistically higher than in classes I and II, and lower than in class V. Potassium content ranged from 19.1 to 655.7 mg K kg-1, whereas the mean values of potassium content in the analysed soils, as
assigned to their agronomic categories, ranged from 94.2 to 194.2 mg K kg-1, and increased steadily from class I to IV.
However, the differences between classes I and II, III and V, as well as IV and V were statistically insignificant. We
found that the mean values of magnesium content increased consistently from class II to V, but the differences in the Table 2. Mean, minimum and maximum (under the mean in brackets) values of macroelement content in the soil, depending on humus content
Humus content class P K Mg S-SO4
(mg kg-1) I
(0-0.5%) (6.54 ÷ 85.02)39.9 a (19.1 ÷ 146.9)94.2 a 58.6 a,b(6 ÷ 97) (0.01 ÷ 0.08)0.03 a II
(0.51-1.00%) (11.77 ÷ 244.2)67.7 a (19.1 ÷ 319.6)119.9 a (6 ÷ 95)46.4 a (0.01 ÷ 35.18)3.27 a,b III
(1.01-1.50%) (9.59 ÷ 311.74)97.3 b (19.1 ÷ 502.2)155.4 b (6 ÷ 227)62.6 a (0.02 ÷ 41.18)9.14 c IV
(1.51-2.00%) (15.26 ÷ 381.5)99.2 b,c (19.1 ÷ 655.7)194.2 c (7 ÷ 435)87.6 b,c (0.1 ÷ 49.51)9.17 b,c V
content of this element between classes I, II and III, I and IV, as well as IV and V were statistically insignificant.
Also, the mean values of sulphate-sulphur content in soil
grew consistently with increasing humus content (Fig. 1). However, no significant differences between classes I, II and IV, as well as III and IV were observed. In class V soils, S-SO4 content was statistically higher than in the other soil
classes. This evidently positive correlation between phos -phorus, potassium, magnesium and sulphur content, and humus content are most probably attributable to the mine-
ralisation of organic compounds, as well as to the release of
those elements from the mineral compounds occurring in the soil (by acidolysis).
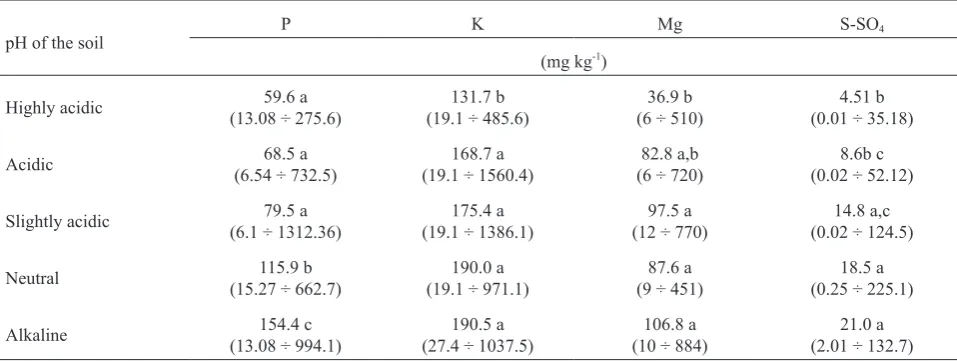
We found a clear and positive relationship between the
content of assimilable forms of macronutrients and the soil
reaction class (Table 3). Phosphorus content in topsoil was
higher for neutral and alkaline soils than for acidic soils.
However, in very acidic, acidic and slightly acidic soils, variations in the content of this nutrient were not significant.
In neutral soils, it was significantly higher than in all the acidic classes of soil reaction and significantly lower than
in alkaline soils. Also, the content of potassium increased consistently from very acidic to alkaline soils, but the
con-tent of this nutrient was significantly lower than in the other
soil reaction classes only in very acidic soils. Potassium
content did not vary statistically between acidic, slightly
acidic, neutral and alkaline soils. The magnesium
content-pH class relationship was also positive and significant,
but not as unambiguous as for P and K. We found that Mg
content did not vary significantly between very acidic and acidic soils, as well as slightly acidic, neutral and alkaline
soils. Sulphate-sulphur content increased steadily,
start-ing from very acidic soils up to alkaline soils. The lowest content of this element was found in very acidic soils and
it differed statistically from the other reaction classes, but
these differences were statistically insignificant between acidic and slightly acidic, as well as neutral and alkaline soils. The noticeable, positive and generally significant
dependence of the assayed forms of macronutrients (P, K,
Mg and S-SO4) on the pH class should be emphasised here.
The smallest content of the above-mentioned elements
were observed in very acidic and acidic soils, the largest –
in neutral and alkaline soils.
Not only soil reaction, humus content and macroele -ment availability in soils, but also optimum levels of soil micronutrients are of crucial importance to obtaining
high-quality crop yields (Antonkiewicz, 2010; Antonkiewicz et al., 2016; Rutkowska et al., 2014b; Su and Yang, 2008). Micronutrient contents in topsoil, divided into specific agro
-nomic categories, are presented in Table 4. The content of soluble boron in assayed soils ranged from 0.04 to 65.2 mg
B kg-1, whereas the mean values of boron content in the analysed soils, as assigned to their agronomic categories,
ranged from 2.92 to 4.97 mg B kg-1. In very light soils, it
was lower compared to the other soil agronomic categories,
Fig. 1. Phosphorus and sulphur content, depending on humus con-tent in the soil.
Table 3. Mean, minimum and maximum (under the mean in brackets) values of macronutrient content in the soil, depending on soil reaction
pH of the soil P K Mg S-SO4
(mg kg-1)
Highly acidic (13.08 ÷ 275.6)59.6 a (19.1 ÷ 485.6)131.7 b (6 ÷ 510)36.9 b (0.01 ÷ 35.18)4.51 b
Acidic (6.54 ÷ 732.5)68.5 a (19.1 ÷ 1560.4)168.7 a (6 ÷ 720)82.8 a,b (0.02 ÷ 52.12)8.6b c
Slightly acidic (6.1 ÷ 1312.36)79.5 a (19.1 ÷ 1386.1)175.4 a (12 ÷ 770)97.5 a (0.02 ÷ 124.5)14.8 a,c
Neutral (15.27 ÷ 662.7)115.9 b (19.1 ÷ 971.1)190.0 a (9 ÷ 451)87.6 a (0.25 ÷ 225.1)18.5 a
Alkaline (13.08 ÷ 994.1)154.4 c (27.4 ÷ 1037.5)190.5 a (10 ÷ 884)106.8 a (2.01 ÷ 132.7)21.0 a
for which the amount of boron increased markedly. Still, no significant differences in boron content between agronomic categories were found. This suggests that some changes have occurred in the boron content relationship with the
other soil components of south-eastern Poland mineral
soils compared to the findings of a study by Myszka (1960). Myszka claimed that for soils typically found in the Lublin Upland, the amount of hot water-soluble boron depend
-ed mainly on particle size distribution (PSD) and humus content, but pH should be also taken into account when
assessing boron content in soils. A similar conclusion can
be found in Goldberg (1997), whereas Zembaczyński and Żmigrodzka (1968) found that for soils in the Zielona Góra
Province, the content of soluble boron in soils depended more on the amount of organic carbon than on PSD or soil
reaction. Dudziak (1973) observed that 35% of soils in the Lublin Province are characterised by low amounts of assimilable boron. Dudziak and Bednarek (1980) expand -ed this conclusion by claiming that the highest content of this element could be found in the arable-humic layer of
Hrubieszów-Tomaszów chernozems and that, in most cas -es, certain physicochemical properties of these soils had
no evident influence on this content. Kociałkowski and Cieśla (1968) found that considerable boron deficiencies occurred in the arable layer of Kuyavia Upland soils, which
may have had an adverse impact on the quality and yield of sugar beets. In terms of soil type, the highest content of this
element was observed for the chernozem soils, whereas the podzolic and brown earth soils had the lowest boron con
-tents (Czuba et al., 1968).
We noticed a substantial variation in the mean values of the content of copper dissolvable in a 1 mol HCl solu-tion in the analysed soils, as assigned to their agronomic
categories. This variation was particularly marked between
very light and light soils, but statistical analysis did not
find any significant differences in the content of this nutri
-ent between the individual agronomic categories of soil. This finding is, to some extent, in agreement with previ
-ous studies. Indeed, Dudziak (1973) reported that 44% of arable soils in the Lublin region were characterised by low contents of this element. A close relationship between the content of soluble copper and the PSD of soil was also iden
-tified (Lipiński and Bednarek, 1998). Moreover, Terelak
et al. (1995) found that about 99% of agricultural land in Poland showed natural (Oo) and slightly increased (Io)
con-tents of copper, allowing the production of high-quality
animal fodders and consumable agricultural products. In terms of soil type, the highest levels of assimilable copper
were found in alluvial soils, while the lowest – in podzolic soils (Czuba et al., 1968).
The mean values of iron content were significantly higher in light and medium soils when compared to very light soils. There were no statistically significant differ
-ences in the content of this micronutrient between light and
heavy soils.
The mean values of manganese content in the analysed soils, as assigned to their agronomic categories, increased
significantly, starting from very light soils up to heavy soils. Similar results were obtained by previous studies. Czuba et al. (1968) found that the highest levels of active Mn can be observed for alluvial soils, and the lowest for the cher
-nozem soils. Kociałkowski and Cieśla (1968) found that the arable layer of the Kuyavia Upland soils showed deficien
-cies in the assimilable form of manganese, whereas 22% of arable soils in the Lubelskie region showed low contents of this element (Dudziak, 1973). Although Piotrowska (1967) found no statistically significant correlations between Mn
content and the amount of organic matter for the loess
soils of the Sandomierz-Opatów highland, other research -ers demonstrated that the content of this nutrient depended
on particle size distribution in each particular pH class (Lipiński and Bednarek, 1998).
The mean values of soluble-zinc content were the low
-est in very light soils. The soluble-zinc content in these soils was significantly lower than in the other agronomic categories. No significant differences in the content of this
T a b l e 4. Mean, minimum and maximum (under the mean in brackets) value of microelement content in the soil, depending on the agronomic category
Soil agronomic category
B Cu Fe Mn Zn
(mg kg-1)
Very light (0.18 ÷ 13.9)2.92 a (0.3 ÷ 16.4)1.47 a (159 ÷ 1805)671.2 b (2.5 ÷ 243.4)49.2 a (0.4 ÷ 54.4)4.68 a
Light (0.12 ÷ 65.2)4.97 a (0.3 ÷ 97.5)10.3 a (21 ÷ 5995)1155.6 a (11.6 ÷ 294.1)147.2 b (0.8 ÷ 118.9)7.54 a,b
Medium (0.04 ÷ 64.2)3.93 a (0.3 ÷ 108.5)6.51 a (21 ÷ 6810)1395.5 c (9.35 ÷ 472.1)178.9 c (0.97 ÷ 274.3)10.08 b
Heavy (0.25 ÷ 24.4)4.62 a (1.69 ÷ 57.4)6.91 a (122.7 ÷ 5840)1053.8 a (35.3 ÷ 530.4)196.8 d (2.2 ÷ 71.1)7.14 a,b
element were observed in light, medium and heavy soils. The content of this element had been studied before, with slightly different conclusions. Dudziak (1973), for instance, concluded that 19% of arable soils in the Lublin region were characterised by low content of this nutrient. Barczak
et al. (2009) reported that the content of assimilable Zn
depended largely on soil type, the form of sulphur
fertilisa-tion and the mutual interacfertilisa-tions between these factors. Soil
type as an important factor behind the varying contents of
zinc was also mentioned in a study by Domańska (2009). Conversely, Piotrowska (1967) observed that, despite the apparent accumulation of zinc in the humic horizons, the content of this nutrient showed no statistically significant correlation with the amount of organic matter for the loess soils of the Sandomierz-Opatów highlands.
To summarise, out of the assayed microelements, only
manganese, iron and zinc contents depended significantly, and usually positively, on the soil agronomic category, whe-reas no statistically significant dependence of agronomic categories on the content of boron and copper was observed.
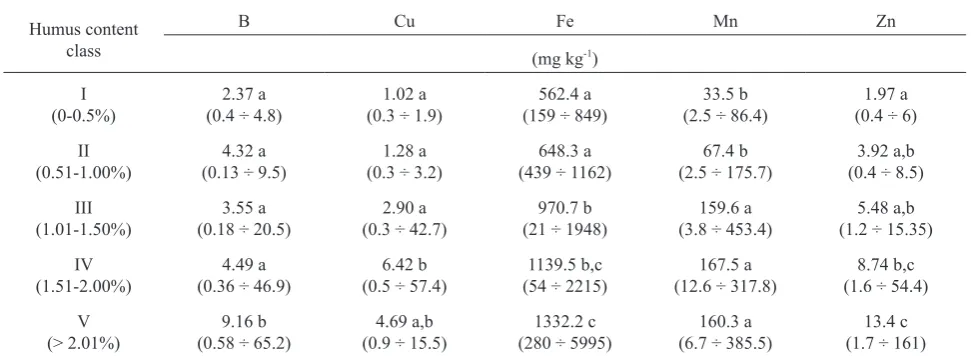
An assessment of the impact of soil organic matter on
the occurrence of micronutrients showed that boron con
-tent did not depend significantly on humus con-tent in the first four soil classes, while it was significantly higher in class V soils when compared to the other classes (Table 5).
As for soluble copper in the assayed soils, no statistically
significant differences in the content of this element were observed between class I, II, III, and V soils. The same
applies to class IV and V soils.
A significant impact was found of humus content class
-es on the amount of iron, its content increasing with each class. However, no statistically significant differences were observed between classes I and II, III and IV, as well as IV and V. The content of soluble forms of manganese was
higher from class I up to class IV of humus content, but no
significant differences were found between classes I and
II, as well as III, IV and V. A marked and steady increase in the content of zinc in relation to the amount of humus in soil was observed (Fig. 2). The lowest content of this microelement was observed for class I soils, and highest for V class soils, but no significant variation in Zn content between classes I, II and III, II, III and IV, as well as IV and V were identified.
In conclusion, the analysis of the influence of soil
humus on the content of soluble forms of micronutrients indicated that particularly evident and positive correlations
could be observed for zinc, iron and manganese, whereas similar, although less pronounced, correlations were report -ed for copper and boron content.
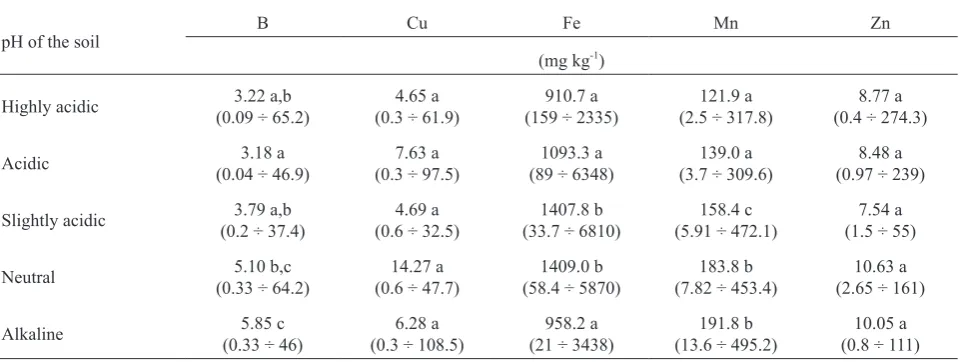
Many studies have reported that the content of soluble
forms of micronutrients depended significantly on soil reac
-tion (Dudziak, 1973; Dudziak and Bednarek, 1980). The relationships between the content of microelements and pH in the assayed soils are presented in Table 6. More specifi
-cally, boron content depended significantly on soil pH, and
Table 5. Mean, minimum and maximum (under the mean in brackets) values of micronutrient content in the soil, depending on humus content
Humus content class
B Cu Fe Mn Zn
(mg kg-1) I
(0-0.5%) (0.4 ÷ 4.8)2.37 a (0.3 ÷ 1.9)1.02 a (159 ÷ 849)562.4 a (2.5 ÷ 86.4)33.5 b (0.4 ÷ 6)1.97 a II
(0.51-1.00%) (0.13 ÷ 9.5)4.32 a (0.3 ÷ 3.2)1.28 a (439 ÷ 1162)648.3 a (2.5 ÷ 175.7)67.4 b (0.4 ÷ 8.5)3.92 a,b III
(1.01-1.50%) (0.18 ÷ 20.5)3.55 a (0.3 ÷ 42.7)2.90 a (21 ÷ 1948)970.7 b (3.8 ÷ 453.4)159.6 a (1.2 ÷ 15.35)5.48 a,b IV
(1.51-2.00%) (0.36 ÷ 46.9)4.49 a (0.5 ÷ 57.4)6.42 b (54 ÷ 2215)1139.5 b,c (12.6 ÷ 317.8)167.5 a (1.6 ÷ 54.4)8.74 b,c V
(> 2.01%) (0.58 ÷ 65.2)9.16 b (0.9 ÷ 15.5)4.69 a,b (280 ÷ 5995)1332.2 c (6.7 ÷ 385.5)160.3 a (1.7 ÷ 161)13.4 c Explanations as in Table 1.
it was the lowest in highly acidic and acid soils, whereas the highest content of this microelement was observed for neutral and alkaline soils. No significant differences in the content of this nutrient were observed between very acidic, acidic and slightly acidic soils, as well as between highly
acidic and slightly acidic soils, and neutral, and alkaline
soils. Furthermore, no significant impact of pH on cop
-per content was found, whereas iron content increased
noticeably, starting from very acidic soils, up to neutral
soils. However, no significant differences in the content of Fe were found when compared to very acidic, acidic and alkaline, as well as to slightly acidic and neutral soils. The
content of manganese gradually increased from very acidic
soils up to alkaline soils, but no significant differences in the content of this element between highly acidic and acidic soils, as well as neutral and alkaline soils were identified. Also, no statistically significant influence of soil reaction on the content of Zn was observed. To summarise, a significant and positive influence was found of soil pH on the content of soluble forms of manganese, iron and boron. However, no such correlations were found for copper and zinc.
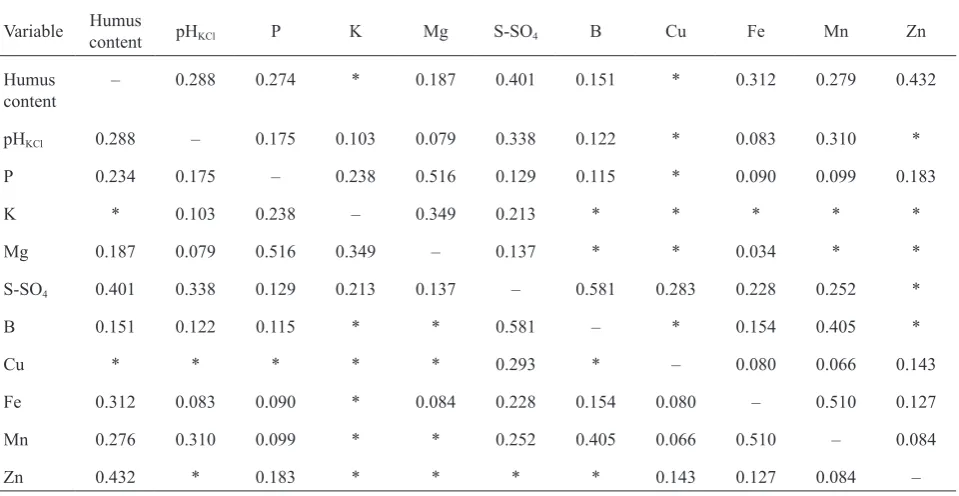
A calculation of the correlation coefficients R between
humus content in soil, soil reaction and the contents of the
assayed forms of macro and microelements (Table 7) showed a significant and positive correlation between the contents
of humus, pHKCl and all of the assayed nutrients (except for potassium and copper). Regrettably, the highest
determi-nation coefficient R2 was only 18.7% and represented the
relationship between zinc and humus content. A significant and positive correlation was observed for the relationship between pHKCl and other indicators. Also, numerous
sig-nificant and positive correlation coefficients were identified between assimilable forms of macro and microelements
and the assayed-soil characteristics. Among other nutrients,
phosphorus content depended significantly and positively
on the majority of the assayed characteristics of soil. The
highest determination coefficient illustrating these relation
-ships was observed for P and Mg relation-ships, but it was only 26.6%. Furthermore, among the calculated character
-istics, significant and positive correlations were observed between the content of potassium and soil reaction, potas -sium content and phosphorus content, magne-sium content and sulphur content, magnesium content and humus
con-tent; magnesium content and pHKCl content, and between magnesium content and the content of assimilable forms
of phosphorus, potassium, sulphur and iron. Significant and positive correlations were also identified between the
content of sulphate-sulphur and the majority of the assayed characteristics of the soil. The highest determination
coef-ficient was obtained for the relationship between S-SO4
and boron contents (33.8%), whereas a slightly lower determination coefficient was obtained for the S-SO4 –
humus content relationship (16.1%). Numerous significant and positive correlation coefficients were also observed between microelements. At 26%, the highest determina
-tion coefficient was obtained for the rela-tionship between iron and manganese, while slightly lower coefficients were related to boron, zinc and copper relationships.
Multiple regression equations were calculated on the basis of the correlation analysis, allowing an estimation of
the projected values of micronutrient contents in soil and the choice of the optimum subset of independent variables. The calculated multiple regression and determination
coef-ficients showed that of the five assayed microelements,
boron and manganese contents exhibited the most
sig-nificant dependence on the physicochemical properties of soil (Table 8). However, it should be noted that the
phy-sicochemical properties determined the content of these
nutrients in soil to an extent of less than 50%.
The study aimed to provide new insights into the pre
-sent status of the soils in the area under study. A knowledge
of the current pHKCl of the soil and the supply of assimilable Table 6. Mean, minimum and maximum (under the mean in brackets) values of microelement content in the soil, depending on the pH
pH of the soil B Cu Fe Mn Zn
(mg kg-1)
Highly acidic (0.09 ÷ 65.2)3.22 a,b (0.3 ÷ 61.9)4.65 a (159 ÷ 2335)910.7 a (2.5 ÷ 317.8)121.9 a (0.4 ÷ 274.3)8.77 a
Acidic (0.04 ÷ 46.9)3.18 a (0.3 ÷ 97.5)7.63 a (89 ÷ 6348)1093.3 a (3.7 ÷ 309.6)139.0 a (0.97 ÷ 239)8.48 a
Slightly acidic (0.2 ÷ 37.4)3.79 a,b (0.6 ÷ 32.5)4.69 a (33.7 ÷ 6810)1407.8 b (5.91 ÷ 472.1)158.4 c (1.5 ÷ 55)7.54 a
Neutral (0.33 ÷ 64.2)5.10 b,c (0.6 ÷ 47.7)14.27 a (58.4 ÷ 5870)1409.0 b (7.82 ÷ 453.4)183.8 b (2.65 ÷ 161)10.63 a
Alkaline (0.33 ÷ 46)5.85 c (0.3 ÷ 108.5)6.28 a (21 ÷ 3438)958.2 a (13.6 ÷ 495.2)191.8 b (0.8 ÷ 111)10.05 a
forms of essential macro (P, K, Mg, S-SO4) and
micronu-trients (B, Cu, Fe, Mn, Zn) to the soil can help farmers to plan and manage reasonable fertilisation treatments using calcium, calcium-magnesium, mineral, natural and organic fertilisers at the farm level. This information can also prove useful in facilitating agricultural advisory services related to
fertilization activities in the area under study. The insights about the relationships between soil components might be
equally relevant, helping farmers to make decisions related to fertilisation and soil liming. The broad representative-ness of our study in terms of the assayed soil samples and their diversity (different soil categories, humus content classes and soil reaction) makes it possible to use multiple
regression equations for the areas with a wide range of soil
conditions so as to help farmers to ensure a proper supply
of nutrients for a healthy growth of crops, and to increase
soil productivity using only a limited set of independent
variables (to save time and consumables when planning
and performing chemical analyses of soil samples).
CONCLUSIONS
1. The evaluation of humus content, pHKCl and the supply of phosphorus, potassium, magnesium and sulphate sulphur
to soils, taking into account the particle size distribution of
these soils, indicated that the above factors depended on
the amount of colloidal clay and particles with a diameter of < 0.02 mm. The obtained correlation was significant and
positive.
2. Positive correlations were usually observed between
humus content and phosphorus, potassium, magnesium and sulphate-sulphur contents in the soil.
Table 7. Nutrient content depending on certain physicochemical properties of soil (correlation coefficients, α = 0.05)
Variable contentHumus pHKCl P K Mg S-SO4 B Cu Fe Mn Zn
Humus
content – 0.288 0.274 * 0.187 0.401 0.151 * 0.312 0.279 0.432
pHKCl 0.288 – 0.175 0.103 0.079 0.338 0.122 * 0.083 0.310 *
P 0.234 0.175 – 0.238 0.516 0.129 0.115 * 0.090 0.099 0.183
K * 0.103 0.238 – 0.349 0.213 * * * * *
Mg 0.187 0.079 0.516 0.349 – 0.137 * * 0.034 * *
S-SO4 0.401 0.338 0.129 0.213 0.137 – 0.581 0.283 0.228 0.252 *
B 0.151 0.122 0.115 * * 0.581 – * 0.154 0.405 *
Cu * * * * * 0.293 * – 0.080 0.066 0.143
Fe 0.312 0.083 0.090 * 0.084 0.228 0.154 0.080 – 0.510 0.127
Mn 0.276 0.310 0.099 * * 0.252 0.405 0.066 0.510 – 0.084
Zn 0.432 * 0.183 * * * * 0.143 0.127 0.084 –
*irrelevant dependence.
Table 8. Microelement content in the soil, depending on certain physicochemical properties of soil calculated using multiple regres-sion equations
Microelement (regression R coefficient)
R2 (determination
coefficient) Multiple regression equation
B 0.696 0.485 YB = 4.98 + 0.28S-SO4 + 0.04Mn - 0.03Cu – 1.55pH – 0.001Fe
Cu 0.414 0.171 YCu = 1.25 + 1.50S-SO4 – 1.84B + 0.75Zn – 8.39humus
Fe 0.540 0.292 YFe = -100.55 + 6.42Mn + 186.51humus
Mn 0.666 0.444 YMn = -15.4 + 0.03Fe + 3.96B + 21.3pH – 0.80S-SO4
3. Highly pronounced and generally significant correla-tions were identified between the content of the assayed forms of macronutrients (P, K, Mg and S-SO4) and soil
reaction class. The lowest content of these elements was observed for highly acidic and acidic soils, whereas the
largest for neutral and alkaline soils.
4. Among the assayed forms of micronutrients (B, Cu, Fe, Mn, Zn), manganese, iron and zinc contents showed significant and positive relationship with the soil agronomic category, whereas no statistically significant relationship was observed with boron and copper contents.
5. Humus content in soil had a significant and positive impact on the content of assimilable forms of zinc, iron,
manganese and, to a slightly lesser extent, on copper and boron content.
6. Significant and positive relationships were found between soil pHKCl and the content of assimilable forms of
manganese, iron and boron. However, no such relationships were observed for copper and zinc content.
7. Statistical analysis showed that out of the five assayed
micronutrients (B, Cu, Fe, Mn, Zn), boron and manganese
contents were highly influenced by the physicochemical properties of the soil. However, physicochemical properties
determined the content of these microelements in soil to an
extent of less than 50%. The broad representativeness of the assayed soil samples allows the application of multiple
regression equations to estimate micronutrient contents in
areas with varying soil conditions.
8. The identification of the current soil reaction, humus
content and the supply of assimilable forms of macro- and
micronutrients to the soil, as well as the determination of relationships between these factors and certain physico-chemical properties of the soil, afford new opportunities to farmers, allowing them to estimate more precisely the
fertilisation needs related to the plants cultivated in the area under study, and later, to balance the supply of certain macro- and micronutrients to the soil.
Conflict of interest: The Authors do not declare
con-flict of interest.
REFERENCES
A catalogue of methods for conducting agrichemical tests in agri-cultural and chemical stations (in Polish). 2011 OSCH-R Lublin, 1-19.
Antonkiewicz J., 2010. Effect of sewage sludge and furnace waste on the content of selected elements in the sward of legume-grass mixture. J. Elementology, 15(3), 435-443. Antonkiewicz J., Jasiewicz C., Koncewicz-Baran M., and
Sendor R., 2016. Nickel bioaccumulation by the chosen plant species. Acta Physiologiae Plantarum, 38(40), 1-11.
Antonkiewicz J., Wiśniowska-Kielian B., Gambuś F., and
Wieczorek J., 2012. Mineral fertilization of vegetables in Poland. Proc. 18th Int. Conf. Reasonable use of fertilizers. November 29, Prague, Czech Republic.
Aponte C., Marañón T., and García L.V., 2010. Microbial C, N
and P in soils of Mediterranean oak forests: influence of season, canopy cover and soil depth. Biogeochemistry, 101, 77-92.
Baranowski P., Krzyszczak J., Sławiński C., Hoffmann H., Kozyra J., Nieróbca A., Siwek K., and Gluza A., 2015.
Multifractal analysis of meteorological time series to assess climate impacts. Climate Res., 65, 39-52.
Barczak B., Murawska B., and Spychaj-Fabisiak E., 2009. The content of available zinc in soil depending on the soil type and sulphur fertilization (in Polish). Zesz. Probl. Post. Nauk Roln., 541, 39-45.
Bednarek R., Dziadowiec H., Pokojska U., and Prusinkiewicz
Z., 2004. Ecology and Soil Science Research (in Polish). PWN Warszawa, Poland.
Ber A., 2005. Polish Pleistocene Stratigraphy - A Review of Interglacial Stratotypes. Netherlands J. Geosciences, 84(2), 61-76.
Berg A.S. and Joern B.C., 2006. Sorption dynamics of organic and inorganic phosphorus compounds in soil. J. Environ. Quality, 35, 1855-1862.
Brennan R.F. and Bell M.J., 2013. Soil K-crop response calibra-tion relacalibra-tionships. Crop Pasture Sci., 64, 514-522.
Bünemann E.K., Prusisz B., and Ehlers K., 2011. Charac- terization of phosphorus forms in soil microorganisms. Phosphorus in Action: Biological Processes in Soil Phosphorus Cycling (Eds E.K. Bünemann, A. Oberson, E. Frossard). Springer, Berlin/Heidelberg, Germany.
Czuba R., Strahl A., and Kamińska W., 1968. Study on
distri-bution of available elements in soil profiles. Part II. Available boron, copper and molybdenum and active man-ganese content in soil profiles (in Polish). Roczn. Glebozn., 19(1), 151-166.
Czuba R. and Zaniuk A., 1968. Investigations on dislocation of available elements in soil profiles. Part III. Correlation between organic carbon and colloidal clay content in soil, its pH and content of available magnesium and some micro-elements (in Polish). Roczn. Glebozn., 19(2), 249-66.
Domańska J., 2009. Soluble forms of zinc in profiles of selected
types of arable soils. J. Elementology, 14(1), 55-62. Dudziak S., 1973. Supply of Magnesium and other Microelements
in Soils of Lubelskie Region. Part II (in Polish). PWRiL Warszawa, Poland.
Dudziak S. and Bednarek W., 1980. Available boron and molyb-denum in chernozemes of the Hrubieszów – Tomaszów region (in Polish). Roczn. Glebozn., 31 (1), 37-62.
Fernandes M.L., Calouro F., Indiati R., and Barros A.M.,
2000. Evaluation of soil test methods for estimation of available phosphorus in some Portuguese soils: A green-house study. Communications in Soil Science and Plant Analysis, 31 (15-16), 2535-2546.
Filipek T. and Skowrońska M., 2013. Current dominant causes
and effects of acidification of soils under agricultural use in Poland (in Polish). Acta Agrophysica, 20(2), 283-294. Fotyma M., 2007. Content of potassium in different forms in the
soils of southeast Poland. Polish J. Soil Sci., 40(1), 19-32.
Fronzek S., Pirttioja N., Carter T.R., Bindi M., Hoffmann H.,
Palosuo T., Ruiz-Ramos M., Tao F., Trnka M., Acutis M., Asseng S., Baranowski P., Basso B., Bodin P., Buis S., Cammarano D., Deligios P., Destain M.-F., Dumont
P., Jacquemin I., Kersebaum K.C., Kollas C., Krzyszczak J., Lorite I.J., Minet J., Minguez M.I., Montesino M., Moriondo M., Müller C., Nendel C., Öztürk I., Perego A., Rodríguez A., Ruane A.C., Ruget F., Sanna M., Semenov M.A., Slawinski C., Stratonovitch P., Supit I., Waha K., Wang E., Wu L., Zhao Z., and Rötter R.P.,
2017. Classifying multi-model wheat yield impact response surfaces showing sensitivity to temperature and precipita-tion change. Agricultural Systems (in press) https://doi. org/10.1016/j.agsy.2017.08.004.
Gąsior J. and Alvarez B., 2012. Content of sulphate sulphur in
different types of soils in the Podkarpackie region. Polish J. Soil Sci., 45(1), 29-38.
Goldberg S., 1997. Reactions of boron with soil. Plant Soil, 193,
35-48.
Hoffmann H., Baranowski P., Krzyszczak J., Zubik M.,
Sławiński C., Gaiser T., and Ewert F., 2017. Temporal
properties of spatially aggregated meteorological time series. Agric. Forest Meteorol., 234, 247-257.
Jakubus M., 2000. The abundance in sulphur of arable light and very light soils of former Poznań region (in Polish). Folia Universitatis Agriculturae Stetinensis, Agricultura, 81, 83-90.
Jones A., Montanarella L., and Jones R., 2005. Soil Atlas of
Europe. The European Soil Bureau, Joint Research Centre, European Commission.
Kociałkowski Z. and Cieśla W., 1968. Available micronutrients
in cultivated soils developed of boulder loam on Kujawy upland (in Polish). Roczn. Glebozn., 19(2), 281-292.
Kozłowska-Strawska J. and Kaczor A., 2004. The influence of
plants fertilization by different sulphur compounds on the sulphur sulphate content in soil (in Polish). Annales UMCS, 59(2), 515-520.
Krzyszczak J., Baranowski P., Zubik M., and Hoffmann H.,
2017. Temporal scale influence on multifractal properties of agro-meteorological time series. Agric. Forest Meteorol., 239, 223-235.
Lamorski K., Pastuszka T., Krzyszczak J., Sławiński C., and
Witkowska-Walczak B., 2013. Soil water dynamic mode-ling using the physical and support vector machine methods. Vadose Zone J., 12(4), doi:10.2136/vzj2013.05.0085
Lipiński W., 2000. Soil acidity and nutrients content on the basis
of chemical analysis provided by agrochemical stations (in Polish). Nawozy i Nawożenie, 3a(4), 89-105.
Lipiński W., 2005a. Soil reactions pH in Poland (in Polish).
Nawozy i Nawożenie, 2(23), 33-40.
Lipiński W., 2005b. The content of available phosphorus in soils
of Poland (in Polish). Nawozy i Nawożenie, 2(23), 49-54.
Lipiński W., 2005c. The content of available potassium in soils of
Poland (in Polish). Nawozy i Nawożenie, 2(23), 55-60.
Lipiński W., 2005d. The content of available magnesium in soils
of Poland (in Polish). Nawozy i Nawożenie, 2(23), 61-66.
Lipiński W. and Bednarek W., 1998. Occurrence of readily
solu-ble forms of metals in the soils of Lublin region depending on soil reaction and grain size composition (in Polish). Zesz. Probl. Post. Nauk Roln., 456, 399-404.
Majidi A., Rahnemaie R., Hassani A., and Malakouti M.J., 2010.
Adsorption and desorption processes of boron in calcareous soils. Chemosphere, 80, 733-739.
Mc Dowell R.W. and Sharpley A.N., 2003. Phosphorus solubil-ity and release kinetics as a function of soil test P concentration. Geoderma, 112, 143-154.
Mcgrath S.P. and Zhao F.J., 2006. Ambient background metal concentrations for soils in England and Wales. Science Report SC050054. Environmental Agency, Bristol, UK. Moody P.W. and Bell M.J., 2006. Availability of soil potassium
and diagnostic soil tests. Soil Res., 44(3), 265-275. Myszka A., 1960. Investigations in the content of soluble boron in
types soils of the Lublin upland (in Polish). Annales UMCS, 15, 99-131.
Niewiadomski A. and Tołoczko W., 2014. Characteristics of soil
cover in Poland with special attention paid to the Łódź region. Natural environment of Poland and its protection in Łódź University Geographical Research. Łódź University Press, 75-99.
Piotrowska M., 1967. Trace elements distribution in some pro-files of loess soils of the Sandomierz-Opatów Upland (in Polish). Pamiętnik Puławski, 30, 85-98.
Pirttioja N., Carter T., Fronzek S., Bindi M., Hoffmann H.,
Palosuo T., Ruiz-Ramos M., Tao F., Trnka M., Acutis M., Asseng S., Baranowski P., Basso B., Bodin P., Buis S., Cammarano D., Deligios P., Destain M., Dumont B.,
Ewert F., Ferrise R., François L., Gaiser T., Hlavinka P., Jacquemin I., Kersebaum K., Kollas C., Krzyszczak J., Lorite I., Minet J., Minguez M., Montesino M., Moriondo M., Müller C., Nendel C., Öztürk I., Perego A., Rodríguez A., Ruane A., Ruget F., Sanna M., Semenov M., Sławiński C., Stratonovitch P., Supit I., Waha K., Wang E., Wu L.,
Zhao Z., and Rötter R., 2015. Temperature and
precipita-tion effects on wheat yield across a European transect: a crop model ensemble analysis using impact response sur-faces. Climate Res., 65, 87-105.
Polish Soil Classification (in Polish), 2011. Rocz. Glebozn., 62(3), 1-142.
Ruiz-Ramos M., Ferrise R., Rodríguez A., Lorite I.J., Bindi M.,
Carter T.R., Fronzek S., Palosuo T., Pirttioja N., Baranowski P., Buis S., Cammarano D., Chen Y., Dumont
B., Ewert F., Gaiser T., Hlavinka P., Hoffmann H., Höhn J.G., Jurecka F., Kersebaum K.C., Krzyszczak J., Lana
M., Mechiche-Alami A., Minet J., Montesino M., Nendel
C., Porter J.R., Ruget F., Semenov M.A., Steinmetz Z., Stratonovitch P., Supit I., Tao F., Trnka M., de Wit A. and
Rötter R.P., 2017. Adaptation response surfaces for
manag-ing wheat under perturbed climate and CO2 in a Medi- terranean environment. Agricultural Systems (in press), https://doi.org/10.1016/j.agsy.2017.01.009
Rutkowska B., Szulc W., and Bomze K., 2013. Effects of soil properties on copper speciation in soil solution. J. Elemen- tology, 18(4), 695-703.
Rutkowska B., Szulc W., and Łabetowicz J., 2014a. Zinc
spe-ciation in soil solution of selected Poland’s agricultural soils. Zemdirbyste, 101(2), 147-152.
Rutkowska B., Szulc W., Sosulski T., and Stepień W., 2014b.
Soil micronutrient availability to crops affected by long-term inorganic and organic fertilizer applications. Plant, Soil Environ., 60(5), 198-203.
Shaaban M.M., 2010. Role of boron in plant nutrition and human health. American J. Plant Physiol., 5(5), 224-240.
Siebielec G., Smreczak B., Klimkowicz-Pawlas A., Maliszewska-Kordybach B., Terelak H., Koza P., Hryńczuk B., Łysiak M., Miturski T., Gałązka R., and Suszek B., 2012.
Monitoring of chemistry in arable soils in Poland in the years 2010-2012 (in Polish). IUNG-PIB w Puławach, 1-202.
Skłodowski P. and Bielska A., 2009. Properties and fertility of
soils in Poland – a basis for the formation of agro-environ-mental relations (in Polish). Water-Environment-Rural Areas, 9(4), 203-214.
Su Y. and Yang R., 2008. Background concentrations of elements in surface soils and their changes as affected by agriculture use in the desert-oasis ecotone in the middle of Heihe River Basin, North-west China. J. Geochemical Exploration, 98, 57-64.
Szulc W. and Rutkowska B., 2013. Diagnostics of boron defi-ciency for plants in reference to boron concentration in the soil solution. Plant, Soil Environ., 59(8), 372-377.
Szulc W., Rutkowska B., and Łabętowicz J., 2004. The content
of total sulphur and sulphate sulphur in soil profile in condi-tions of different soil cultivation systems (in Polish). Annales UMCS, 59, 55-62.
Szulc W., Rutkowska B., Sosulski T., Szara E., and Stepień W.,
2014. Assessment of sulphur demand of crops under perma-nent fertilization experiment. Plant, Soil Environ., 60(3), 135-140.
Terelak H., Piotrowska M., Motowicka-Terelak T., Stuczyński
T., and Budzyńska K., 1995. The content of heavy metals
and sulphur in soils of agricultural land of Poland and the degree of their pollution with these elements (in Polish). Zesz. Probl. Post. Nauk Roln., 418, 45-60.
Tkaczyk P. and Bednarek W., 2011. Evaluation of soil reaction (pH) in the Lublin region (in Polish). Acta Agrophysica, 192(18), 173-186.
Tkaczyk P., Bednarek W., Dresler S., and Krzyszczak J., 2016. Evaluation of soil reaction and content of assimilable nutri-ents in soils of South-Eastern Poland. Acta Agrophysica, 23(2), 249-260.
Tyler G. and Olsson T., 2001. Concentrations of 60 elements in
soil solution as related to the soil acidity. European J. Soil Sci., 52, 151-165.
Walczak R.T., Witkowska-Walczak B., and Baranowski P., 1997. Soil structure parameters in models of crop growth and yield prediction. Physical submodels. Int. Agrophysics, 11, 111-127.
Zembaczyński A. and Żmigrodzka T., 1968. Available boron in