I J H S
International Journal of Health Studies 2016;2(3) | 14
International Journal of Health Studies
Original Article
Secular Trend of Birth Height and Weight in a Population of Iranian Neonates during
1991 and 2011
Maryam Chegeni1, Akbar Fotouhi1, Mohammad Hassan Emamian2*, Kazem Mohammad1 1 Dept. of Epidemiology and Biostatistics, School of Public Health, Tehran University of Medical Sciences, Tehran, Iran.
2 Center for Health Related Social and Behavioral Sciences Research, Shahroud University of Medical Sciences, Shahroud, Iran.
Received: 15 April 2016 Accepted: 27 May 2016
Abstract
Background: The secular trend in growth is a well-documented and recurrent phenomenon in many developed and developing countries. In this study, we examined the secular trends in birth height and weight among Iranian neonates.
Methods: This cross-sectional population-based survey was conducted between 1991 and 2011. Using a two-stage stratified cluster sampling, the birth weights and heights of neonates born in Shahroud, Iran were studied using health records from different households. The mean birth weights and heights for neonates were calculated every year. Secular trends were analyzed using linear regression models and joinpoint regression.
Results: A random sample of 11,165 neonates was evaluated, and the mean birth weight of neonates during the investigation period was calculated. The mean birth weight changed from 3232.1±444.1 g in 1991 to 3204.1±436.9 g in 2011, and the mean birth height changed from 49.5±2.2 cm to 49.3±1.9 cm. The mean birth weights and heights between 1991 and 2011 were not significantly different; however, the birth weight increased by 6.75 g annually between 2000 and 2011 (P < 0.021), and the mean birth height increased by 0.03 cm annually between 2003–2011 and 1991–2003 (P = 0.009).
Conclusions: The mean birth height and weight of neonates in Shahroud did not change significantly from 1991 to 2011; however, we found a significant improvement after 2000.
Keywords:Anthropometry, Birth weight, Trends, Iran.
*Corresponding to: MH Emamian, Email: [email protected] Please cite this paper as: Chegeni M, Fotouhi A, Emamian MH, Mohammad K. Secular Trend of birth height and weight in a population of Iranian neonates between 1991 and 2011. Int J Health Stud 2016;2(3):14-18.
I
ntroduction
The secular trend in growth is a well-documented and recurrent phenomenon in many developed and developing countries.1-3 Its evaluation is important because of the following reasons: it is an indicator of public health status over time, it provides an insight into the relation between growth and the environment, and it shows some aspects of intergenerational relationships in growth and body size.3-5 Furthermore, it reflects the differences in health and welfare levels of the population over time.6
A number of studies indicate that variations in the body size of infants at birth are related to the policies in society, socioeconomic status, health status, industrialization, urbanization, war, and economic crisis.2,5,7 Moreover, other studies showed that the nutritional status of parents and the amount of weight gained during pregnancy usually determine the birth weight and height of infants.8
In addition, a secular trend in the mean height and weight of infants at birth has been observed in different studies.1,2,8-17 For example, studies in China, Queensland, United States, Canada, Norway, Sweden, and Finland have shown an increase in the birth weight of infants.13,15-18 Furthermore, studies in Denmark, Vietnam, France, and Italy have shown the secular trend of the height of neonates at birth.8,15-17
According to the best of our knowledge, insufficient data are available about the secular trend of height and weight of infants at birth in Iran and other Eastern Mediterranean countries.
In this study, we investigated the secular trend of infant birth height and weight in Shahroud, northeast Iran, between 1991 and 2011.
Materials and Methods
We studied the height and weights of 5648 boys and 5515 girls at birth, born between 1991 and 2011 in Shahroud, Iran, from their health records. Shahroud represents the Iranian population. The Shahroud University of Medical Sciences delivers health care services in 79 health houses and health centers. According to previous studies, the standard deviation of birth weight in Iran is 440 g.4 Consequently, we calculated the desired sample size to be at least 420 neonates for each year, considering a marginal error of 50 g, type I error of 0.05, and design effect of 1.4. Following a two-stage stratified cluster sampling design, we divided the Shahroud district into 13 different geographical areas, which served as the strata, and selected 25 health houses and health centers as clusters. Health records were selected in proportion to the population of each stratum in the clusters.
On the basis of the guidelines of the Iranian Ministry of Health, the weight of neonates was measured in grams and the height was measured in centimeters in the supine position. Height and weight of neonates and other data from the household records was collated using a data collection form. The quality of the height and weight measurement tools was checked according to the national standards and guidelines.
duration, delivery type, and maternal age, was investigated in regression models. STATA and Joinpoint softwares were used for data analysis.
This study (No. 9147) was approved by the Shahroud University of Medical Sciences and was conducted in agreement with the Declaration of Helsinki. The study design was approved by the ethics committee of the Shahroud University of Medical Sciences.
Results
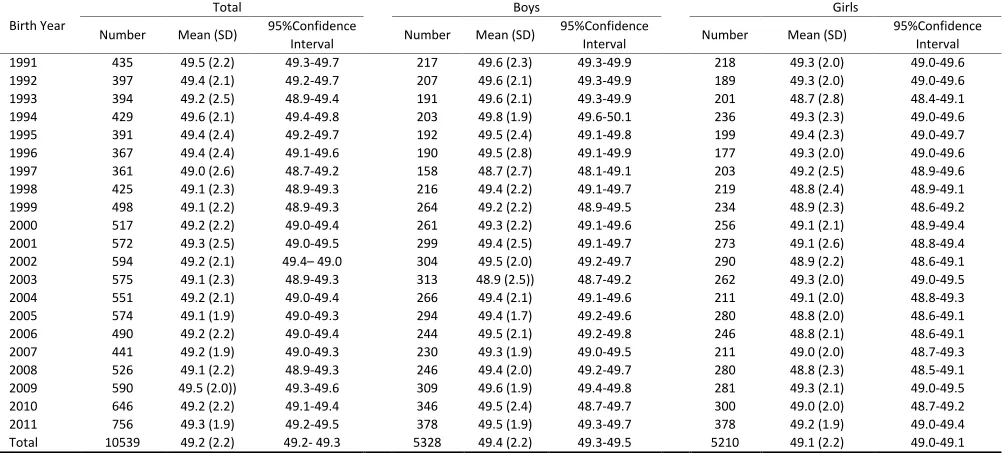
Tables 1 and 2 show the mean birth weight and height of
11,165 neonates born between 1991 and 2011. The mean birth weight and height of neonates during the total study period was 3186.8±468.4 g and 49.2±2.2 cm, respectively.
The birth weights increased by 0.4 g every year between 1991 and 2011; however, these annual changes were not statistically significant in the linear regression model. (Coefficient = 0.40, 95% CI= −1.04 to 1.85, P = 0.584). The regression coefficients were 0.09 (95% CI = −1.95 to 2.12, P = 0.934) for boys and 0.60 (95% CI = −1.44 to 2.64, P = 0.663) for girls (Figure 1).
Table 1.The birth weight mean of neonates in Shahroud, Iran, 1991-2011.
Birth year
Total Boys Girls
Number Mean (SD) 95% Confidence
Interval Number Mean (SD)
95% Confidence
Interval Number Mean (SD)
95% Confidence Interval 1991 455 3232.1 (444.1) 3191.2-3273.0 229 3272.1 (474.6) 3210.3-3333.9 226 3191.6 (408.0) 3138.1-3245.1 1992 417 3241.1 (461.4) 3196.7-3285.5 219 3256.5 (474.2) 3319.7–3193.4 197 3227.5 (446.0) 3164.8-3290.2 1993 417 3164.8 (486.2) 3118.0-3211.6 202 3213.1 (500.9) 3282.6-3143.6 215 3119.4 (468.6) 3056.4-3182.4 1994 470 3180.5 (464.1) 3138.4-3222.6 220 3216.7 (465.1) 3154.9-3278.5 250 3148.6 (461.9) 3091.1-3206.1 1995 408 3209.9 (482.4) 3162.9-3256.9 199 3187.7 (474.1) 3121.4-3254.0 209 3231.1 (490.5) 3164.2-3297.9 1996 417 3225.8 (445.1) 3183.0-3268.7 214 3260.9 (458.4) 3199.1-3322.7 203 3188.9 (428.7) 3129.5-3248.2 1997 482 3185.4 (464.9) 3143.8-3227.1 223 3163.5 (463.5) 3102.3-3224.4 259 3204.4 (466.2) 3147.3-3261.4 1998 450 3169.5 (496.1) 3123.5-3215.5 229 3244.6 (462.9) 3184.6-3305.1 221 3091.4 (518.0) 3022.8-3160.1 1999 534 3124.9 (467.4) 3085.1-3164.6 283 3202.7 (418.4) 3153.7-3251.6 251 3037.2 (503.8) 2974.6-3099.8 2000 557 3129.7 (485.7) 3089.3-3170.1 278 3178.8 (528.8) 3116.3-3241.2 278 3080.8 (434.6) 3029.5-3132.2 2001 591 3139.4 (501.6) 3098.9-3180.0 311 3150.3 (525.0) 3091.7-3208.8 280 3127.4 (474.9) 3071.5-3183.3 2002 612 3148.3 (486.0) 3109.7-3186.9 314 3167.3 (485.4) 3113.4-3221.2 298 3128.2 (486.7) 3072.8-3183.7 2003 589 3159.4 (479.7) 3120.6-3198.3 317 3145.8 (483.1) 3092.4-3199.2 272 3175.3 (476.2) 3118.4-3232.1 2004 578 3207.1 (465.9) 3169.1-3245.2 283 3257.6 (461.5) 3203.6-3311.6 295 3158.7 (465.6) 3105.4-3212.1 2005 604 3207.0 (453.4) 3170.8-3243-2 308 3212.2 (421.2) 3164.9-3259.4 296 3202.6 (485.2) 3146.1-3257.1 2006 522 3199.7 (466.2) 3159.6-3239.8 259 3266.9 (459.7) 3210.6-3323.1 263 3133.6 (464.0) 3077.3-3190.0 2007 464 3212.8 (444.5) 3172.2-3253.3 242 3227.5 (426.6) 3173.5-3281.5 222 3196.8 (463.7) 3135.4-3258.1 2008 547 3174.5 (483.6) 3133.9-3215.2 256 3199.8 (480.1) 3140.7-3258.9 291 3152.3 (486.4) 3096.2-3208.5 2009 617 3259.4 (436.3) 3224.9-3293.9 321 3319.8 (428.9) 3272.2-3366.9 296 3193.9 (435.6) 3144.0-3243.7 2010 667 3172.7 (466.1) 3137.2-3208.1 357 3178.9 (477.6) 3129.2-3228 310 3165.5 (453.0) 3114.9-3216.2 2011 768 3204.1 (436.9) 3173.1-3235.0 384 3219.3 (438.4) 3175.3-3263.3 383 3188.8 (435.5) 3145.1-3232.6 Total 11165 3186.8 (468.4) 3178.2-3195.5 5648 3214.5 (468.8) 3202.3-3226.8 5515 3158.6 (466.3) 3146.3-3170.9 SD, Standard Deviation
Table 2. The birth height mean of neonates in Shahroud, Iran, 1991-2011
Birth Year
Total Boys Girls
Number Mean (SD) 95%Confidence
Interval Number Mean (SD)
95%Confidence
Interval Number Mean (SD)
International Journal of Health Studies 2016;2(3) | 16
Notably, a slight annual decrease in birth height was observed between 1991 and 2011, and this decrease was more marked for girls. This change was not statistically significant in the linear regression model. (Coefficient = −0.006, 95% CI= −0.013 to 0.002, P = 0.129). Subgroup analysis revealed that neonatal height in girls decreased more than boys at birth, although both were not statistically significant (coefficient = −0.003, 95% CI = −0.01 to 0.007, P = 0.556 for boys; Coefficient = −0.009, 95% CI = −0.02 to 0.001, P = 0.088 for girls) (Figure 2).
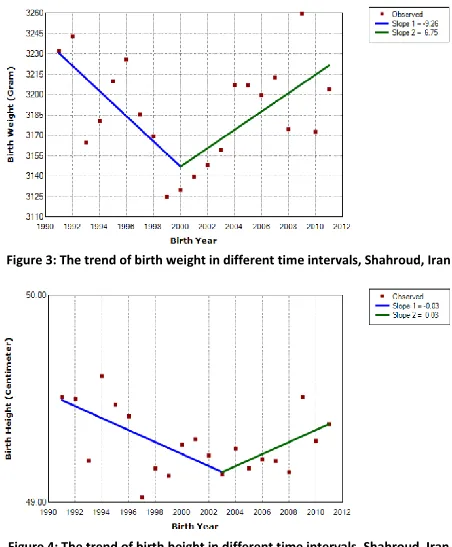
Furthermore, an analysis by joinpoint regression revealed that birth weight decreased by 9.26 g annually between 1991 and 2000 (P = 0.041) and then increased by 6.75 g every year till 2011 (P = 0.021) (Figure 3). A similar analysis for infant birth height shows that birth height decreased by 0.03 cm between 1991 and 2003 (P = 0.018) and then increased by the same amount annually till 2011 (P = 0.093) (Figure 4). The increase in birth height of infants between 2003–2011 and 1991–2003 was statistically significant (P = 0.009).
Table 3. The relationship between birth weight and other variables in Shahroud, Iran, 1991-2011
Independent variables
Simple linear regression Coefficient
95% Confidence
Interval P.V
Multiple linear regression Coefficient
95% Confidence Interval P.V
Year of birth 0.4 -1.1, 2.0 0.608 1.1 -1.4 ,3.6 0.366 Gender
- Boy Reference - - - - -
- Girl -55.9 -83.2 , -28.6 <0.001 -58.0 -30.8 , -85.1 <0.001 Mother’s education 0.3 -3.1 , 3.8 0.840 2.1 -1.9 , 6.2 0.290
Father’s education 1.2 -2.4 , 4.9 0.489 2.5 -2.8, 7.9 0.343
Mother’s Job
- Housekeeper Reference - - - - -
- Employed -1.2 -32.3 , 29.9 0.937 -13.3 -44.0, 17.2 0.377 Number of prenatal care 0.5 -4.5 , 5.7 0.818 1.1 -4.5, 6.8 0.677 Number of twin -713.3 -816.7 , -610.0 <0.001 -699.6 -793.1 , -606.1 <0.001 Pregnancy duration
- ≥5. week Reference - - - - -
- <37 week -680.5 -1079.2 , -281.8 0.002 -643.0 -1021.3 , -264.7 0.002 Type of delivery
- Normal delivery Reference - - - - -
- Caesarean 21.2 -3.5 , 46.0 0.09 33.8 8.6 , 59.1 0.011 Maternal age 4.0 1.8 , 6.1 <0.001 0.1 -3.1, 3.4 0.922
Birth order
1 Reference - - - - -
2 55.0 45.4 , 64.6 <0.001 58.0 36.3 , 79.7 <0.001 3 71.2 50.3 , 92.1 <0.001 94.9 57.0 , 132.8 <0.001 4 115.6 80.1 , 151.1 <0.001 142.7 90.9 , 194.5 <0.001
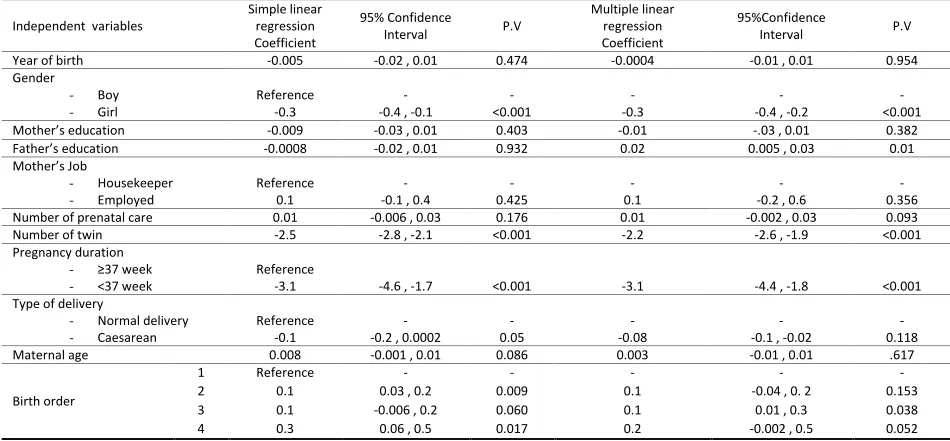
Table 4. The relationship between birth height and other variables in Shahroud, Iran,1991-2011
Independent variables
Simple linear regression Coefficient
95% Confidence
Interval P.V
Multiple linear regression Coefficient
95%Confidence
Interval P.V
Year of birth -0.005 -0.02 , 0.01 0.474 -0.0004 -0.01 , 0.01 0.954 Gender
- Boy Reference - - - - -
- Girl -0.3 -0.4 , -0.1 <0.001 -0.3 -0.4 , -0.2 <0.001
Mother’s education -0.009 -0.03 , 0.01 0.403 -0.01 -.03 , 0.01 0.382
Father’s education -0.0008 -0.02 , 0.01 0.932 0.02 0.005 , 0.03 0.01 Mother’s Job
- Housekeeper Reference - - - - -
- Employed 0.1 -0.1 , 0.4 0.425 0.1 -0.2 , 0.6 0.356 Number of prenatal care 0.01 -0.006 , 0.03 0.176 0.01 -0.002 , 0.03 0.093 Number of twin -2.5 -2.8 , -2.1 <0.001 -2.2 -2.6 , -1.9 <0.001 Pregnancy duration
- ≥5. week Reference
- <37 week -3.1 -4.6 , -1.7 <0.001 -3.1 -4.4 , -1.8 <0.001 Type of delivery
- Normal delivery Reference - - - - -
- Caesarean -0.1 -0.2 , 0.0002 0.05 -0.08 -0.1 , -0.02 0.118 Maternal age 0.008 -0.001 , 0.01 0.086 0.003 -0.01 , 0.01 .617
Birth order
1 Reference - - - - -
Figure 1: The predicted mean for birth weight according to gender and birth year, Shahroud, Iran
Figure 2: The predicted mean for birth height according to gender and birth year, Shahroud, Iran
As shown in Table 3, the mean weight of girls at birth was 58 g lower than that of boys (P < 0.001). The mean birth weight of premature neonates was 643 g lower than (P = 0.002) that of term neonates. The second, third, fourth, and subsequent children of families were respectively 58, 94.9, and 142.7 g heavier than the first born child (P < 0.001). It was also observed that during each pregnancy pertaining to twins, the average birth weight decreased by 699.6 g (P < 0.001).
As shown in Table 4, the average birth height of girls was 0.3 cm lower than that of boys (P < 0.001). Preterm neonates were 3.1 cm shorter on average than term infants (P < 0.001). The mean height of neonates decreased by 2.2 cm for each pair of twins (P < 0.001).
Discussion
Our findings revealed the mean birth weight and height of Iranian neonates in the 1991–2011 period was 3186.8 g and 49.2 cm, respectively. While investigating the secular trends from 1991 to 2011, we found no significant differences. When compared to the 1991–2000/2003 period, the average weight and height of
infants at birth in the 2000/2003–2011 period increased annually by 6.75 g and 0.03 cm, respectively.
The absence of a linear trend over the 21-year study period (1991–2011) may be explained by the decrease in birth weight during the 1991–2000 period with that compared to the 2000– 2011 period (Figure 3). In the case of length, the observed decrease in trend within the interval 1991–2003, compensate the increase in birth length till 2011 (Figure 4).
Several studies from different parts of the world reveal that neonatal birth weight continually changes over time. Average birth weight in Montreal, Canada, decreased by 400 g during the 1850–1900 period,19 whereas in Vietnam, the height and weight at birth increased to 1.3 cm and 190 g, respectively, from early 1980 to 1997/1998.2,8
In Denmark, from 1970 to 2000, the infant body size at birth increased; weight and height at birth increased by 5 g and 2.4 mm every year, respectively. Similarly, an increase in birth height and weight was also observed in Sweden, Canada, and Norway.17,20,21
A meta-analysis conducted in Iran in 2012 showed that birth height did not change significantly during the 1971–2010 period, but birth weight decreased by 8.1 g.22 Considering that this meta-analysis included several studies in which birth heights and weights were estimated in different areas over a short time period, the possibility that various factors may influence its results should be taken into consideration.
The weight and height of boys at birth exceeded those of girls by 58 g and 0.3 cm, respectively. Studies in Europe, Iran, Japan, Canada, Africa, Australia, China, and Russia showed that weight, length, head circumference, and chest circumference of boys are generally higher than those of girls.1,2,7,11,12,18
Figure 3: The trend of birth weight in different time intervals, Shahroud, Iran
International Journal of Health Studies 2016;2(3) | 18
Notably, the parameters of population growth may change positively or negatively over generations. In some populations the secular trend stops, or no trend is observed.5,7 Therefore, to explore the causes leading to any change, it is essential to collect sufficient data on the environmental, health, and welfare conditions of the communities.
This study has some limitations. First, in the time period covered by this study, nurses and midwives measured birth heights and weights of neonates using different tools, which may have affected the results. Second, some information is missing as it was not recorded in the household health records.
Despite these limitations, our study offers advantages such as a high sample size, high power, and appropriate duration of investigation. In addition, because Shahroud district can be considered as a representative for the Iranian population, the results of this study can be generalized to the whole country; however, further studies may be necessary.
In this study, we did not observe a linear trend for infant birth height and weight between 1991 and 2011. Nevertheless, we observed some changes while comparing the time intervals, indicating improvement in birth weight and height after 2000. To determine the associated factors responsible for the decrease and increase in birth height and weight and to find out obvious reasons and reasonable conclusions, factors such as nutrition, socioeconomic status of the family and society, mother’s body mass index, and weight gain during pregnancy should also be considered.
Acknowledgement
This study was supported by Shahroud University of Medical Sciences and Tehran University of Medical Sciences as an MSc thesis.
Conflict of Interest
The authors declare that they have no conflict of interests.
References
1. Zhang Y, Wang S. Secular trends in growth and body proportion among children and adolescents from 1985 to 2005 in Shandong, China. Anthropological Science 2009;117:69–76. doi:10.1537/ase.080520
2. Tretyak A, Godina E, Zadorozhnaya L. Secular trends of sizes at birth in Russian infants born between 1987 and 2002. J Physiol Anthropol Appl Human Sci 2005;24:403–6. doi:10.2114/jpa.24.403
3. Özer BK. Secular trend in body length and weight of Turkish adults. Anthropological Science 2008;116:191–199. doi:10.1537/ase.061213
4. Mohammd K, Hosseini M, Noorbala A. Secular trends in growth (weight and length) of children in Iran over a decade (1990-1991 to 1999). Hakim Research Journal 2006;9:1–18.
5. Cole TJ. The secular trend in human physical growth: a biological view. Econ Hum Biol 2003;1:161–8. doi:10.1016/S1570-677X(02)00033-3
6. Cole TJ. Secular trends in growth. Proc Nutr Soc 2000;59:317–24.
doi:10.1017/S0029665100000355
7. Ayatollahi S, Pour-Ahmad S, Shayan Z. Secular trends in growth among school children of Shiraz (Southern Iran) born in the post-warPeriod. Med J Islam Repub Iran 2006;20:141–6.
8. Hop le T. Secular trend in size at birth of Vietnamese newborns during the last 2 decades (1980-2000). Asia Pac J Clin Nutr 2003;12:266–70.
9. Oishi K, Honda S, Takamura N, Kusano Y, Abe Y, Moji K, et al. Secular trends of sizes at birth in Japanese healthy infants born between 1962 and 1988. J Physiol Anthropol Appl Human Sci 2004;23:155–61.
doi:10.2114/jpa.23.155
10. Matsuda S, Sone T, Doi T, Kahyo H. Secular changes of the mean birth weight and the mean gestational day at an obstetric clinic in Naha. Nihon Eiseigaku Zasshi 1990;45:665–679.
11. Monteiro CA, Benicio MH, Ortiz LP. Secular trends in birth weight in S. Paulo city, Brazil (1976-1998). Rev Saúde Pública 2000;34:26–40.
doi:10.1590/S0034-89102000000700006
12. Hokama T, Binns C. Trends in the prevalence of low birth weight in Okinawa, Japan: a public health perspective. Acta Paediatr 2009;98:242–6.
doi:10.1111/j.1651-2227.2008.01017.x
13. Lu Y, Zhang J, Lu X, Xi W, Li Z. Secular trends of macrosomia in southeast China, 1994-2005. BMC Public Health 2011;11:1-9. doi: 10.1186/1471-2458-11-818
14. Bergmann RL, Richter R, Bergmann KE, Plagemann A, Brauer M, Dudenhausen JW. Secular trends in neonatal macrosomia in Berlin: influences of potential determinants. Paediatr Perinat Epidemiol 2003;17:244–9.
doi:10.1046/j.1365-3016.2003.00496.x
15. Lahmann PH, Wills RA, Coory M. Trends in birth size and macrosomia in Queensland, Australia, from 1988 to 2005. Paediatr Perinat Epidemiol 2009;23:533–41. doi:10.1111/j.1365-3016.2009.01075.x
16. Schack-Nielsen L, Mølgaard C, Sørensen TI, Greisen G, Michaelsen KF.. Secular change in size at birth from 1973 to 2003: national data from Denmark. Obesity (Silver Spring) 2006;14:1257–63. doi:10.1038/oby.2006.143
17. Wen SW, Kramer MS, Platt R, Demissie K, Joseph KS, Liu S, et al. Secular trends of fetal growth in Canada, 1981 to 1997. Paediatr Perinat Epidemiol 2003;17:347–54. doi:10.1046/j.1365-3016.2003.00513.x
18. Rosenberg M. Birth weights in three Norwegian cities,1860-1984. Secular trends and influencing factors. Ann Hum Biol 1998;15:275–88.
19. Ward WP, Ward PC. Infant birth weight and nutrition in industrializing Montreal. Am Hist Rev 1984;89:324–45. doi:10.2307/1862555
20. Skjaerven R, Gjessing HK, Bakketeig LS. Birthweight by gestational age in Norway. Acta Obstet et Gynecol Scand 2000;79:440–9.
21. Odlind V, Haglund B, Pakkanen M, Otterblad Olausson P. Deliveries, mothers and newborn infants in Sweden, 1973–2000. Acta Obstet et Gynecol Scand 2003;82:516–28.
22. Mirmiran P, Moslehi N, Asghari G, Jambarsang S, Mehrabi Y, Azizi F. Secular trends in size at birth of Iranian neonates: meta-analyses of published and unpublished studies. Ann Hum Biol 2013;40:75–82.