DEMOGRAPHIC RESEARCH
VOLUME 30, ARTICLE 7, PAGES 227-252
PUBLISHED 23 JANUARY 2014
http://www.demographic-research.org/Volumes/Vol30/7/ DOI: 10.4054/DemRes.2013.30.7
Research Article
Performance-based measures of physical
function as mortality predictors:
Incremental value beyond self-reports
Noreen Goldman
Dana A. Glei
Luis Rosero-Bixby
Shu-Ti Chiou
Maxine Weinstein
© 2014 Goldman, Glei, Rosero-Bixby, Chiou & Weinstein.
This open-access work is published under the terms of the Creative Commons Attribution NonCommercial License 2.0 Germany, which permits use, reproduction & distribution in any medium for non-commercial purposes, provided the original author(s) and source are given credit.
1 Introduction 228
2 Background 230
3 Materials and methods 231
3.1 Data 231
3.2 Measures 232
3.2.1 Mortality 232
3.2.2 Measures of physical function 233
3.2.3 Control variables 234
3.3 Analytical strategy 234
4 Results 236
5 Discussion 244
6 Acknowledgments 246
Performance-based measures of physical function as
mortality predictors:
Incremental value beyond self-reports
Noreen Goldman1
Dana A. Glei2
Luis Rosero-Bixby3
Shu-Ti Chiou4
Maxine Weinstein5
Abstract
BACKGROUND
Although previous studies have indicated that performance assessments strongly predict future survival, few have evaluated the incremental value in the presence of controls for self-reported activity and mobility limitations.
OBJECTIVE
We assess and compare the added value of four tests walking speed, chair stands, grip strength, and peak expiratory flow (PEF) for predicting all-cause mortality.
METHODS
Using population-based samples of older adults in Costa Rica (n = 2290, aged 60+) and Taiwan (n = 1219, aged 53+), we estimate proportional hazards models of mortality for an approximate five-year period. Receiver Operator Characteristic (ROC) curves are used to assess the prognostic value of each performance assessment.
1 Office of Population Research, Princeton University, 243 Wallace Hall, Princeton, NJ., USA.
E-Mail: [email protected].
2 Corresponding author. Center for Population and Health, Georgetown University, 5985 San Aleso Court,
Santa Rosa, CA. Phone: (707) 539-5592. Fax: (707) 978-3213. E-Mail: [email protected].
3 University of Costa Rica, Centro Centroamericano de Población, San Pedro, Costa Rica.
E-Mail: [email protected].
4 Bureau of Health Promotion, Department of Health, No. 2, Changqing St, Xinzhuang District, New Taipei
City 24250, Taiwan (R.O.C.). E-Mail: [email protected].
School of Medicine, National Yang-Ming University, Taiwan (ROC). E-mail: [email protected].
5
RESULTS
Self-reported measures of physical limitations contribute substantial gains in mortality prediction, whereas performance-based assessments yield modest incremental gains. PEF provides the greatest added value, followed by grip strength. Our results suggest that including more than two performance assessments may provide little improvement in mortality prediction.
CONCLUSIONS
PEF and grip strength are often simpler to administer in home interview settings, impose less of a burden on some respondents, and, in the presence of self-reported limitations, appear to be better predictors of mortality than do walking speed or chair stands.
COMMENTS
Being unable to perform the test is often a strong predictor of mortality, but these indicators are not well-defined. Exclusion rates vary by the specific task and are likely to depend on the underlying demographic, health, social and cultural characteristics of the sample.
1. Introduction
The process linking chronic and acute health conditions to disability has been conceptualized as a progression through four stages: (1) pathology; (2) substantial impairments; (3) functional limitations (restrictions in basic physical or mental performance); and (4) disability (difficulties in various activities of daily life, Verbrugge and Jette 1994). Measures associated with these stages have provided researchers and health professionals with valuable indicators of the current and future health status of community-dwelling populations of older adults. Population-based surveys frequently include measures of the disablement process, either from self-reports or as interviewed-administered performance tests. Although these two types of measures often labeled ―subjective‖ and ―objective‖ respectively are statistically correlated, they are thought to capture distinct constructs (Reuben et al. 2004). Nevertheless, both self-reports and performance tasks have been shown to predict subsequent deterioration in health in diverse settings (Bernard et al. 1997; Cooper et al. 2010; Ferrucci et al. 1991; Gill, Robison, and Tinetti 1998; Guralnik et al. 1995; Guralnik et al. 2000; Reuben, Siu, and Kimpau 1992; Tinetti et al. 1995).
one’s arms. These indicators are easy to collect, inexpensive, and focus on behaviors that are clinically relevant and signal the need for caregiving (Reuben et al. 2004). Although the subjective component of self-reports may capture information of prognostic value, self-reports are likely to be biased by myriad factors (e.g., environmental conditions, cultural preferences, or attitudes) that impede comparisons across populations or subgroups (Melzer et al. 2004) and, given their focus on functional limitations and especially disability, they are unlikely to identify individuals in the early stages of impairment (Reuben et al. 2004). Still, they may be better suited than performance tests to assess individuals’ interactions with their immediate environments and the associated constraints.
Performance assessments, such as grip strength, peak expiratory flow (PEF), chair stands, and walking speed, are largely determined by physiological functions that typically decline with age and may underlie frailty (Cooper et al. 2010). Specifically, walking speed and chair stands reflect lower limb strength and mobility, grip strength is a marker of overall muscle strength, and peak expiratory flow is an indicator of lung capacity and airway obstruction. These measurements are considered to have greater face validity and perhaps reliability than self-reports, and are likely to be more sensitive to changes over time, more comparable across different contexts, and better suited to capturing variation across a wide continuum of physical function including early stages of impairment (Guralnik et al. 1989; Guralnik et al. 1994; Myers et al. 1993); some suggest that they provide ―preclinical‖ detection of functional decline (Reuben et al. 2004). The predictive power of performance assessments for future health outcomes likely results from bi-directional pathways. For example, not only do poor performance measures appear to be causally related to increased risks of injury and the onset of disability, but a history of chronic disease and malnutrition is often the source of these physical impairments (Fried and Guralnik 1997). Despite their utility in health surveys, performance assessments come at a cost, not only a monetary cost, rather they also place a burden on the respondent and interviewer. The tests are time-consuming, require substantial effort for some older or weak respondents, need special equipment and space for administering, and may compromise response rates for the overall survey. Thus, the decision about whether to include them in home-based interviews is likely to depend on their added value beyond information captured by self-reports.
best quality prognostic indices for predicting survival (e.g., Lee et al. 2006; Schonberg et al. 2009) include physical function as a key indicator. Indeed, Swindell et al. (2010) found that five of the ten strongest predictors of mortality (among 377 predictors tested) were measures of physical function, including both self-reported and performance-based indicators.
Our primary objective in this paper is to ascertain the incremental improvement derived from performance tests beyond that provided by self-reported limitations in predicting mortality. Our secondary objectives are to determine whether some performance assessments are stronger predictors than others and whether their predictive power persists with controls for self-reported disease status. As biodemographic surveys increasingly incorporate performance tests into household visits, it is important to evaluate the net contribution of these assessments for predicting survival. To assess the robustness of our findings, we use data from two population-based surveys of older adults that collected similar information in Taiwan and in Costa Rica. Although we have no reason to expect the relationship to differ between these countries, replication of the results in different settings may strengthen our inferences.
2. Background
There has been little research addressing the central questions in this analysis. Few studies predicting all-cause mortality in a general population of older adults include both self-reported and performance-based assessments of physical function. Almost all existing studies are based in high income countries – primarily the US (Al Snih et al. 2002; Cook et al. 1991; Guralnik et al. 1994; Hardy et al. 2007; Markides et al. 2001; Melzer, Lan, and Guralnik 2003; Reuben et al. 2004), but also Italy (Cesari et al. 2008) and Australia (Simons et al. 2011). Two exceptions are a study in China (Feng et al. 2010) and another in Costa Rica (Rosero-Bixby and Dow 2012).
which replaces balance stands with PEF (Melzer, Lan, and Guralnik 2003). Only two of these studies evaluate all of the underlying individual tests as predictors of mortality (Cesari et al. 2008; Markides et al. 2001).
Despite variation in the measures collected and in the lengths of follow-up, most studies find that performance tests predict mortality net of self-reported limitations. However, perhaps because of variations in study design, researchers disagree about which tests best predict mortality. For example, Cesari et al. (2008) report chair stands to be the strongest component of the SPPB in predicting mortality, whereas several earlier studies identify walking speed (Al Snih et al. 2002; Markides et al. 2001; Ostir et al. 2007). Rosero-Bixby and Dow (2012) find grip strength to be the strongest predictor of mortality in women, whereas PEF is the best predictor in men; walking speed is only marginally significant net of the other covariates. Most studies that have examined grip strength or PEF in combination with self-reports include few, if any, additional performance assessments, making it difficult to evaluate these two measures vis-à-vis the others.
Our study extends the existing literature in two important ways. First, we examine whether previous findings, based mostly on the US, pertain to two middle income countries: Taiwan and Costa Rica. Second, we consider a set of four performance tests to assess whether chair stands or timed walks – as some earlier work suggests – are the strongest predictors of mortality, or whether grip strength or PEF, which are often not part of the most frequently used batteries of tests, perform as well or better. We hypothesize that grip strength and PEF may perform better because they are likely to be less correlated with the lower extremity functions captured by the self-reports.
3. Materials and methods
3.1 Data
The data come from the first wave of the Costa Rican Study on Longevity and Healthy Aging (CRELES) and the second wave of the Social Environment and Biomarkers of Aging Study (SEBAS). In both surveys, an interview conducted in the respondent’s home included questions related to health and a series of performance-based assessments. SEBAS and CRELES included informed consent from all participants and received ethical approval from the human subjects committees at the institutions conducting the studies.
database using a multi-stage sampling design. For this analysis, we use data from the first wave conducted between November 2004 and September 2006. Interviews were completed by 2827 respondents (85 per cent of survivors located).
The SEBAS cohort represents a random subsample of participants in the nationally representative Taiwan Longitudinal Study of Aging (TLSA); elderly persons and urban residents were oversampled. The TLSA began in 1989 and younger refresher cohorts were added in 1996 and 2003; all three cohorts were selected randomly using a multi-stage sampling design. The sampling frame for the 2006 SEBAS included: a) an older cohort (aged 60+) of respondents from the 1999 wave of TLSA who completed the 2000 SEBAS medical examination, and b) a younger cohort (aged 5360) of respondents first interviewed in the 2003 wave of TLSA. Interviews were completed by 1284 respondents aged 53 and older in 2006 (87% response rate). Additional details are provided elsewhere (Chang et al. 2012).
3.2 Measures
With the exception of mortality, all measures come from the first wave of CRELES (20042006) and the second wave of SEBAS (2006).
3.2.1 Mortality
3.2.2 Measures of physical function
We include two self-reported measures of physical function. Limitations with activities of daily living (ADL) are based on five ADLs (bathing; eating; toileting; moving around the house; getting out of bed). We count the number of ADLs (05) that the respondent reported difficulty performing. The measure of mobility limitations counts the number of mobility tasks (04) that the respondent reported difficulty performing. Three of these tasks were similar in both countries (i.e., walking; climbing stairs; raising his/her arms). In Costa Rica, respondents were asked to demonstrate whether they could lift their arms above their shoulders; those who did not attempt the activity are coded as missing. In Taiwan, difficulty raising both hands over the head was based on self-reports. The fourth self-reported function differed between Costa Rica (i.e., pushing or pulling a large object such as a recliner chair) and Taiwan (i.e., lifting or carrying 1112 kg). In Costa Rica, respondents who reported that they ―do not do that activity‖ were coded as missing; this response category was not an option in Taiwan.
Four health assessments were administered by trained interviewers: grip strength, PEF, timed walk, and chair stands. In each case, the test was coded as missing if the respondent refused (or in the case of SEBAS, was unable to understand the instructions or there was equipment failure).
Grip strength (in kg) was measured using a dynamometer (CRELES: Creative Health Products dynamometer [model T-18]; SEBAS: North CoastTM hydraulic hand dynamometer [NC70142]); we used the highest level from two trials on the dominant hand in CRELES and three trials on each hand in SEBAS. The respondent was coded as ―unable‖ to perform the test if s/he: a) met the exclusion criteria for both hands; b) tried but was unable to do the test; c) did not attempt the test for safety reasons; d) (in CRELES only) was not tested because of disability; e) (in SEBAS only) did not attempt the test because of weakness, stroke, or frailty or stopped because of pain or discomfort. The exclusion criteria included: surgery on hand/wrist/arm in the past three months and (in SEBAS only) recent injury, worsening pain, swelling, inflammation, or severe pain in the hand/wrist.
To measure walking speed (m/sec), the respondents were asked to walk three meters at their normal speed. The respondent started from a sitting position in CRELES and a standing position in SEBAS. CRELES included one trial; SEBAS conducted two trials (we used the faster of the two). The respondent was coded as ―unable‖ to complete the test if s/he: a) tried but was unable to do the test; b) did not attempt the test for safety reasons; or c) (in CRELES only) reported any problem that would impair him/her from doing a mobility and flexibility test.
For the chair stand test, the respondent was asked to stand up and sit down again five times in a row as quickly as possible without stopping while keeping his/her arms folded across his/her chest. For those able to complete five stands, the completion time was recorded. To adjust for differences in chair height, we regressed the completion time (ci) for individual i on chair height (hi) controlling for the respondent’s age and
height (SEBAS)/knee height (CRELES), with models fit separately by sex (Cornman et al. 2011). The adjusted completion time was calculated as c~icis(hhi), where s
was the coefficient for hi from the sex-specific model and h was the mean chair height
among the pooled sample (44.5 cm). Chair stand speed was computed as five divided by the adjusted time ci
~ (Cornman et al. 2011). The respondent was coded as ―unable‖
to perform the test if s/he: a) met the exclusion criteria (CRELES: reported any problem that would impair him/her from doing a mobility and flexibility test; SEBAS: was in a wheelchair); b) tried but was unable to complete five stands, or c) did not attempt the test for safety reasons.
3.2.3 Control variables
All models include controls for age, sex, education, and urban residence. In auxiliary analyses, we also control for several other variables that may be associated with both physical function and mortality: self-reported measures of specific health conditions (i.e., cancer, heart disease, diabetes, stroke, respiratory disease, arthritis, hypertension); smoking status (never, former, current); exercise (3+ times per week); and hospitalization in the past year.
3.3 Analytical strategy
in SEBAS). Exclusion of these respondents leaves an analysis sample of 2290 for Costa Rica and 1219 for Taiwan. In order to ascertain the robustness of the results to the treatment of missing data, we use multiple imputation to re-estimate the final models for the full samples.
Descriptive statistics are weighted to account for oversampling and for differential response rates by age, sex, and other covariates. Survival models are fit separately by country using unweighted data. We estimate age-specific mortality using a Gompertz proportional hazards model with time measured in terms of age. The Gompertz function assumes that the force of mortality increases exponentially with age and generally fits very well at older ages (Horiuchi and Coale 1982). In initial tests (not shown), the age slope of mortality (γ) did not differ significantly by sex in these samples.
Some of the performance tests are strongly correlated with one another (e.g., among those with measurements, the Pearson correlations between grip strength and PEF are 0.60 in CRELES and 0.65 in SEBAS, and correlations between walking speed and chair stand speed are 0.37 in CRELES and 0.51 in SEBAS). Thus, we model the performance assessments individually as well as jointly. Our models are fit in two stages. First, we estimate a model that includes only self-reported ADL and mobility limitations in addition to sociodemographic controls. Next, we fit a series of models that add a performance test, with a categorical specification: those unable to perform a given test are assigned a separate category, and the remaining responses are recoded into quartiles based on the weighted distribution of the pooled samples. These models are not designed to reflect causal processes but rather to evaluate the prognostic value of performance assessments over and above that of self-reported measures of physical function.
Finally, to help gauge the magnitude of the association with mortality, we calculate the predicted probability of dying between exact ages 70 and 75 (5qˆ70) for selected levels of performance. This age interval corresponds roughly to the mean age at the time of the survey (69.3) and at the end of follow-up (74.3) for the pooled sample (weighted). These probabilities are estimated by setting the selected performance assessment at the specified value, fixing all other covariates at the weighted mean for the pooled sample, and using the model coefficients to predict the probability of dying between exact ages 70 and 75 (see Supplementary Material for details). For each performance test, we provide two sets of predicted probabilities. The first is based on a model that includes only the selected performance assessment and sociodemographic controls, thus representing the ―gross effect‖ without adjusting for any other measures of physical function. The second is based on a model that includes all physical function measures (both self-reported and performance-based) in addition to control variables and thus, represents the ―net effect‖ after adjusting for the effects of all other measures of physical function.
4. Results
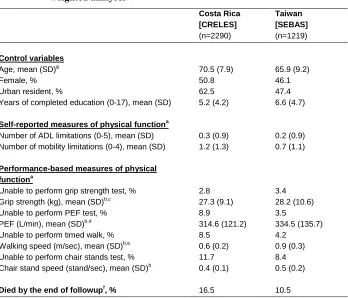
Table 1: Descriptive statistics for all analysis variables, by country, weighted analyses
Costa Rica [CRELES]
(n=2290)
Taiwan [SEBAS]
(n=1219)
Control variables
Age, mean (SD)a 70.5 (7.9) 65.9 (9.2)
Female, % 50.8 46.1
Urban resident, % 62.5 47.4
Years of completed education (0-17), mean (SD) 5.2 (4.2) 6.6 (4.7)
Self-reported measures of physical functiona
Number of ADL limitations (0-5), mean (SD) 0.3 (0.9) 0.2 (0.9)
Number of mobility limitations (0-4), mean (SD) 1.2 (1.3) 0.7 (1.1)
Performance-based measures of physical functiona
Unable to perform grip strength test, % 2.8 3.4
Grip strength (kg), mean (SD)b,c 27.3 (9.1) 28.2 (10.6)
Unable to perform PEF test, % 8.9 3.5
PEF (L/min), mean (SD)b,d 314.6 (121.2) 334.5 (135.7)
Unable to perform timed walk, % 8.5 4.2
Walking speed (m/sec), mean (SD)b,e 0.6 (0.2) 0.9 (0.3)
Unable to perform chair stands test, % 11.7 8.4
Chair stand speed (stand/sec), mean (SD)b 0.4 (0.1) 0.5 (0.2)
Died by the end of followupf, % 16.5 10.5
ADL, Activities of Daily Living; PEF, peak expiratory flow
a
Measured at the first wave of CRELES (2004-2006) and the second wave of SEBAS (2006).
b
Among those able to complete the test.
c
Maximum from trials on both hands except for n=8 in CRELES and n=46 in SEBAS who did not complete trials on both hands.
d
Maximum from three trials except for n=7 in CRELES and n=13 in SEBAS who completed only one or two trials.
e
In SEBAS, n=12 walked only 2-2.5m because of space limitations in the respondent’s home; walking speed was calculated based on the distance actually walked.
f
Follow-up ended on January 1, 2011 for CRELES and June 30, 2011 for SEBAS. In CRELES, a few foreigners (n=49) were censored early, at the date of last contact. The unweighted number of deaths was 579 in CRELES and 140 in SEBAS.
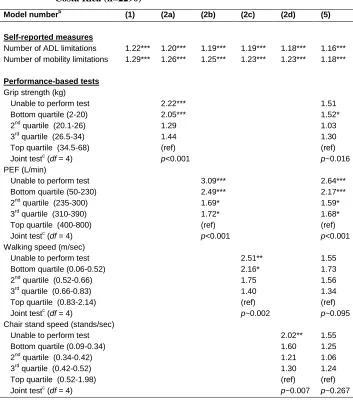
parameters for a given assessment) indicate that each of the four performance tests is significantly associated with mortality in Costa Rica, but only grip strength and PEF are significantly associated with mortality in Taiwan. The fact that the sample size in Costa Rica is more than twice that in Taiwan accounts for the significance of some estimates for Costa Rica even when the magnitudes of the hazard ratios are similar to or smaller than the corresponding values in Taiwan.
The hazard ratios are substantially attenuated when all performance tests are included in a single model (Model 5, Tables 2 and 3). Grip strength and PEF continue to be significantly related to mortality in both countries, but walking speed and chair stand speed are not. Being unable to perform the PEF test is a particularly strong predictor of mortality (HR=2.6 in Costa Rica; HR=5.2 in Taiwan relative to those in the top quartile). Poor PEF performance (bottom quartile) also strongly predicts mortality in both countries (HRs>2). In addition to the models presented in Tables 2 and 3, we estimated an auxiliary model that includes controls for specific health conditions, smoking, exercise, and hospitalization. Although the coefficients for PEF weaken slightly with the inclusion of these variables, both PEF and grip strength remain strong predictors of mortality (results not shown). We also used multiple imputation to re-estimate these same models for the full samples (n=2827 in Costa Rica, n=1284 in Taiwan). The coefficients from these models are very similar to those shown in Tables 2 and 3.
Table 2: Hazard ratios from Gompertz model of age-specific mortalitya, Costa Rica (n=2290)
Model numberb (1) (2a) (2b) (2c) (2d) (5)
Self-reported measures
Number of ADL limitations 1.22*** 1.20*** 1.19*** 1.19*** 1.18*** 1.16***
Number of mobility limitations 1.29*** 1.26*** 1.25*** 1.23*** 1.23*** 1.18***
Performance-based tests
Grip strength (kg)
Unable to perform test 2.22*** 1.51
Bottom quartile (2-20) 2.05*** 1.52*
2nd quartile (20.1-26) 1.29 1.03
3rd quartile (26.5-34) 1.44 1.30
Top quartile (34.5-68) (ref) (ref)
Joint testc (df = 4) p<0.001 p~0.016
PEF (L/min)
Unable to perform test 3.09*** 2.64***
Bottom quartile (50-230) 2.49*** 2.17***
2nd quartile (235-300) 1.69* 1.59*
3rd quartile (310-390) 1.72* 1.68*
Top quartile (400-800) (ref) (ref)
Joint testc (df = 4) p<0.001 p<0.001
Walking speed (m/sec)
Unable to perform test 2.51** 1.55
Bottom quartile (0.06-0.52) 2.16* 1.73
2nd quartile (0.52-0.66) 1.75 1.56
3rd quartile (0.66-0.83) 1.40 1.34
Top quartile (0.83-2.14) (ref) (ref)
Joint testc (df = 4) p~0.002 p~0.095
Chair stand speed (stands/sec)
Unable to perform test 2.02** 1.55
Bottom quartile (0.09-0.34) 1.60 1.25
2nd quartile (0.34-0.42) 1.21 1.06
3rd quartile (0.42-0.52) 1.30 1.24
Top quartile (0.52-1.98) (ref) (ref)
Joint testc (df = 4) p~0.007 p~0.267
*** p<0.001, ** p<0.01, * p<0.05
a
All models control for sex, education, and urban residence.
b
Model numbers correspond to those presented in Table 4.
c
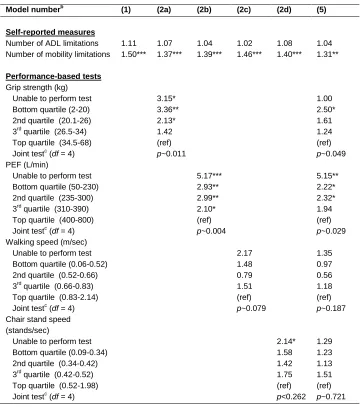
Table 3: Hazard ratios from Gompertz model of age-specific mortalitya, Taiwan (n=1219)
Model numberb (1) (2a) (2b) (2c) (2d) (5)
Self-reported measures
Number of ADL limitations 1.11 1.07 1.04 1.02 1.08 1.04
Number of mobility limitations 1.50*** 1.37*** 1.39*** 1.46*** 1.40*** 1.31**
Performance-based tests
Grip strength (kg)
Unable to perform test 3.15* 1.00
Bottom quartile (2-20) 3.36** 2.50*
2nd quartile (20.1-26) 2.13* 1.61
3rd quartile (26.5-34) 1.42 1.24
Top quartile (34.5-68) (ref) (ref)
Joint testc (df = 4) p~0.011 p~0.049
PEF (L/min)
Unable to perform test 5.17*** 5.15**
Bottom quartile (50-230) 2.93** 2.22*
2nd quartile (235-300) 2.99** 2.32*
3rd quartile (310-390) 2.10* 1.94
Top quartile (400-800) (ref) (ref)
Joint testc (df = 4) p~0.004 p~0.029
Walking speed (m/sec)
Unable to perform test 2.17 1.35
Bottom quartile (0.06-0.52) 1.48 0.97
2nd quartile (0.52-0.66) 0.79 0.56
3rd quartile (0.66-0.83) 1.51 1.18
Top quartile (0.83-2.14) (ref) (ref)
Joint testc (df = 4) p~0.079 p~0.187
Chair stand speed (stands/sec)
Unable to perform test 2.14* 1.29
Bottom quartile (0.09-0.34) 1.58 1.23
2nd quartile (0.34-0.42) 1.42 1.13
3rd quartile (0.42-0.52) 1.75 1.51
Top quartile (0.52-1.98) (ref) (ref)
Joint testc (df = 4) p<0.262 p~0.721
*** p<0.001, ** p<0.01, * p<0.05
a
All models control for sex, education, and urban residence.
b
Model numbers correspond to those presented in Table 4.
c
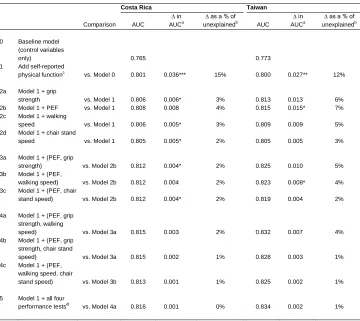
Table 4: Comparisons of the AUC for various models, by country
Costa Rica Taiwan
Comparison AUC
∆ in AUCa
∆ as a % of unexplainedb
AUC ∆ in AUCa
∆ as a % of unexplainedb
0 Baseline model (control variables
only) 0.765 0.773
1 Add self-reported physical functionc
vs. Model 0 0.801 0.036*** 15% 0.800 0.027** 12% 2a Model 1 + grip
strength vs. Model 1 0.806 0.006* 3% 0.813 0.013 6%
2b Model 1 + PEF vs. Model 1 0.808 0.008 4% 0.815 0.015* 7% 2c Model 1 + walking
speed vs. Model 1 0.806 0.005* 3% 0.809 0.009 5%
2d Model 1 + chair stand
speed vs. Model 1 0.805 0.005* 2% 0.805 0.005 3%
3a Model 1 + (PEF, grip
strength) vs. Model 2b 0.812 0.004* 2% 0.825 0.010 5%
3b Model 1 + (PEF,
walking speed) vs. Model 2b 0.812 0.004 2% 0.823 0.008* 4% 3c Model 1 + (PEF, chair
stand speed) vs. Model 2b 0.812 0.004* 2% 0.819 0.004 2% 4a Model 1 + (PEF, grip
strength, walking
speed) vs. Model 3a 0.815 0.003 2% 0.832 0.007 4%
4b Model 1 + (PEF, grip strength, chair stand
speed) vs. Model 3a 0.815 0.002 1% 0.828 0.003 1%
4c Model 1 + (PEF, walking speed, chair
stand speed) vs. Model 3b 0.813 0.001 1% 0.825 0.002 1%
5 Model 1 + all four performance testsd
vs. Model 4a 0.816 0.001 0% 0.834 0.002 1%
*** p<0.001, ** p<0.01, * p<0.05
a
The change (∆) in the AUC and associated significance level is based on a comparison with the model indicated.
b
The ∆ in the AUC as a percent of unexplained is computed as:
) 1 ( Model Model Model X X Y AUC AUC AUC
, where Model X is the comparison
model and Model Y is the current model.
c
This model is the same as Model 1 presented in Tables 2 and 3.
d
This model is the same as Model5 presented in Tables 2 and 3.
prediction. Based on the criterion of 0.01 to indicate a meaningful improvement in the AUC (Pencina et al. 2008), PEF appears to be a useful measure (the gain in AUC equaled 0.015 in Taiwan and was just below 0.01 in Costa Rica). Compared with PEF alone (Model 2b), the addition of each of the other three performance assessments (Models 3a3c) yields a similar increase in AUC in Costa Rica (0.004). In Taiwan, grip strength (Model 3a) and walking speed (Model 3b) lead to the largest increases in AUC, while chair stand speed results in a more modest improvement in AUC.
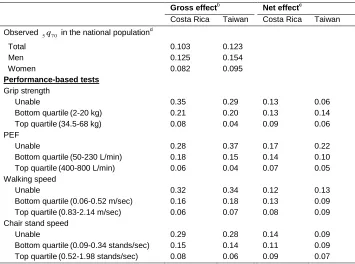
Table 5 shows the extent of variation in the predicted probability of dying between exact ages 70 and 75 (5qˆ70) by selected levels of performance on the physical assessments. Differences are particularly large for grip strength and PEF. For example, the gross effect for PEF (i.e., before adjusting for the effects of other measures of physical function) suggests that 28 per cent of Costa Ricans who were unable to perform the test would be expected to die between ages 70 and 75 compared with only 6 per cent of those in the top quartile; corresponding figures for Taiwan are 37 per cent vs. 4 per cent. After adjustment for the contribution of other physical function measures, the net effect for PEF is smaller, but remains substantial (Costa Rica: 17 per cent of unable vs. 7 per cent in the top quartile; Taiwan: 22 per cent vs. 5 per cent, respectively). Some of the differences are large even without considering those who were unable to complete the tests. For example, in both countries, the net effect of PEF on mortality is twice as high for those in the bottom compared with the top quartile.
Table 5: Predicted probability of dying between exact ages 70 and 75 (5qˆ7 0) for
selected levels of performance on the physical assessmentsa, by country
Gross effectb Net effectc
Costa Rica Taiwan Costa Rica Taiwan
Observed 5q7 0 in the national populationd
Total 0.103 0.123
Men 0.125 0.154
Women 0.082 0.095
Performance-based tests
Grip strength
Unable 0.35 0.29 0.13 0.06
Bottom quartile(2-20 kg) 0.21 0.20 0.13 0.14
Top quartile(34.5-68 kg) 0.08 0.04 0.09 0.06
PEF
Unable 0.28 0.37 0.17 0.22
Bottom quartile(50-230 L/min) 0.18 0.15 0.14 0.10
Top quartile(400-800 L/min) 0.06 0.04 0.07 0.05
Walking speed
Unable 0.32 0.34 0.12 0.13
Bottom quartile(0.06-0.52 m/sec) 0.16 0.18 0.13 0.09
Top quartile(0.83-2.14 m/sec) 0.06 0.07 0.08 0.09
Chair stand speed
Unable 0.29 0.28 0.14 0.09
Bottom quartile(0.09-0.34 stands/sec) 0.15 0.14 0.11 0.09
Top quartile(0.52-1.98 stands/sec) 0.08 0.06 0.09 0.07
a
All models control for sex, age, education, and urban residence. The predicted probabilities of dying between exact ages 70 and 75 are estimated by setting the selected measure of physical function at the specified value and fixing all other covariates at the weighted mean for the pooled sample.
b
We fit a separate model for each performance test and adjust only for sociodemographic control variables.
c
We fit a model that includes all measures of physical function (both self-reported and performance-based) in addition to control variables (same as Model 2, Table 2).
d
5. Discussion
Health interview surveys routinely ask respondents about their physical limitations, but they are much less likely to measure respondents’ physical performance with trained observers, presumably because of the expense, complex logistics, and burden for participants. Because it is easier to obtain self-reports than to administer performance tasks, it is important to ascertain the additional value derived from such tests. Of course, their value depends in large part on the particular questions being addressed. In this analysis we consider only one criterion: the prognostic value of four types of performance tests over and above self-reported limitations for five-year mortality. For two population-based samples of older individuals living in the community, we find that PEF and grip strength (and gait speed in Costa Rica) yield sizeable improvements in mortality prediction above and beyond self-reported limitations. The gains in prediction are stronger in Taiwan than in Costa Rica but, because of the smaller sample size, are less likely to be statistically significant in Taiwan.
The paucity of previous studies addressing this issue, combined with variability across data sets in the measures collected, has yielded few robust findings. One study suggested that the chair stand test provided the strongest mortality prediction (Cesari et al. 2008), while other work favored walking speed (Al Snih et al. 2002; Markides et al. 2001), and yet another study reported that grip strength had the biggest effect in women and PEF had the biggest effect in men (Rosero-Bixby and Dow 2012). None of these prior studies included all four performance tests. Our findings, which are remarkably similar in Taiwan and Costa Rica, reveal that for both countries in the presence of controls for self-reported ADL and mobility limitations PEF has the strongest association with mortality. In models that include all four assessments, PEF and grip strength measures significantly predict mortality, whereas chair stand and walking speed do not. The discrepancies between our results and previous findings are likely due to two factors. One relates to the batteries of tests used in the earlier studies: chair stands and walking speed were generally included, whereas grip strength and PEF were not. A second explanation is that previous studies controlled for self-reported ADL limitations, but not mobility limitations. Tabulations (not shown) indicated that, when we omitted controls for self-reported limitations, the advantage of PEF and grip strength relative to the other two performance tasks was diminished, particularly in Costa Rica. This result is not surprising, as ADL limitations, mobility limitations, chair stand speed, and walking speed all reflect lower extremity function.
2010; Rosero-Bixby and Dow 2012; Simons et al. 2011; Vaz Fragoso et al. 2008). Although explanations for these strong links remain unclear (Gale et al. 2007; Schrack, Simonsick, and Ferrucci 2010), multiple mechanisms are likely to be involved. Rantanen et al. (2003) argue that grip strength, which reflects overall muscle strength, predicts survival in part because of chronic diseases that result in muscle impairment via such mechanisms as nutritional deficiency, inflammation, physical inactivity, and depression. However, even in the absence of recognizable disease, weak muscle strength may increase susceptibility to injury and compromise subsequent healing (Rantanen et al. 2003). It could also reflect early life nutrition and fetal development (Gale et al. 2007; Rantanen et al. 2003) or be a marker of subclinical disease (Rantanen et al. 2003). Similarly, Vaz Fragoso et al. (2008) suggest that a diminished PEF reflects more than chronic lung disease or exposure to smoke or pollution; for example, low PEF may indicate impaired respiratory muscle strength, upper-extremity functional limitations, and poor cognitive function. Both PEF and grip strength are thought to capture a person’s overall vigor or vitality (Cook et al. 1991). Despite the cost of specialized equipment, both measures have some advantages as risk assessment tools in household surveys, particularly in developing countries: Unlike chair stands, there is no need to adjust for differences in chair size; in contrast to the timed walk, they do not require unobstructed space; and there is no need to time performance, which may increase measurement error. Nevertheless, accurate measurements of all four performance assessments necessitate careful interviewer training and calibration of instruments.
particularly in Taiwan, where numerous estimates are substantial but not statistically significant.
Few researchers question the importance of collecting self-reported data on physical limitations in older populations. In this study we demonstrate the utility of performance assessments, even when high quality self-reported measures are available. Nonetheless, our findings indicate that it may not be necessary or cost effective to collect a large battery of performance tests, in part because of substantial correlations among the tasks. For predicting mortality in community-based populations at least within a five-year period measurements of PEF and grip strength may suffice. Although our findings are reinforced by the consistency of estimates for Costa Rica and Taiwan, future work should examine the robustness of these results to different settings and populations, and, most importantly, to alternative health outcomes. For example, it is quite possible that performance measures that are redundant for predicting mortality are strong predictors of future disability. With the recent expansion of data collection in longitudinal household surveys, future analyses should also assess the predictive power of changes in performance between survey waves, which may enhance models of health and survival beyond what can ascertained from cross-sectional measures. They may also add prognostic value to models that include changes in self-reported health and functional ability as well as changes in physiological markers (e.g., biomarkers of the cardiovascular or immune system).
6. Acknowledgments
This work was supported by the National Institute on Aging [grant numbers R01AG16790, R01AG16661]; the Eunice Kennedy Shriver National Institute of Child Health and Human Development [grant number R24HD047879]; and the Wellcome Trust [grant number 072406/Z/03/Z].
The CRELES is a longitudinal study of the Universidad de Costa Rica, carried out by the Centro Centroamericano de Población in collaboration with the Instituto de Investigaciones en Salud and the support of the Wellcome Trust Foundation [grant number 072406/Z/03/Z]. The principal investigator was Luis Rosero-Bixby and co-principal investigators were Xinia Fernández and William H. Dow. We recognize the valuable contributions of the many collaborating investigators, information and support staff, and fieldworkers who made this survey possible.
References
Al Snih, S., Markides, K.S., Ray, L., Ostir, G.V., and Goodwin, J.S. (2002). Handgrip strength and mortality in older Mexican Americans. Journal of the American Geriatrics Society 50(7): 12501256. doi:10.1046/j.1532-5415.2002.50312.x.
Bernard, S. L., Kincade, J.E., Konrad, T.R., Arcury, T.A., Rabiner, D.J., Woomert, A., DeFriese, G.H., and Ory, M.G. (1997). Predicting mortality from community surveys of older adults: the importance of self-rated functional ability. The Journals of Gerontology.Series B, Psychological Sciences and Social Sciences 52(3): S155163. doi:10.1093/geronb/52B.3.S155.
Centro Centroamericano de Población (2010). Costa Rica: Abridged life table [Table abreviada de mortalidad], 2007 [electronic resource]. San José, Costa Rica: Centro Centroamericano de Población, Universidad de Costa Rica. http://ccp.ucr.ac.cr/observa/CRindicadores/xls/2007.xls.
Cesari, M., Onder, G., Zamboni, V., Manini, T., Shorr, R.I., Russo, A., Bernabei, R., Pahor, M., and Landi, F. (2008). Physical function and self-rated health status as predictors of mortality: results from longitudinal analysis in the ilSIRENTE study. BMC Geriatrics 8(1): 34. doi:10.1186/1471-2318-8-34.
Chang, M., Lin, H., Chuang, Y., Goldman, N., Peterson, C.E., Glei, D.A., Weinstein, M., Hurng, B., Lin, Y., Lin, S., Liu, I., Liu, H., Lin, S., Wu, C., Hsiao, M., and Wu, S. (2012). Social Environment and Biomarkers of Aging Study (SEBAS) in Taiwan, 2000 and 2006. No. ICPSR03792-v5. Ann Arbor, MI: Inter-university Consortium for Political and Social Research [distributor]. doi:10.3886/ICP SR03792.v5.
Cook, N.R., Evans, D.A., Scherr, P.A., Speizer, F.E., Taylor, J.O., and Hennekens, C.H. (1991). Peak expiratory flow rate and 5-year mortality in an elderly population. American Journal of Epidemiology 133(8): 784794.
Cooper, R., Kuh, D., Hardy, R., Mortality Review Group, and FALCon and HALCyon Study Teams. (2010). Objectively measured physical capability levels and mortality: systematic review and meta-analysis. BMJ 341:112 doi:10.1136/ bmj.c4467.
Feng, Q., Hoenig, H.M., Gu, D., Yi, Z., and Purser, J.L. (2010). Effect of new disability subtype on 3-year mortality in Chinese older adults. Journal of the American Geriatrics Society 58(10): 19521958. doi:10.1111/j.1532-5415.2010.03013.x.
Ferrucci, L., Guralnik, J.M., Baroni, A., Tesi, G., Antonini, E., and Marchionni, N. (1991). Value of combined assessment of physical health and functional status in community-dwelling aged: a prospective study in Florence, Italy. Journal of Gerontology 46(2): 5256. doi:10.1093/geronj/46.2.M52.
Fried, L.P. and Guralnik, J.M. (1997). Disability in older adults: evidence regarding significance, etiology, and risk. Journal of the American Geriatrics Society 45(1): 92100.
Gale, C.R., Martyn, C.N., Cooper, C., and Sayer, A.A. (2007). Grip strength, body composition, and mortality. International Journal of Epidemiology 36(1): 228235. doi:10.1093/ije/dyl224.
Gill, T.M., Robison, J.T., and Tinetti, M.E. (1998). Difficulty and dependence: two components of the disability continuum among community-living older persons. Annals of Internal Medicine 128(2): 96101. doi:10.7326/0003-4819-128-2-199801150-00004.
Guralnik, J.M., Branch, L.G., Cummings, S.R., and Curb, J.D. (1989). Physical performance measures in aging research. Journal of Gerontology 44(5): M141146. doi:10.1093/geronj/44.5.M141.
Guralnik, J.M., Ferrucci, L., Pieper, C.F., Leveille, S.G., Markides, K.S., Ostir, G.V., Studenski, S., Berkman, L.F., and Wallace, R.B. (2000). Lower extremity function and subsequent disability: consistency across studies, predictive models, and value of gait speed alone compared with the short physical performance battery. The Journals of Gerontology.Series A, Biological Sciences and Medical Sciences 55(4): M221231. doi:10.1093/gerona/55.4.M221.
Guralnik, J.M., Ferrucci, L., Simonsick, E.M., Salive, M.E., and Wallace, R.B. (1995). Lower-extremity function in persons over the age of 70 years as a predictor of subsequent disability. The New England Journal of Medicine 332(9): 556561. doi:10.1056/NEJM199503023320902.
Hardy, S.E., Perera, S., Roumani, Y.F., Chandler, J.M., and Studenski, S.A. (2007). Improvement in usual gait speed predicts better survival in older adults. Journal of the American Geriatrics Society 55(11): 17271734. doi:10.1111/j.1532-5415.2007.01413.x.
Horiuchi, S. and Coale, A. (1982). A simple equation for estimating the expectation of life at old age. Population Studies 36(2): 317326. doi:10.2307/2174203.
Human Mortality Database (HMD) (2013). University of California, Berkeley (USA), and Max Planck Institute for Demographic Research (Germany) [electronic resource]. www.mortality.org.
Lee, S.J., Lindquist, K., Segal, M.R., and Covinsky, K.E. (2006). Development and validation of a prognostic index for 4-year mortality in older adults. JAMA : The Journal of the American Medical Association 295(7): 801808. doi:10.1001/ jama.295.7.801.
Markides, K.S., Black, S.A., Ostir, G.V., Angel, R.J., Guralnik, J.M., and Lichtenstein, M. (2001). Lower body function and mortality in Mexican American elderly people. The Journals of Gerontology.Series A, Biological Sciences and Medical Sciences 56(4): M243247. doi:10.1093/gerona/56.4.M243.
Melzer, D., Lan, T.Y., and Guralnik, J.M. (2003). The predictive validity for mortality of the index of mobility-related limitation--results from the EPESE study. Age and Ageing 32(6): 619625. doi:10.1093/ageing/afg107.
Melzer, D., Lan, T.Y., Tom, B.D., Deeg, D.J., and Guralnik, J.M. (2004). Variation in thresholds for reporting mobility disability between national population subgroups and studies. The Journals of Gerontology.Series A, Biological Sciences and Medical Sciences 59(12): 12951303. doi:10.1093/gerona/ 59.12.1295.
Myers, A.M., Holliday, P.J., Harvey, K.A., and Hutchinson, K.S. (1993). Functional performance measures: are they superior to self-assessments? Journal of Gerontology 48(5): M196206. doi:10.1093/geronj/48.5.M196.
Ostir, G.V., Kuo, Y.F., Berges, I.M., Markides, K.S., and Ottenbacher, K.J. (2007). Measures of lower body function and risk of mortality over 7 years of follow-up. American Journal of Epidemiology 166(5): 599605. doi:10.1093/aje/kwm121.
Pencina, M.J. and D'Agostino, R.B. (2004). Overall C as a measure of discrimination in survival analysis: model specific population value and confidence interval estimation. Statistics in Medicine 23(13): 21092123. doi:10.1002/sim.1802.
Rantanen, T., Volpato, S., Ferrucci, L., Heikkinen, E., Fried, L.P., and Guralnik, J.M. (2003). Handgrip strength and cause-specific and total mortality in older disabled women: exploring the mechanism. Journal of the American Geriatrics Society 51(5): 636641. doi:10.1034/j.1600-0579.2003.00207.x.
Reuben, D.B., Seeman, T.E., Keeler, E., Hayes, R.P., Bowman, L., Sewall, A., Hirsch, S.H., Wallace, R.B., and Guralnik, J.M. (2004). Refining the categorization of physical functional status: the added value of combining self-reported and performance-based measures. The Journals of Gerontology Series A: Biological Sciences and Medical Sciences 59(10): 10561061. doi:10.1093/gerona/ 59.10.M1056.
Reuben, D.B., Siu, A.L., and Kimpau, S. (1992). The predictive validity of self-report and performance-based measures of function and health. Journal of Gerontology 47(4): M106110. doi:10.1093/geronj/47.4.M106.
Rosero-Bixby, L. and Dow, W.H. (2012). Predicting mortality with biomarkers: a population-based prospective cohort study for elderly Costa Ricans. Population Health Metrics 10(1): 11. doi:10.1186/1478-7954-10-11.
Rosero-Bixby, L., Fernández, X., and Dow, W.H. (2013). CRELES: Costa Rican Longevity and Health Aging Study, 2005 (Costa Rica Estudio de Longevidad y Envejecimiento Saludable: Sampling and Methods No. ICPSR26681-v2). Ann Arbor, MI: Inter-university Consortium for Political and Social Research: [distributor] doi:10.3886/ICPSR26681.v2.
Schonberg, M.A., Davis, R.B., McCarthy, E.P., and Marcantonio, E.R. (2009). Index to predict 5-year mortality of community-dwelling adults aged 65 and older using data from the National Health Interview Survey. Journal of General Internal Medicine 24(10): 11151122. doi:10.1007/s11606-009-1073-y.
Schrack, J.A., Simonsick, E.M., and Ferrucci, L. (2010). The energetic pathway to mobility loss: an emerging new framework for longitudinal studies on aging. Journal of the American Geriatrics Society 58. S329336. doi:10.1111/j.1532-5415.2010.02913.x.
Swindell, W.R., Ensrud, K.E., Cawthon, P.M., Cauley, J.A., Cummings, S.R., Miller, R.A., and Study Of Osteoporotic Fractures Research Group. (2010). Indicators of "healthy aging" in older women (6569 years of age). A data-mining approach based on prediction of long-term survival. BMC Geriatrics 10(1): 124. doi:10.1186/1471-2318-10-55.
Tinetti, M.E., Inouye, S.K., Gill, T.M., and Doucette, J.T. (1995). Shared risk factors for falls, incontinence, and functional dependence. Unifying the approach to geriatric syndromes. JAMA: The Journal of the American Medical Association 273(17): 13481353. doi:10.1001/jama.1995.03520410042024.
Vaz Fragoso, C.A., Gahbauer, E.A., Van Ness, P.H., Concato, J., and Gill, T.M. (2008). Peak expiratory flow as a predictor of subsequent disability and death in community-living older persons. Journal of the American Geriatrics Society 56(6): 10141020. doi:10.1111/j.1532-5415.2008.01687.x.
Verbrugge, L.M. and Jette, A.M. (1994). The disablement process. Social Science and Medicine 38(1): 114.