in the population sciences published by the Max Planck Institute for Demographic Research Konrad-Zuse Str. 1, D-18057 Rostock · GERMANY www.demographic-research.org
DEMOGRAPHIC RESEARCH
VOLUME 13, ARTICLE 19, PAGES 485-520
PUBLISHED 17 NOVEMBER 2005
http://www.demographic-research.org/Volumes/Vol13/19/ DOI: 10.4054/DemRes.2005.13.19
Research Article
Cause-specific contributions to
sex differences in adult mortality
among Whites and African Americans
between 1960 and 1995
Irma T. Elo
Greg L. Drevenstedt
This article is part of Demographic Research Special Collection 4, “Human Mortality over Age, Time, Sex, and
Place: The 1st HMD Symposium”.
1 Introduction 486
2 Data and methods 490
2.1 Data 490
2.2 Methods 491
3 Trends in all-cause mortality and sex differences in mortality between 1960 and 1995
493
4 Cause-Specific Contributions to Sex Differences in White and African American Mortality
499
4.1 Ages 15-39 499
4.2 Ages 40-64 500
5 Discussion and conclusions 507
6 Acknowledgments 511
References 512
Cause-specific contributions to sex differences in
adult mortality among Whites and African Americans
between 1960 and 1995
Irma T. Elo 1
Greg L. Drevenstedt 2
Abstract
The purpose of this paper is to describe trends in sex differences in mortality in young adulthood and in middle age among African Americans and whites in the United States between 1960 and 1995. We examine trends in all-cause mortality and estimate the contribution of leading causes of death to the change in the sex difference in mortality over time. Between 1960 and 1995 the sex difference in mortality increased for African Americans and whites at ages 15-39 and declined for whites but increased for African Americans at ages 40-64. Our results reveal considerable variation in the sex difference in mortality by cause of death as well as in the contribution various causes of death make to the change in the sex mortality difference over time.
This article is part of Demographic Research Special Collection 4,
“Human Mortality over Age, Time, Sex, and Place: The 1st HMD Symposium”. Please see Volume 13, Publications 13-10 through 13-20.
1 Population Studies Center, University of Pennsylvania, 3718 Locust Walk, Philadelphia, PA 19104, USA.
E-mail: [email protected]
2 Valmont Research LLC. E-mail: [email protected]. When the research for this paper was conducted,
1. Introduction
One of the great accomplishments of the twentieth century has been a rapid decline in mortality and the resulting gains in life expectancy. In the United States, life expectancy increased from 47.3 years in 1900 to 76.9 years in 2000 (Arias 2002; White and Preston 1996). At the cusp of the twenty-first century, 82% of Americans could expect to live to age 65 (Arias 2002). These improvements have not benefited all groups equally, however. A well-known characteristic of the twentieth century mortality decline has been a widening of the sex difference in mortality. The female advantage in life expectancy in developed countries was only about 2 to 3 years around 1900, but it has been as high as 5 to 8 years in recent decades (Horiuchi 1999). In the United States, female life expectancy exceeded that of males by about 2 years in 1900 and by 5.4 years in 2000 (Arias 2002; Bell, Wade and Goss 1992). Mortality also varies by race/ethnicity and socioeconomic status: African Americans and low-income individuals are much more likely to die at younger ages than individuals from other race/ethnic groups or persons from socio-economically privileged backgrounds (National Center for Health Statistics [NCHS] 1998a, 1998b).
At the same time, the mortality decline and the widening of the sex mortality difference were not uniform throughout the last century. The fall in death rates slowed down substantially at mid-century in most Western countries as chronic diseases replaced infectious diseases as leading causes of death (Crimmins 1981; Enterline 1960; Verbrugge 1976). At the time, there was widespread speculation that future gains in life expectancy would be slow to materialize and that they would be small in comparison to gains made in the first half of the twentieth century (NCHS 1964; United Nations 1982). These predictions proved to be too pessimistic as early as the late 1960s, however, when death rates resumed their downward trend in most Western countries where considerable improvements in life expectancy have been realized since 1970. In the United States, life expectancy increased by only 2.7 years between 1950 and 1970, in contrast to a gain of 4.6 years during the subsequent 20-year period, with additional 1.5 years gained between 1990 and 2000 (NCHS 1954, 1975, 1997; Arias 2002).
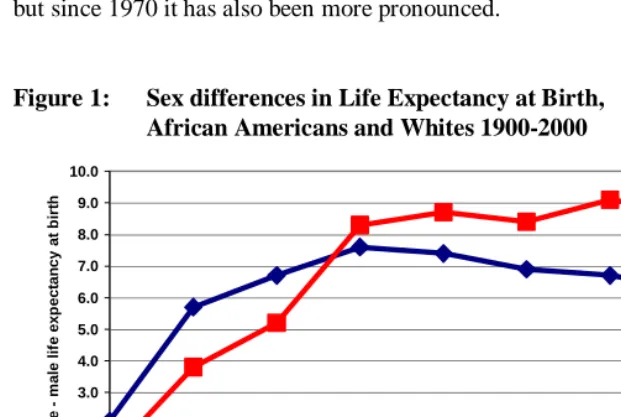
mortality differences between men and women that we observe for whites is not atypical of trends in other developed countries. Trovato and Lalu (1996) documented that by the early 1990s sex difference in life expectancy had narrowed in 12 industrialized countries. For African Americans, however, the narrowing of the sex difference in life expectancy did not begin until well into the 1990s. Not only has the sex difference in mortality been more persistent among African Americans than whites, but since 1970 it has also been more pronounced.
Figure 1: Sex differences in Life Expectancy at Birth,
African Americans and Whites 1900-2000
0.0 1.0 2.0 3.0 4.0 5.0 6.0 7.0 8.0 9.0 10.0
1900 1950 1960 1970 1980 1985 1990 1995 2000
Year
F
e
m
a
le
m
a
le lif
e exp
ect
an
cy
at
b
ir
th
Whites African Americans
found for the gender-equality hypothesis in so far as sex mortality differences have not paralleled trends in women’s employment and changing family roles (Pampel and Zimmer 1989; Waldron 1993, 2000). Trends in health behaviors, such as smoking, on the other hand, have been implicated in the recent narrowing of the sex mortality difference. Pampel (2003:45), for example, attributed the declining sex differences in lung cancer mortality to “a lag in the adoption, diffusion, and abatement of smoking by women.” Waldron (1995:38) also emphasized trends in gender differences in health behaviors and suggested that “decreasing gender differences in smoking and driving together with differential effects of dietary and medical improvements appear to have been major causes of decreasing gender differences in mortality during the 1980s” (see also Waldron, McCloskey and Earle (2005).
The distinct patterns of sex mortality differences observed in the United States for African Americans and for whites suggest that no single set of explanations is likely to account for gender-specific influences on mortality. They also argue for the need to set sex mortality differences in the broader societal context (Nathanson and Lopez 1987; Williams 2001). In the United States, an individual’s racial identity captures important macro-level influences that condition individual life chances. Observed sex-specific mortality differences by race thus reflect not only sex-specific differences in health behaviors and socioeconomic status among whites and African Americans, but also the broader social context in which they are embedded. It has been argued, for example, that racism and residential segregation limit African American’s ability to translate economic and social resources into improvements in living conditions, good health, and low mortality (Massey and Denton 1993; Williams and Collins 1995; Williams 2001). The trends in sex differences in mortality among African Americans further suggest that black women have gained greater health benefits than black men from improved economic conditions, new medical technologies, and social policies during the latter half of the twentieth century.
In this paper, we add to the literature on sex differences in mortality by contrasting the cause-specific contributions to sex differences in mortality among African Americans and whites in the United States between 1960 and 1995. A detailed description of the contributions leading causes of death make to changes in sex mortality differences over time can help shed light on possible explanations for the observed trends. Although there have been several previous investigations of sex differences in mortality in the United States and elsewhere (e.g., Verbrugge 1976; Waldron 1993, 1995; Trovato and Lalu 1996; Zhang, Sasaki and Kestelroot 1995), no study has systematically examined trends in sex mortality differences among African Americans.
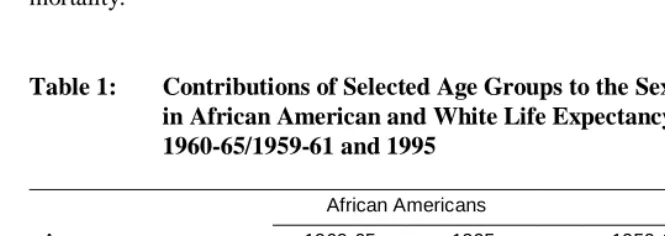
analyses on young adulthood and working ages where sex differences in mortality are especially large; ages 15 to 64 made the largest contribution to the sex difference in life expectancy at birth during the latter half of the twentieth century. Differences in death rates between African American men and African American women at ages 15-64 accounted for 51% (2.6 years) of the 5.2 year gap in life expectancy in 1960. The respective figures for whites were 62% or 4.1 years of the 6.6-year gap. By 1995, the sex difference in life expectancy had increased to 8.7 years among African Americans and the contribution of ages 15-64 to this disparity had risen to 72%. In contrast, the sex difference in mortality among whites had declined to 6.2 years and the contribution of ages 15-64 to this difference had fallen to 55% (Table 1).
The remainder of the paper is organized as follows. The following section discusses the data and methods used in the analyses. The next two sections examine trends in all-cause mortality by age, sex, and race and trends in sex mortality difference by age and race, and cause-specific contributions to the sex mortality difference between 1960 and 1995 for whites and African Americans. The fifth section considers medical and non-medical factors that may have influenced mortality trends and sex differences in mortality over time. We also relate our findings to those of a previous study on cause-specific contributions to black-white differences in male mortality (Elo and Drevenstedt 2004). The paper thus builds upon and complements previous analyses of cause-specific contributions to black-white and sex differences in all-cause mortality.
Table 1: Contributions of Selected Age Groups to the Sex Difference
in African American and White Life Expectancy at Birth, 1960-65/1959-61 and 1995
African Americans Whites
Age group 1960-65 1995 1959-61 1995
< 15 years 0.75 yrs 0.30 yrs 0.64 yrs 0.19 yrs
15-39 years 0.94 yrs 2.64 yrs 1.01 yrs 1.31 yrs
40-64 years 1.70 yrs 3.69 yrs 3.08 yrs 2.06 yrs
65+ years 1.80 yrs 2.04 yrs 1.91 yrs 2.59 yrs
Sex difference in e0
e0
F
- e0
M
5.19 yrs 8.67 yrs 6.64 yrs 6.15 yrs
2. Data and methods
2.1 Data
We use data on causes of death and on all causes combined from the publicly available Mortality Detail (1968-1991) and Multiple Cause of Death (1992-1995) files produced by the National Center for Health Statistics (NCHS) for years 1968-1995. For earlier years, 1960 to 1967, we obtained cause-specific data from the Centers for Disease Control (CDC). In the construction of age-specific death rates, we use Census Bureau population estimates and correct them for estimated population undercount. The sources of these estimates are published figures for 1960-1969 (U.S. Bureau of the Census 1974) and electronically available estimates for the 25-year period from 1970 to 1995 (Centers for Disease Control 2001a; 2001b).3 Because of large census undercounts that vary by age, race, and sex, we adjust the yearly population estimates using estimated net census omission rates available for each of the census years. For intercensal years, we linearly interpolate undercount estimates by age, race, and sex based on estimates for the census years bracketing the intercensal period, except that the 1990 undercount estimates are used for the period 1990-1995. Undercount estimates for African Americans come from the reconstruction of the African American population by Preston et al. (1998), and for whites we use estimates prepared by the Census Bureau (U.S. Bureau of the Census 1988; Robinson et al. 1993).
Between 1960 and 1995, causes of death are coded according to the Seventh (1960-1967), Eighth (1968-1978), and Ninth Revisions (1979-1995) of the International Classification of Diseases (ICD). We minimize possible effects of coding changes between ICD revisions by grouping causes of death broadly – into 11 categories at ages 15-39 and into 12 categories at ages 40-64 (see Appendix Table A.1 for the cause-of-death categories and their ICD codes). These cause groups consist of leading causes of death and causes that made significant contributions to the sex difference in mortality between 1960 and 1995. We include ‘symptoms and ill-defined conditions’ as a unique category because coding of deaths to these causes has changed over time. We consider implications of these coding changes in the discussion of the results.
Because of the importance of HIV/AIDS as a cause of death in the 1980s and the 1990s and its contribution to sex mortality differences over time, we include HIV/AIDS as a distinct cause of death beginning in 1984 (Kochanek, Maurer and Rosenberg 1994). From 1984 to 1986 most HIV-related deaths were assigned to the category ‘deficiency of cell-mediated immunity’ (ICD No. 279.1; NCHS 1986) and from 1987 to 1995 to special codes *042-*044 (NCHS 1989). An inspection of age-standardized
death rates by cause of death suggest that some AIDS deaths may have been included under the category ’other infectious and parasitic diseases’ prior to 1987.
Our cause of death classifications are based on the underlying cause of death reported on the death certificate, which is defined by the World Health Organization as “(a) the disease or injury which initiated the train of morbid events leading directly to death, or (b) the circumstances of the accident or violence which produced the fatal injury” (Rosenberg 1999:141). Therefore, we may underestimate the overall contribution of some causes of death, such as diabetes, to all-cause mortality (Manton, Patrick and Johnson 1987; Israel, Rosenberg and Curtin 1986). By limiting the analyses to ages 15-64 we reduce this potential problem to some extent; it is believed that information on underlying cause of death is most problematic for the elderly (Rosenberg 1999).
2.2 Methods
Our analytic strategy consists of the following steps. First, we identify which causes of death were principally responsible for the sex difference in African American and white mortality in 1960-1962 and 1993-1995. Second, we examine the proportionate contributions of various causes of death to the change in the sex difference in all-cause mortality over time. These analyses show the causes of death that have been primarily responsible for changes in the sex difference in African American and white mortality between 1960 and 1995.
Because cause-specific mortality varies by age, we focus our analyses on two broad age groups, 15-39 and 40-64. Intentional and unintentional injuries are leading causes of death at younger ages, while chronic disease mortality dominates at ages 40-64. We divide the 35-year time period into three time intervals, which correspond to changes in the sex differences in mortality: 1960-1972, 1973-1983, and 1984-1995. We first calculate annual age, race, and sex-specific death rates by five-year age groups for all causes combined and for specific causes of death. Death rates for the two 25-year age intervals, 15-39 and 40-64, are then age-standardized using the year 2000 population as a standard (Anderson and Rosenberg 1998).
cause-specific rates. Second, it is the absolute difference in death rates rather than the ratio of these rates that contributes to the sex difference in life expectancy. Third, the ratio of cause-specific rates can become unstable as mortality from selected causes decline and the number of deaths becomes small (Gragnolati, Elo and Goldman 1999).
We use two measures in our analyses. First, to estimate cause-specific contributions to the sex difference in all-cause mortality at the beginning (1960-1962) and end (1993-1995) of the time period of study, we calculate cause-specific contributions (pi) to the sex difference in all-cause mortality as follows:
pi = (25ASDRMx,i -25ASDRFx,i) / (25ASDRMx -25ASDRFx), (1)
where 25ASDRMx,i and 25ASDRMx represent age-standardized male death rates for cause
i and for all causes combined at ages x to x+25, respectively, and 25ASDRFx,i and 25ASDRFx represent the corresponding age-standardized female death rates. The
proportionate contributions (pi) for causes of death sum to one.
We then estimate a set of linear regression models, derived from earlier work by Preston (1976) and Gragnolati, Elo, and Goldman (1999), to identify cause-specific contributions to the change in the sex difference in all-cause mortality over time:
25ASDRMx,i,t -25ASDRFx,i,t = ai + bi (25ASDRMx,t -25ASDRFx,t), (2)
where 25ASDRM,Fx,i,t, and 25ASDRM,Fx,t are defined as in the previous equation, except
that all measures in equation (2) refer to year t. The slope coefficient, bi, is interpreted
as the proportionate change in the sex difference in all-cause mortality that is attributable to the change in the sex difference in mortality for cause i. A separate model is estimated for each cause of death, and the sum of the slope coefficients, bi,
3. Trends in all-cause mortality and sex differences in mortality
between 1960 and 1995
Figures 2a and 2b present age-standardized death rates by sex and sex differences in all-cause mortality for whites and African Americans at ages 15-39 from 1960 to 1995. Fluctuations in death rates during this period were most pronounced for young African American men. Mortality for young black men increased substantially between 1960 and 1972, it then declined precipitously between 1972 and 1983, and exhibited another increase that extended into the early 1990s (Figure 2a). In 1993-1995, the age-standardized death rate for black men at ages 15-39 was 12% higher than it had been in 1960-1962. Mortality trends for African American women were more favorable. Despite a slight increase in African American female mortality in the 1980s, the overall trend was positive with age-standardized death rates falling by 37% between 1960-1962 and 1993-1995 (Table 2). These sex-specific changes in all-cause mortality led to large fluctuations in the sex difference in African American mortality over time. It increased from 87 per 100,000 in 1960 to 245 in 1972, it declined to 149 in 1983, and was 208 in 1995, 2.4 times higher than its value in 1960.
Changes in age-standardized death rates were smaller for young white men and white women than for African Americans. Furthermore, although all-cause mortality trends were more adverse for young white men than for young white women, they were more favorable than for young African American men. Between 1960-1962 and 1993-1995, white male mortality at ages 15-39 increased by 4% compared to a 12-percent increase in African American male mortality. In contrast, the overall decline in age-standardized death rates was more favorable for African American women than for white women. Mortality declined by 37% for young black women and by 23% for young white women from the early 1960s to the mid-1990s (Tables 2 and 3). These differences in sex-specific mortality trends by race led to less pronounced changes in the sex mortality difference for whites than for African Americans (Figures 2a and 2b and Tables 2 and 3).
In contrast, among whites at ages 40-64 the decline in all cause-mortality was more pronounced for men than for women between 1960 and 1995. As a result, the sex difference in mortality for whites began to fall in the late 1960s, a decline that continued until 1995 (Figure 3b). Between 1960-1962 and 1993-1995, the age-standardized death rate fell by 37% for white men but by only 27% for white women. The sex mortality difference narrowed from 569 per 100,000 in 1960-1962 to 300 per 100,000 in 1993-1995.
In summary, the more pronounced fluctuations in the sex difference in all-cause mortality and the larger increase in this difference at ages 15-39 for African Americans than for whites can be explained by distinct sex- and race-specific mortality trends between 1960 and 1995. First, African American male mortality exhibited the largest variability over this period, at the time when African American female age-standardized death rates fell or increased only modestly between 1984 and 1995. Second, changes in male and female mortality at ages 15-39 were smaller for whites than for African Americans throughout the period. At older ages, we can attribute the larger sex mortality difference among African Americans than whites to the more adverse trend in African American male than female mortality between 1960 and 1972. During this period, the sex difference in African American mortality increased from 388 to 674 per 100,000. Its subsequent decline between 1972 and 1983 was smaller than its rise in the 1960s and it remained well above its 1960 value until the mid-1990s. In contrast, the sex difference in mortality among whites at ages 40-64 declined steadily after the late 1960s as a result of more favorable mortality trends for white men than for white women.
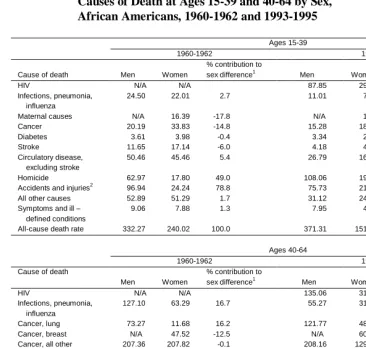
Table 2: Age-Standardized Death Rates per 100,000 Persons for Selected Causes of Death at Ages 15-39 and 40-64 by Sex,
African Americans, 1960-1962 and 1993-1995
Ages 15-39
1960-1962 1993-1995
Cause of death Men Women
% contribution to
sex difference1 Men Women
% contribution to sex difference1
HIV N/A N/A 87.85 29.88 26.3
Infections, pneumonia, influenza
24.50 22.01 2.7 11.01 7.74 1.5
Maternal causes N/A 16.39 -17.8 N/A 1.65 -0.7
Cancer 20.19 33.83 -14.8 15.28 18.61 -1.5
Diabetes 3.61 3.98 -0.4 3.34 2.33 0.5
Stroke 11.65 17.14 -6.0 4.18 4.72 -0.2
Circulatory disease, excluding stroke
50.46 45.46 5.4 26.79 16.56 4.6
Homicide 62.97 17.80 49.0 108.06 19.76 40.1
Accidents and injuries2 96.94 24.24 78.8 75.73 21.23 24.7
All other causes 52.89 51.29 1.7 31.12 24.30 3.1
Symptoms and ill – defined conditions
9.06 7.88 1.3 7.95 4.22 1.7
All-cause death rate 332.27 240.02 100.0 371.31 151.00 100.0
Ages 40-64
1960-1962 1993-1995
Cause of death
Men Women
% contribution to
sex difference1 Men Women
% contribution to sex difference1
HIV N/A N/A 135.06 31.18 17.8
Infections, pneumonia, influenza
127.10 63.29 16.7 55.27 31.57 4.1
Cancer, lung 73.27 11.68 16.2 121.77 48.62 12.5
Cancer, breast N/A 47.52 -12.5 N/A 60.00 -10.3
Cancer, all other 207.36 207.82 -0.1 208.16 129.18 13.5
Diabetes 25.61 52.27 -7.0 40.12 39.47 0.1
Stroke 190.29 202.20 -3.1 67.28 47.84 3.3
Circulatory disease, excluding stroke
640.90 493.09 38.8 383.34 211.89 29.3
Homicide 48.91 11.11 9.9 37.06 7.66 5.0
Accidents and injuries2 121.43 37.47 22.0 87.37 25.64 10.6
All other causes 209.72 149.41 15.8 188.28 117.13 12.2
Symptoms and ill-defined conditions
46.81 34.47 3.2 20.20 8.84 1.9
All-cause death rate 1,691.40 1,310.33 100.0 1,343.91 759.02 100.0
Notes:
1 The percentage contributions of specific causes of death to the sex difference in age-standardized death rates from all causes
combined. Percentage contributions may not add to 100.00 due to rounding.
2
Table 3: Age-Standardized Death Rates per 100,000 Persons for Selected Causes of Death at Ages 15-39 and 40-64 by Sex,
Whites 1960-1962 and 1993-1995
Ages 15-39
1960-1962 1993-1995
Cause of death Men Women
% contribution to
sex difference1 Men Women
% contribution to sex difference1
HIV N/A N/A 27.66 3.54 22.4
Infections, pneumonia, influenza
5.70 4.90 1.0 4.00 2.20 1.7
Maternal causes N/A 3.00 -3.7 N/A 0.37 -0.3
Cancer 18.72 21.53 -3.5 12.56 13.19 -0.6
Diabetes 2.22 1.59 0.8 1.42 1.11 0.3
Stroke 3.66 3.45 0.3 1.67 1.51 0.1
Circulatory disease, excluding stroke
23.52 9.95 16.8 11.56 5.13 6.0
Homicide 5.22 1.98 4.0 14.48 4.14 9.6
Accidents and injuries2
84.76 21.51 78.5 81.21 23.54 53.5
All other causes 20.94 16.73 5.2 14.93 9.17 5.3
Symptoms and ill- defined conditions
1.82 1.30 0.6 3.87 1.69 2.0
All-cause death rate 166.56 85.94 100.0 173.36 65.59 100.0
Ages 40-64
1960-1962 1993-1995
Cause of death Men Women
% contribution to
sex difference1 Men Women
% Contribution to sex difference1
HIV N/A N/A 32.82 2.89 10.0
Infections, pneumonia, influenza
38.70 16.65 3.9 19.06 11.73 2.4
Cancer, lung 65.74 9.91 9.8 75.09 45.14 10.0
Cancer, breast N/A 48.22 -8.5 N/A 42.98 -14.3
Cancer, all other 149.17 131.45 3.1 130.23 91.81 12.8
Diabetes 14.30 13.90 0.1 16.53 12.78 1.3
Stroke 58.03 44.11 2.4 20.58 16.64 1.3
Circulatory disease, excluding stroke
528.75 165.97 63.8 223.00 80.72 47.5
Homicide 4.91 1.83 0.5 6.92 2.43 1.5
Accidents and injuries2
102.22 32.51 12.3 67.88 23.57 14.8
All other causes 137.38 72.36 11.4 97.15 62.60 11.5
Symptoms and ill- defined conditions
10.80 4.49 1.1 7.81 3.96 1.3
All-cause death rate 1,110.00 541.40 100.0 697.07 397.25 100.0
Notes:
1 The percentage contributions of specific causes of death to the sex difference in age-standardized death rates from all causes
combined. Percentage contributions may not add to 100.00 due to rounding.
Figure 2a: Age-Standardized Death Rates from All Causes Combined for Whites and African Americans by Sex, Ages 15-39, 1960-1995
0 50 100 150 200 250 300 350 400 450 500 196 0
1962 196 4 196 6 196 8 197 0 197 2 197 4 197 6 197 8 198 0 198 2 198 4 198 6 198 8 199 0
1992 199 4 Year D eat h s p e r 10 0, 00 0 p e rs o n s
White Males White Females African American Males African American Females
Figure 2b: Sex Difference in Age-Standardized Death Rates from All Causes Combined for Whites and African Americans, Ages 15-39, 1960-1995
0 50 100 150 200 250 300
1960 1965 1970 1975 1980 1985 1990 1995
Year M a le -F em al e Di ff er en ce i n A g e-S tan d a rd iz ed Deat h R a te p e r 100, 000
Figure 3a: Age-Standardized Death Rates from All Causes Combined for Whites and African Americans by Sex, Ages 40-64, 1960-1995
0 200 400 600 800 1000 1200 1400 1600 1800 2000 Year
Whi te Mal es Whi te Femal es Af r i can Amer i can Mal es Af r i can Amer i can Femal es
Figure 3b: Sex Difference in Age-Standardized Death Rates from All Causes Combined for Whites and African Americans,
Ages 40-64, 1960-1995
20 120 220 320 420 520 620 720
1960 1965 1970 1975 1980 1985 1990 1995
Year M a le -F em al e Di fferen c e i n Ag e -S ta nda rd iz e d D e a th R a te pe r 100 ,0 00
4. Cause-Specific Contributions to Sex Differences in White and
African American Mortality
Tables 2 and 3 present age-standardized death rates by age and cause of death in 1960-1962 and 1993-1995, and Figures 4a-4b and 6a-6b show the proportionate contributions of various causes of death to the sex difference in mortality for these two time points. Figures 5a-5b and 7a-7b summarize cause-specific contributions to changes in sex mortality differences over time; these figures are based on Appendix Tables A2 and A3.
4.1 Ages 15-39
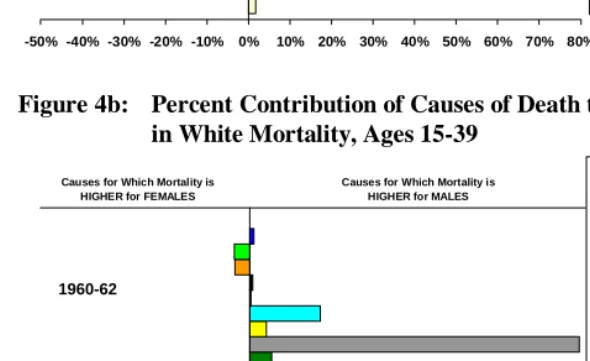
In 1960-1962, the age-standardized death rate of African American men at ages 15-39 (332 per 100,000) exceeded the African American female death rate (240 per 100,000) by 38%. Intentional and unintentional injuries and homicide were the two leading causes of death among young African American men, while circulatory diseases (excluding stroke) and cancer were the two leading causes of death among young African American women. Accidents and injuries made the largest contribution (78.8%) to excess male mortality in 1960-1962, followed by homicide (49.0%). This male excess was partly offset by higher female mortality from cancer (-14.8%), stroke (-6.0%), and maternal causes (-17.8%). The contributions of other causes of death were small (Table 2 and Figure 4a).
By 1993-1995, death rates at ages 15-39 from all causes, other than homicide, had declined for both men and women, but HIV/AIDS had emerged as the leading cause of death among young African American women and as the second leading cause of death among young African American men. At the same time, male mortality from homicide was almost twice as high in 1993-1995 (108 per 100,000) than it had been in 1960-1962 (63 per 100,000), and by the mid-1990s it made the largest contribution to the sex-difference in African American mortality. In addition, the more rapid increase in African American male than female death rates from HIV/AIDS between 1984 and 1995 made it the second most important cause of death in accounting for the sex difference in African American mortality in the mid-1990s, just ahead of intentional and unintentional injuries. These causes of death had declined in importance and higher female mortality from cancer, stroke, and maternal causes had largely disappeared by the mid-1990s (Table 2 and Figure 4a).
most of the sex mortality difference for whites in 1993-1995. In addition, HIV/AIDS, which was the second leading cause of death among young white men in the mid-1990s, made the second largest contribution to the sex difference in white mortality as it did for African Americans. Homicide, in contrast, was much less important in explaining the sex mortality difference for whites than it was for African Americans (Table 3 and Figure 4b).
Homicide, intentional and unintentional injuries, and HIV/AIDS in the most recent period also accounted for most of the fluctuations in sex differences in all-cause mortality between 1960 and 1995 for both whites and African Americans, although the direction of their contributions varied over time. Between 1960 and 1972, sex-specific mortality trends from homicide and intentional and unintentional injuries led to a widening of the sex difference in mortality, while the reverse was true between 1973 and 1983. In the most recent period, 1984-1995, sex-specific mortality trends from homicide and HIV/AIDS explained most of the widening of the sex mortality difference. Other cause-of-death groups examined were less important throughout the period (Appendix Tables A2 and A3 and Figures 5a and 5b).4
4.2 Ages 40-64
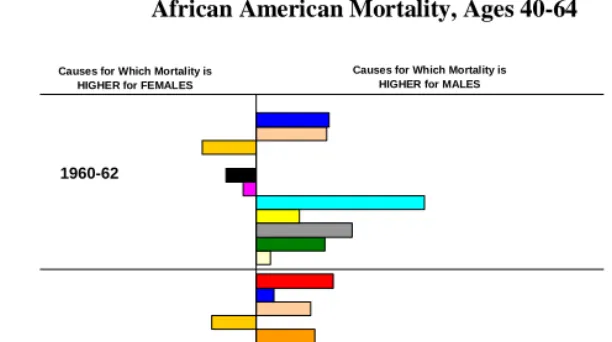
Not surprisingly, chronic diseases played a more important role in generating the sex difference in African American and white mortality at ages 40-64 than they did at younger ages, as can be seen in Tables 2 and 3 and Figures 6a-6b. Cause-specific contributions, however, differed by race and time period.
In 1960-62, circulatory diseases, other than stroke, alone accounted for 39% of the sex difference in African American mortality. In addition, sex differences in death rates from intentional and unintentional injuries (22%), infections, pneumonia, and influenza (17%), and lung cancer (16%) made substantial contributions to the male excess in all-cause mortality among African Americans in the early 1960s. Higher male mortality from these causes was partly offset by female mortality from breast cancer. By 1993-1995, mortality had declined for both African American men and women, but the sex difference in mortality had increase from 381 per 100,000 in the early 1960s to 585 per 100,000 in 1993-1995 due to an increase in the sex mortality difference for most cause-of-death groups examined, except for infections, pneumonia and influenza, intentional and unintentional injuries, and homicide. In addition, by mid-1990s male excess in deaths from HIV/AIDS made a sizable contribution to the sex difference in mortality
4 To examine the potential bias in our estimates caused by changes in the coding of deaths to symptoms and ill-defined conditions, we estimated
among African Americans (Table 2). However, a comparison of the two end points hides important variations in cause-specific contributions to changes in the sex mortality difference over time.
For whites cardiovascular diseases, other than stroke, made by far the largest contribution (64%) to the sex difference in mortality in the early 1960s. In addition, lung cancer (10%) and intentional and unintentional injuries (12%) explained a larger fraction of the sex difference in all-cause mortality for whites than the other named cause-of-death groups (Tables 2 and 3 and Figures 6a and 6b). By the mid-1990s, the sex difference in mortality among whites had declined substantially, from 567 per 100,000 in 1960-62 to 269 in 1993-1995. The most pronounced decline in the sex mortality difference in absolute terms was for cardiovascular diseases, other than stroke, which declined from 363 per 100,000 in 1960-62 to 142 per 100,000 in 1993-1995. In addition, the sex mortality difference declined for infections, pneumonia and influenza, lung cancer, stroke, accidents and injuries, and the residual cause of death group.
As noted above, sex differences in all-cause mortality at ages 40-64 between 1960 and 1995 exhibited rather different trends for African Americans compared to whites. Not surprisingly, cause-specific contributions to these trends also varied by race. Between 1960 and 1972, the sex difference in African American mortality increased, with circulatory diseases, including stroke, cancers (other than breast), and homicide making the largest contributions to the widening of the sex mortality difference. Changes in female breast cancer mortality had a trivial effect, while all other cause groups examined, except infection, influenza, and pneumonia, also contributed to the widening of the sex difference. Between 1973 and 1984, the sex difference in African American mortality declined, and sex-specific mortality trends for most causes, which had contributed to the widening of the sex difference from 1960 to 1972, led to the narrowing of the sex mortality difference. Only sex-specific mortality trends for cancers, other than breast and lung, offset these declines.
In the most recent period, the change in the sex difference in all-cause mortality for African Americans was small (5.01 per 100,000), as were changes in sex mortality differences for most causes of death. These trends also make our results for this period least robust (Appendix Table A3). 5 However, based on a careful inspection of cause-specific mortality trends by sex, we can draw some general conclusions. First, it is quite clear that the sex difference in mortality from HIV/AIDS increased substantially during the most recent period, from 2.6 per 100,000 in 1984 to 111.3 in 1995. Therefore, there is no doubt that sex-specific mortality trends from HIV/AIDS worked against the narrowing of the sex difference in all-cause mortality for African Americans
5 We examined the potential bias in our estimates due to changes in the coding of deaths due to ‘symptoms and ill-defined conditions.’ These
between 1984 and 1995. Second, there were fairly sizable declines in the sex difference in mortality from lung cancer (from 104.1 to 69.1 per 100,000) and circulatory diseases other than stroke (203.8 to 173.1), and they counterbalanced some of the increase in the sex mortality difference attributable to trends in mortality from HIV/AIDS. In fact, had it not been for the more rapid rise in HIV/AIDS deaths for African American men than for African American women, the sex difference in all-cause mortality for African Americans at ages 40-64 might well have continued to decline between 1984 and 1995.
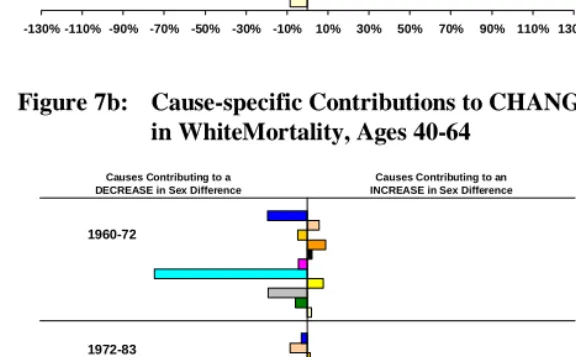
Trends in sex differences in all-cause mortality for whites at ages 40-64 are quite distinct from those for African Americans. The sex difference in all-cause mortality for whites declined throughout the period, although this narrowing was fairly small before 1970 (Figure 3a). As seen in Figure 7b, cardiovascular diseases, other than stroke, made by far the largest and most sustained contribution to the narrowing of the sex difference in all-cause mortality for whites between 1960 and 1995. The contributions of other cause groups were smaller and inconsistent. For example, sex-specific mortality trends from lung cancer made a small contribution to the widening of the sex difference in all-cause mortality between 1960 and 1972. In subsequent years, however, it has contributed to the decline in the sex mortality difference, with a most notable effect between 1984 and 1995. It is also important to note that the decline in the sex mortality difference during the most recent period would most likely have been more pronounced had it not been for the emergence of HIV/AIDS in the 1980s. Sex-specific mortality trends from HIV/AIDS worked against the decline in sex mortality difference for whites, as it did for African Americans.6
Figure 4a: Percent Contribution of Causes of Death to Sex Difference in African American Mortality, Ages 15-39
-50% -40% -30% -20% -10% 0% 10% 20% 30% 40% 50% 60% 70% 80% HIV
Infections, pneumonia, influenza Maternal causes
Cancer
Diabetes
Stroke
Circulatory disease, excluding stroke Homicide
Accidents and injuries All other causes
Symptoms and ill-defined conditions
Causes for Which Mortality is HIGHER for FEMALES
Causes for Which Mortality is HIGHER for MALES
1960-62
1993-95
Figure 4b: Percent Contribution of Causes of Death to Sex Difference in White Mortality, Ages 15-39
-50% -40% -30% -20% -10% 0% 10% 20% 30% 40% 50% 60% 70% 80% HIV
Infections, pneumonia, influenza
Maternal causes
Cancer
Diabetes
Stroke
Circulatory diseases, excluding stroke Homicide
Accidents and injuries
All other causes
Symptoms and ill-defined conditions
Causes for Which Mortality is HIGHER for FEMALES
Causes for Which Mortality is HIGHER for MALES
1960-62
1993-95
Note: Cause-specific contributions are shown in the order indicated by the legend. Estimates for HIV/AIDS are only for the period 1993-1995.
Figure 5a: Cause-specific Contributions to CHANGE in Sex Difference in African American Mortality, Ages 15-39
-130 -110 -90% -70% -50% -30% -10% 10% 30% 50% 70% 90% 110% 130% HIV
Infections, pneumonia, influenza Maternal causes
Cancer
Diabetes
Stroke
Circulatory disease, excluding stroke Homicide
Accidents and injuries
All other causes
Symptoms and ill-defined conditions 1960-72
1972-83
1984-95
Causes Contributing to a DECREASE in Sex Difference
Causes Contributing to an INCREASE in Sex Difference
Figure 5b: Cause-specific Contributions to CHANGE in Sex Difference in White Mortality, Ages 15-39
-130% -110% -90% -70% -50% -30% -10% 10% 30% 50% 70% 90% 110% 130%
HIV
Infections, pneumonia, influenza Maternal causes
Cancer
Diabetes
Stroke
Circulatory disease, excluding stroke Homicide
Accidents and injuries
All other causes
Symptoms and ill-defined conditions 1960-72
1972-83
1984-95
Causes Contributing to a DECREASE in Sex Difference
Causes Contributing to an INCREASE in Sex Difference
Note: Cause-specific contributions are shown in the order indicated by the legend. Estimates for HIV/AIDS are only for the period 1984-1995.
Figure 6a: Percent Contribution of Causes of Death to Sex Difference in African American Mortality, Ages 40-64
-50% -40% -30% -20% -10% 0% 10% 20% 30% 40% 50% 60% 70% 80% HIV
Infections, pneumonia, influenza Cancer, lung
Cancer, breast
Cancer, all other
Diabetes
Stroke
Circulatory diseases, excluding stroke Homicide
Accidents and injuries All other causes
Symptoms and ill-defined conditions
Causes for Which Mortality is HIGHER for FEMALES
Causes for Which Mortality is HIGHER for MALES
1960-62
1993-95
Figure 6b: Percent Contribution of Causes of Death to Sex Difference in White Mortality, Ages 40-64
-50% -40% -30% -20% -10% 0% 10% 20% 30% 40% 50% 60% 70% 80% HIV
Infections, pneumonia, influenza
Cancer, lung
Cancer, breast
Cancer, all other
Diabetes
Stroke
Circulatory diseases, excluding stroke Homicide
Accidents and injuries
All other causes
Symptoms and ill-defined conditions
Causes for Which Mortality is HIGHER for FEMALES
Causes for Which Mortality is HIGHER for MALES
1960-62
1993-95
Note: Cause-specific contributions are shown in the order indicated by the legend. Estimates for HIV/AIDS are only for the period 1993-1995.
Figure 7a: Cause-specific Contributions to CHANGE in Sex Difference in African American Mortality, Ages 40-64
-130% -110% -90% -70% -50% -30% -10% 10% 30% 50% 70% 90% 110% 130%
HIV
Infections, pneumonia, influenza Cancer, lung
Cancer, breast
Cancer, all other
Diabetes
Stroke
Circulatory disease, excluding stroke Homicide
Accidents and injuries
All other causes
Symptoms and ill-defined conditions
1960-72
1972-83
1984-95
Causes Contributing to a DECREASE in Sex Difference
Causes Contributing to an INCREASE in Sex Difference
Figure 7b: Cause-specific Contributions to CHANGE in Sex Difference in WhiteMortality, Ages 40-64
-130% -110% -90% -70% -50% -30% -10% 10% 30% 50% 70% 90% 110% 130%
HIV
Infections, pneumonia, influenza Cancer, lung
Cancer, breast
Cancer, all other
Diabetes
Stroke
Circulatory disease, excluding stroke Homicide
Accidents and injuries
All other causes
Symptoms and ill-defined conditions
1960-72
1972-83
1984-95
Causes Contributing to a DECREASE in Sex Difference
Causes Contributing to an INCREASE in Sex Difference
Note: Cause-specific contributions are shown in the order indicated by the legend. Estimates for HIV/AIDS are only for the period 1984-1995.
5. Discussion and conclusions
In this paper, we document changes in the sex difference in mortality in young adulthood and middle age among African Americans and whites during the latter half of the twentieth century in the United States. As a first step to explaining sources of variation in these differences over time we examine the contribution of leading causes of death to the sex difference in mortality in 1960-1962 and 1993-1995, as well as contributions various causes of death make to the change in the sex mortality difference over time. We chose to focus on this age range because sex differences in death rates at these ages make a large contribution to the sex difference in life expectancy at birth. We further split the age range into two parts: 15-39 and 40-64. The underlying cause-specific patterns differ between these two age groups as do cause-cause-specific contributions to changes in the sex mortality difference over time.
Sex differences in mortality have fluctuated more substantially for African Americans than for whites, and they have been larger for African Americans, except at ages 40-64 prior to 1970. Mortality trends for young African American males have been particularly adverse. Their age-standardized death rates increased by 12% from the early 1960s to mid-1990s, although mortality trends during this period were not uniformly negative. African American male death rates at ages 15-39 increased between 1960 and 1972 and 1984 and 1995, but fell substantially between 1973 and 1983. Mortality trends for young white men were also more adverse than for young white women, but less so than for African American men. At older ages, the sex mortality difference narrowed for whites, but it increased for African Americans.
In Table 4, we summarize our results and further highlight distinct cause-specific contributions to the change in sex difference in all-cause mortality and as well as cause-specific contributions to the change in black-white difference in all-cause mortality between 1960-1962 and 1993-1995. Note that in this table we have grouped HIV/AIDS with infections, pneumonia, and influenza to facilitate comparison with the earlier period.
Table 4: Absolute Change in the Difference in Age-Standardized Death Rates per 100,000 Persons between 1960-1962 and 1993-1995 for Selected Race-Sex Comparisons and Causes of Death, Ages 15-39 and 40-64 (difference in ASDR1993-95 − difference in ASDR1960-1962)
Ages 15-39
Cause of death BM-BW WM-WW BM-WM BW -WW
Infections, pneumonia, influenza, HIV/AIDS 58.75 25.12 48.40 14.77
Maternal Causes a a n.a. -12.11
Cancer 10.31 2.18 1.25 -6.88
Diabetes 1.38 -0.32 0.53 -1.17
Stroke 4.95 -0.05 -5.48 -10.48
Circulatory disease, excluding stroke 5.23 -7.14 -11.71 -24.08
Homicide 43.13 7.10 35.83 -0.20
Accidents and injuries c -18.20 -5.58 -17.66 -5.04
All other causes 19.96 4.18 -15.76 -19.43
Symptoms and ill-defined conditions 2.55 1.66 -3.16 -4.05
All-cause death rate 128.06 27.15 32.24 -68.67
Ages 40-64
Cause of death BM-BW WM-WW BM-WM BW -WW
Infections, pneumonia, influenza, HIV/AIDS 63.77 15.21 50.05 1.49
Cancer, lung 11.56 -25.88 39.15 1.71
Cancer, breast b b n.a. 17.72
Cancer, all other 66.96 25.94 19.74 -39.00
Diabetes 27.31 3.35 12.28 -11.68
Stroke 31.35 -9.98 -85.56 -126.89
Circulatory disease, excluding stroke 23.64 -220.50 48.19 -195.95
Homicide -8.40 1.41 -13.86 -4.05
Accidents and injuries c -22.23 -25.40 0.28 -2.89
All other causes 10.84 -30.47 18.79 -22.52
Symptoms and ill-defined conditions -0.98 -2.46 -23.62 -25.10
All-cause death rate 203.82 -268.78 65.44 -407.16
Note: Calculations based on Tables 2 and 3. BM: African American men; BW: African American women; WM: white men; WW: white women.
a. Maternal causes are combined with all other causes of death. b. Breast cancer is combined with cancer, all other.
c. Accidents and injuries refer to all other intentional and unintentional injuries, other than homicide.
are largely embedded in these social inequalities and their impact is felt most severely by African American men.
In addition to homicide, HIV/AIDS was a key factor explaining changes in the sex mortality difference in the late 1980s- early 1990s among both African Americans and whites. Although mortality from this cause increased for all groups examined, the increase in death rates was most pronounced for African American men at ages 15-64 (Appendix Tables A2 and A3, Table 4). Mortality trends from HIV/AIDS also contributed to the increase in black-white difference in male and female mortality. As the HIV/AIDS epidemic has evolved its impact has been increasingly felt by disadvantaged population subgroups with poor minority men being particularly affected, and this fact is reflected in our results as well. Not only are these individuals more likely to acquire the disease but they also have fewer resources to cope with HIV/AIDS and have less access to most advanced medical treatments (Smedley, Stith and Nelson 2002). HIV/AIDS and homicide account for a larger fraction of black-white differences in mortality in large metropolitan areas, particularly in their poorer neighborhoods, than in wealthier urban communities or in rural areas (Geronimus et al. 1996). Thus both causes of death impose a particularly heavy toll on African Americans residing in inner cities.
In contrast, sex differences in mortality from intentional and unintentional injuries declined from the early 1960s to mid-1990s for both African Americans and whites at ages 15-64 (Tables 2, 3 and 4). The more rapid decline in male than female mortality from accidents and injuries contributed to the narrowing of the sex difference from these causes after 1972 (Appendix Tables A2 and A3; Figure 5a, 5b, 7a and 7b). These results are consistent with those of other studies that have documented an absolute decline in the sex difference in death rates from motor vehicle accidents as well as many other, although not all, accidental deaths (Waldron, McCloskey and Earle 2005). The declining sex difference in mortality from motor vehicle accidents in turn has been traced at least in part to the decline in gender differences in the amount of driving and in driving under hazardous conditions (Ibid.).
1993-1995 and cardiovascular diseases contributed to the narrowing of the sex mortality difference among middle aged whites throughout the period examined. In contrast, the sex difference in cardiovascular disease mortality increased in the 1960s for African Americans, and although it subsequently narrowed after 1972, it remained slightly above its 1960 value in the mid-1990s.
Reductions in cardiovascular disease mortality have contributed not only to the decline in the sex mortality difference but also to the resumption of mortality decline in developed countries more generally in the latter half of the twentieth century. These declines have been attributed to behavioral changes, such as reduced levels of smoking, and to improvements in medical technologies to treat heart disease – drugs to dissolve blood clots, heart bypass surgery, angioplasty, and medications to reduce high blood pressure and cholesterol (Cutler and Meara 2004). Improved early childhood conditions and reduction in childhood infectious diseases may have also played a role (Elo and Preston 1992). Our results suggest that these behavioral changes and improved medical technologies have benefited white men more than white women. In our earlier work, we also found that the decline in cardiovascular disease mortality was more pronounced for white men than for black men, particularly after 1983 (Elo and Drevenstedt 2004). We hypothesize that new methods of treatment and prevention were first available to and adopted by better educated and well off white men and that medical interventions have been slower to benefit individuals from disadvantaged backgrounds. Mortality trends from cardiovascular diseases contributed to the widening of educational differentials in mortality in the latter half of the twentieth century, particularly among men (Feldman et al. 1989). In addition, a review of racial disparities in health care concluded that African Americans, relative to whites, are less likely to receive appropriate cardiac medication or undergo heart surgery “even when variations in such factors as insurance status, income, age, co-morbid conditions, and symptom expression are taken into account” (Smedley, Stith, and Nelson 2002:30). Yet we also find that the absolute difference in cardiovascular disease mortality between African American women and white women declined over time. In 1960-1962, African American female mortality from cardiovascular diseases, other than stroke, was nearly 3 times as high as cardiovascular disease mortality among white women with the absolute difference in death rates being 327 per 100,000. By mid-1990s, this difference had declined to 131 per 100,000 (Tables 2 and 3).
ages 40-64. This effect was more pronounced for whites than for blacks particularly after the early 1980s. By 1993-1995, the sex difference in lung cancer mortality among whites was smaller than it had been in the early-1960s. In contrast, despite the recent narrowing of the sex difference in lung cancer mortality among African Americans these declines had not yet overcome the widening of the sex difference in lung cancer mortality that occurred in the 1960s.
Our results provide a somewhat mixed picture of sex-specific mortality trends between the early 1960s and the mid-1990s. We find substantial fluctuations in these patterns over time, with sex differences in mortality having been more persistent and larger for African Americans than whites throughout most of the latter half of the twentieth century. Whatever explanations are ultimately offered for these trends, they must address the variations we have described.
6. Acknowledgements
References
Anderson RN, Rosenberg HM. (1998). “Age Standardization of Death Rates: Implementation of the Year 2000 Standard.” National Vital Statistics Reports 47:3. Hyattsville, MD: National Center for Health Statistics.
Arias E. (2002). “United States Life Tables, 2000.” National Vital Statistics Reports, 51:3. Hyattsville, MD: National Center for Health Statistics.
Bell FC, Wade AH, Goss SC. (1992). “Life Tables for the United States Social Security Area 1900-2080.” Actuarial Study 107. Baltimore, MD: Social Security Administration.
Centers for Disease Control. (2001a). CDC Wonder Website. . http://wonder.cdc.gov/. Centers for Disease Control. (2001b). "U.S. Census, 1970-96. Description and
Methodology for Data Available on CDC Wonder." http://wonder.cdc.gov/wonder/cens.html.
Crimmins E. (1981). “The Changing Pattern of American Mortality Decline, 1940-77, and its Implications for the Future.” Population and Development Review 7(2): 229-254.
Cutler DM, Meara E. (2004). “Changes in the Age Distribution of Mortality over the Twentieth Century.” Pp. 333-365 in Wise DE. ed. Perspectives on the Economics of Aging. Chicago: University of Chicago Press.
Elo IT, Preston SH. (1992). “Effects of Early Life Conditions on Adult Mortality: A Review.” Population Index, 58: 186-212.
Elo IT. (2001). “New African American Life Tables from 1935-40 to 1985-90.” Demography, 38(1):97-114.
Elo IT, Drevenstedt GL. (2004). “Cause-Specific Contributions to Black-White Differences in Male Mortality from 1960 to 1995.” Demographic Research, Special Collection 2: 255-276.
Enterline PE. (1960). “Causes of Death Responsible for Recent Increases in Sex Mortality Differentials in the United States.” Milbank Memorial Fund Quarterly, 39: 312-28.
Geronimus AT, Bound J, Waidmann TA, Hillemeier MM, Burns PB. (1996). “Excess Mortality among Blacks and Whites in the United States.” New England Journal of Medicine, 335:1552-8.
Gragnolati M, Elo IT, Goldman N. (1999). “New Insights into the Far Eastern Pattern of Mortality.” Population Studies, 53:81-95.
Hammett M, Powell KE, O’Carroll PW, Clanton ST. (1992). “Homicide Surveillance – United States, 1979-1988.” Morbidity and Mortality Weekly Report, 41:1-31.
Horiuchi S. (1999). “Epidemiological Transitions in Developed Countries: Past, Present and Future.” Health and Mortality Issues of Global Concern. Proceedings of the Symposium on Health and Mortality, Brussels, 19-22 November 1997. New York: United Nations. Pp. 54-71.
Hsieh CC, Pugh MD. (1993). “Poverty, Income Inequality, and Violent Crime: A Meta-Analysis of Recent Aggregate Data Studies.” Criminal Justice Review, 18(2): 182-202.
Israel RA, Rosenberg HM, Curtin LR. (1986). “Analytical Potential for Multiple Cause-of-Death Data.” American Journal of Epidemiology, 124(2):161-179. Johansson SR. (1991). “Welfare, Mortality, and Gender. Continuity and Change in
Explanations for Male/Female Mortality Differences over Three Centuries.” Continuity and Change, 6(2): 135-177.
Knudsen C, McNown R. (1993). “Changing Causes of Death and the Sex Differential in the USA.” Population Research and Policy Review, 12:27-41.
Kochanek KD, Maurer JD, Rosenberg HM. (1994). “Why Did Black Life Expectancy Decline from 1984 through 1989 in the United States?” American Journal of Public Health, 84(6):938-944.
Manton KG, Patrick CH, Johnson KW. (1987). “Health Differentials between Blacks and Whites: Recent Trends in Mortality and Morbidity.” Milbank Quarterly, 65(Suppl. 1):129-199.
Massey DS. (1995). “Getting Away with Murder: Segregation and Violent Crime in Urban America.” University of Pennsylvania Law Review, 143: 1203-32.
Nathanson CA, Lopez AD. (1987). “The Future of Sex Mortality Differentials in Industrialized Countries: A Structural Hypothesis.” Population Research and Policy Review, 6: 123-136.
National Center for Health Statistics. (1954). United States Life Tables 1949-51. Washington, DC: U.S. Government Printing Office.
National Center for Health Statistics. (1964). The Change in Mortality Trends in the United States. Series 3, No.1. Washington, DC: U.S. Government Printing Office.
National Center for Health Statistic. (1975). U.S. Decennial Life Tables for 1969-71. Vol. 1, No. 1. Washington, DC: U.S. Government Printing Office. (DHEW publication no. HRA 75-1150).
National Center for Health Statistics. (1989). “Advance Report of Final Mortality Statistics, 1987.” Monthly Vital Statistics Report, 38(5):Supplement. Hyattsville, MD: Public Health Service.
National Center for Health Statistics. (1997). U.S. Decennial Life Tables for 1989-91. Vol. 1, No. 1. Washington, DC: U.S. Government Printing Office.
National Center for Health Statistics. (1998a). Vital Statistics of the United States, 1995, reprint of Volume II, mortality, Part A, sec 6 life tables. Hyattsville, MD: Public Health Service.
National Center for Health Statistics. (1998b). Health United States, 1998. With Socioeconomic Status and Health Chartbook. Hyattsville, MD: National Center for Health Statistics.
Pampel FC. (2003). “Declining Sex Differences in Mortality from Lung Cancer in High-Income Nations.” Demography, 40(1): 45-65.
Pampel FC, Zimmer C. (1989). “Female Labour Force Activity and the Sex Differential in Mortality: Comparisons across Developed Nations, 1950-1980.” European Journal of Population, 5: 281-304.
Peterson RD, Krivo LJ. (1993). “Racial Segregation and Black Urban Homicide.” Social Forces, 71(4):1001-26.
Phillips J. (1997). “Variation in African American Homicide Rates: An Assessment of Potential Explanations.” Criminology, 35(4): 527-559
Preston SH, Elo IT, Foster A, Fu H. (1998). “Reconstructing the Size of the African American Population by Age and Sex, 1930-1990.” Demography, 35(1):1-21. Robinson JG, Ahmed B, Gupta PD, Woodrow KA. (1993). “Estimation of Population
Coverage in the 1990 United States Census based on Demographic Analysis.” Journal of American Statistical Association, 88: 1061-71.
Rosenberg HM. (1999). "Cause of Death as a Contemporary Problem." Journal of the History of Medicine, 54: 133-153.
Smedley BD, Stith AY, Nelson AR, eds. 2002. Unequal Treatment: Confronting Racial and Ethnic Disparities in Health Care. Washington, DC: National Academy Press.
Trovato F, Lalu NM. (1996). “Narrowing Sex Differentials in Life Expectancy in the Industrialized World: Early 1970s to Early 1990s.” Social Biology, 43:20-37. United Nations. (1982). Levels and Trends of Mortality Since 1950. New York: United
Nations.
U.S. Bureau of the Census. (1974). Estimates of the Population of the United States, by Age, Sex, and Race: April 1, 1960 to July 1, 1973. Washington, DC: U.S. Government Printing Office. (Current Population Reports, Series P-25, No. 519.)
U.S. Bureau of the Census. (1988). The Coverage of Population in the 1980 Census. Washington, DC: U.S. Government Printing Office. (Census publication no. PHC80-E4.)
Vallin J. (1993). “Social Change and Mortality Decline: Women’s Advantage Achieved or Regained?” Pp. 190-212 in Federici N., Mason KO., and Sogner S., eds. Women’s Position and Demographic Change. Oxford: Clarendon Press.
Verbrugge LM. (1976). “Sex Differentials in Morbidity and Mortality in the United States.” Social Biology, 23(4):275-296.
Waldron I. (1983). “Sex Differences in Human Mortality: The Role of Genetic Factors.” Social Science and Medicine, 17: 321-33.
Waldron I. (1993). “Recent Trends in Sex Mortality Ratios for Adults in Developed Countries.” Social Science and Medicine, 36(4): 451-462.
D., Gordon DF., eds. Men’s Health and Illness. Thousand Oaks, CA: Sage Publications.
Waldron I. (2000). “Trends in Gender Differences in Mortality: Relationship of Changing Gender Differences in Behavior and Other Causal Factors.” Pp. 150-81 in Annandale E., Hunt K., eds. Gender Inequality and Health. Philadelphia: Open University Press.
Waldron I., McCloskey C., Earle I. (2005). “Trends in Gender Differences in Accidents Mortality: Relationships to Changing Gender Roles and Other Societal Trends. Demographic Research: Vol. 13, Article 17.
White KW, Preston SH. (1996). “How Many Americans Are Alive Because of Twentieth Century Improvements in Mortality?” Population and Development Review, 22:415-29.
Williams DR. (2001). “Racial Variations in Adult Health Status: Patterns, Paradoxes and Prospects.” Pp. 371-410 in Smelser NJ., Wilson WJ., Mitchell F., eds. America Becoming: Racial Trends and Their Consequences. Volume II. Washington, DC: National Academy Press.
Williams DR, Collins C. (1995). “U.S. Socioeconomic and Racial Differentials in Health: Patterns and Explanations.” Annual Review of Sociology, 21:349-386. Zhang XH, Sasaki S, Kesteloot H. (1995). “The Sex Ratio of Mortality and its Secular
Appendix
Table A1: International Classification of Disease (ICD)
Numbers for Each Cause Group, According to ICD Revision
Title Seventh Revision
(1960-67)
Eighth Revision (1968-78)
Ninth Revision (1979-95)
HIV infection N/A N/A 279.1 (1984-86),
042-044 (1987-95)
Infections, pneumonia, influenza
001-138, 480-493 000-136, 470-486 001-139, 480-487
Maternal causes 640-689 630-678 630-676
Cancer, lung 162-163 162 162
Cancer, breast 170 174 174
Cancer, all other
140-161,164-165,171-239
140-161,163-173,180-239
140-161, 163-173,175-239
Diabetes 260 250 250
Stroke 330-334 430-438 430-438
Circulatory diseases (ex. stroke)
400-468 390-429, 440-458 390-429, 440-459
Homicide E980-E985 E960-E978 E960-E978
Accidents and injuries E800-E965,
E990-E999
E800-E949, E980-E999
E800-E949, E980-E999
Symptoms and ill- defined conditions
780-795 780-796 780-799
All other causes 240-254, 270-326,
340-398, 470-637, 690-776
240-246, 251-389, 460-629, 680-779
240-246, 251-389, 460-629, 680-779
Table A2: Proportionate Contribution of Each Cause of Death Group to Change in the Sex Difference in African American and White Age- Standardized Death Rates at Ages 15-39 by Time Period, 1960-1995
African Americans 1960-1972 1973-1983 1984-1995
Cause of death group
Increase in sex diff. Decrease in sex diff. Increase in sex diff. Decrease in sex diff. Increase in sex diff. Decrease in sex diff.
HIV N/A N/A N/A N/A 0.7209
Infections, pneumonia, influenza
0.0313 0.0063 0.0531
Maternal causes 0.0737 0.0301 0.0017
Cancer 0.0415 0.0400 0.0038
Diabetes 0.0045 0.0041 0.0070
Stroke 0.0268 0.0151 0.0116
Circulatory disease, ex. stroke
0.0598 0.0043 0.0617
Homicide 0.3809 0.4176 0.5852
Accidents and injuries 0.2143 0.4339 0.0483
All other causes 0.1414 0.1659 0.1352
Symptoms and ill-def. conditions
0.0249 0.0823 0.0023
1960 1972 1973 1983 1984 1995 Sex difference in
African American age-standardized death rate per 100,000 population
86.64 244.78 227.21 149.09 156.13 207.86
Whites 1960-1972 1972-1983 1984-1995
Cause of death group
Increase in sex diff. Decrease in sex diff. Increase in sex diff. Decrease in sex diff. Increase in sex diff. Decrease in sex diff.
HIV N/A N/A N/A N/A 1.2478
Infections, pneumonia, influenza
0.0054 0.0168 0.0388
Maternal causes 0.0910 0.0122 0.0024
Cancer 0.1139 0.0307 0.0245
Diabetes 0.0129 0.0055 0.0017
Stroke 0.0266 0.0216 0.0027
Circulatory disease, ex. stroke
0.1041 0.0354 0.0948
Homicide 0.2341 0.1186 0.1536
Accidents and injuries 0.6315 0.8879 0.3167
All other causes 0.0621 0.0280 0.0137
Symptoms and ill-def. conditions
0.0249 0.0005 0.0120
1960 1972 1973 1983 1984 1995 Sex difference in white
age-standardized death rate per 100,000 population
83.02 96.24 102.84 89.23 89.91 105.46
Note: Proportionate contributions may not add to 1.00 due to rounding. Significant coefficients at 0.05-level are in bold and at 0.10-level in italics.