ENGINEERING AND GINNING
Evaluation of a Mass Flow Sensor at a Gin
Ruixiu Sui* and Richard K. Byler
R. Sui*, USDA ARS, Crop Production Systems Research Unit, PO Box 350, 141 Experiment Station Rd., Stoneville, MS 38776 and R. Byler, USDA ARS, Cotton Ginning Research Unit, PO Box 256, 111 Experiment Station Rd., Stoneville, MS 38776.
*Corresponding author: [email protected]
AbStRAct
As part of a system to optimize the cotton
gin-ning process, a custom-built mass flow sensor was
evaluated at USDA ARS cotton Ginning Research
Unit at Stoneville, Mississippi. The mass flow sen -sor was fabricated based on the principle of the sensor patented by thomasson and Sui. the opti-cal and electronic components of the sensor were housed in a single aluminum unit with mounting magnet, which made it easy to install and maintain. to obtain a calibration of the sensor, the total mass
flow past the sensor was measured over known
periods of time. to evaluate the effect of cotton cultivar on the sensor, a test of the sensor with two cotton cultivars was conducted using a micro-gin to
compare lint mass flow with sensor output. Results
showed that the sensor output was closely corre-lated with the lint mass, which passed through the sensor (r2 = 0.87), and the effect of cotton cultivar
on the output of sensor was not significant. This demonstrated that the mass flow sensor can mea
-sure the total lint flow over a period of time in the
gin and provide valuable information to the ginner.
A
n automatic control system for cotton ginning process control has great potential in reducinglabor costs, preserving fiber quality, and increasing
operation efficiency at cotton gins. Real-time
measurement of cotton flow at various stages of ginning will be one of the most critical components in the control system. Several optical cotton flow
measurement systems have been developed and tested in recent years on cotton harvesters. Wilkerson et al. (1994) developed an optical attenuation-based sensor
to measure cotton flow. This system was significantly modified and improved (Moody et al. 2000; Wilkerson
et al., 2002) and marketed beginning in 2000 as
the AgLeader (Ames, IA) Cotton Yield Monitor. Thomasson et al. (1999) designed and fabricated
two light sensing-bar devices for measuring the flow of pneumatically conveyed cotton. FarmScan
(Perth, Western Australia), Micro-Trak(Eagle
Lake, MN), and Zycom/AGRIplan (Stow, MA)
have manufactured commercial optical cotton yield
monitors using optical cotton-flow sensors since 1997. These cotton mass flow sensors were evaluated with cotton harvesters under field conditions (Durrence et al., 1998; Roades et al., 2000; Sassenrath-Cole et al., 1999; Wolak et al., 1999; Vellidis et al., 2003).
In addition to being used to measure cotton flow on cotton harvesters, the optical mass flow sensors
have also been tested at gins. The light-sensing bar
devices reported by Thomasson et al. (1999) were
tested in collecting data in the seed cotton unload-ing duct of a gin and a lint-cleaner-exhaust duct.
Results indicated a strong correlation between the output of the devices and the material flow (Thom
-asson et al., 1999; Whitelock and Thomson, 1998). Moody et al. (2000) tested the mass flow sensor
developed by Wilkerson et al. (1994) at a gin. The
sensor was installed in a pneumatic seed cotton conveying duct to measure the cotton flow with 59 loads. Data from the first 10 loads were used to calibrate a flow prediction model. Results showed that 48 of 49 total load weights were measured by the sensor to within 10 percent of true values. Mois -ture content (MC) of the cotton and cultivar had a detectable effect on measurement accuracy. Barker
et al. (2000) evaluated several mass flow sensors, including a light bar array to detect the mass flow
rate of stripper-harvested cotton. They obtained a very strong correlation (r2=0.98) between the output
signal of the light bar array and mass flow rate of
the cotton through the pipes. Gvili (2001) tested a
cotton flow sensor at a gin. Measurement accuracies in the range of 5% were achieved.
All of the cotton flow sensors mentioned above used optical detectors. The sensors were based on the same principle and are similar in configuration and operation. Each sensor unit has two parts, a light
measure light attenuation caused by cotton particles passing through the duct. Thus, their installation
requires two ports to be cut in the duct and proper
alignment of the emitter array and a
light-detector array. This creates difficulties in installation
and possible misalignment over time due to vibration of the sensor.
Thomasson and Sui (2000) and Sui and
Thom-asson (2002) reported an optical reflectance-based mass flow sensor. Their sensor included light source
and detectors mounted in one housing unit on the
same wall of a pneumatic duct, thus requiring only one port to be cut in the duct. Such a configuration minimizes the difficulty of installation and mainte
-nance, and removes any requirement for alignment of sensor parts. This mass flow sensor has been used as a cotton yield monitor and has been field tested since 1999 (Ge et al., 2008; Sui et al., 2004; Thomasson and Sui, 2003; Vellidis et al., 2003). Test results indicated the sensor was reliable and
easy to install, operate, and maintain on a harvester.
However, this sensor has not been used to measure cotton flow at a gin.
Mass flow sensors used on cotton harvesters would need to be adapted for use in cotton gins
because of the different operating environment and different demands. When the seed cotton enters the
gin it is similar to what was harvested in the field,
but after processing, the composition of the material
has changed, and after ginning the flow pattern of the fiber in the air stream is considerably different
from that of the seed cotton.
The objectives of the study in this phase were
to 1) evaluate the functionality and accuracy of the sensor by measuring different total masses of cotton lint produced by the gin stand, and 2) test the effect
measurement using two cultivars with different lint
properties.
MAtERIAlS AND MEthoDS
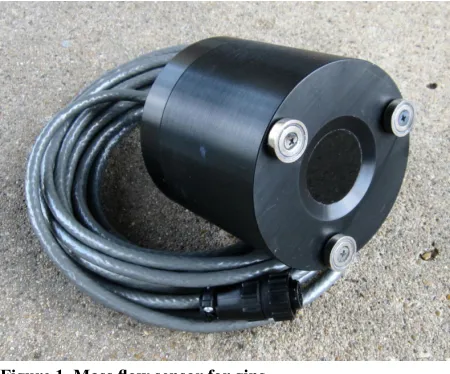
Mass flow Sensor Description. A mass flow sensor was fabricated based on the principle of the
sensor patented by Thomasson and Sui (2004). All
components were housed in a single aluminum unit with mounting magnets, which made it easy to install and maintain (Fig. 1). The sensor was 120 mm long and 115 mm in diameter with a 4.5 m long cable. The sensor was designed to detect a mass by sensing the reflectance properties of the measured material
as the material passes the sensor. The sensor had an
anti-stray-light feature. Therefore, ambient light fluc -tuations did not affect its performance (Thomasson
and Sui, 2004). Furthermore, the mass flow sensor
included a built-in temperature control so that the
sensor’s internal temperature was controlled which improved accuracy and stability of the sensor when
used under varying temperatures.
Figure 1. Mass flow sensor for gins.
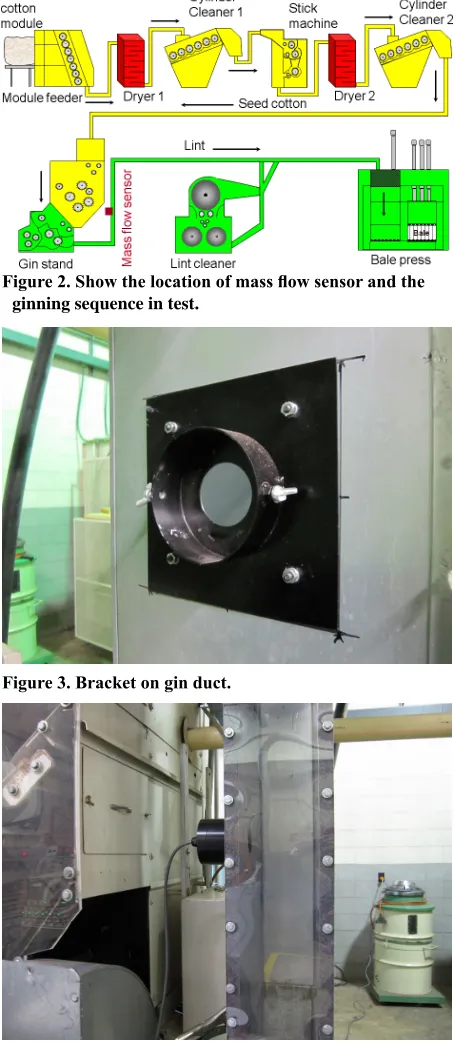
Sensor Installation and Data Acquisition. The sensor was installed at the Micro-Gin of USDA
ARS Cotton Ginning Research Unit (CGRU) at
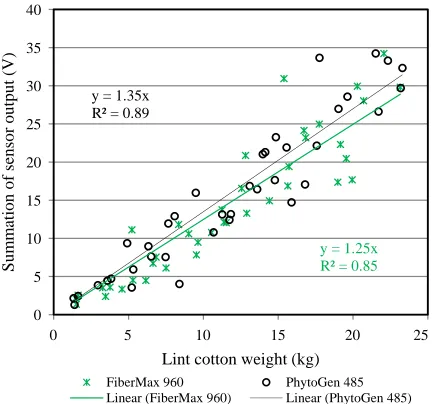
Stoneville, Mississippi (Fig 2). A bracket was built for installation of the mass flow sensor (Fig. 3). The bracket was made of sheet metal with a 76 mm
diameter hole and a 30 mm high x 115 mm diam-eter circular holder at center. One 76 mm diamdiam-eter
hole was cut in the conveying duct (380 Wx150 D
mm) after the gin stand and before the lint cleaner
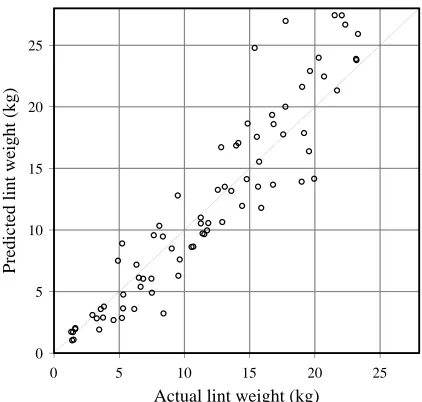
for installing the sensor (Fig 2). The bracket was mounted on the duct aligning the central hole with the hole cut in the duct. The mass flow sensor was placed into the circular holder with its window toward duct. The sensor was firmly attached to the bracket by the three magnets on the sensor and two screws on the holder (Fig. 4).
The mass flow sensor was connected to a data acquisition unit reported by Sui and Thomasson
(2006). The unit included a 206-MHz, 32-bit CPU and an 8-channel 12-bit analog–to-digital converter
(ADC). The analog signal from the mass flow sen
-sor was input to the ADC and then collected by a single board computer in the unit. Sensor data were
displayed on a screen and stored in a memory card.
Embedded Visual Basic was used as the program
test Procedures. To evaluate performance of the
sensor in measuring lint-flow at the gin and test the
effect of cotton cultivar on the performance of the
sensor, a test was conducted on July 19 and 20, 2010. The sensor and data acquisition unit was turned on 30 minutes before the test to allow the sensor to warm up. Two cultivars of cotton, FiberMax 960B2 (Bayer Crop -Science, Research Triangle Park, NC) and PhytoGen
485WRF (
Dow AgroSciences,
Indianapolis, IN) were
used in the test. The cotton was harvested using a cotton picker. Thirty-nine seed cotton samples with a weight
range from around 4.5 kg to 58.5 kg of each cultivar
ginned in random order with the measurement system collecting data. The seed cotton samples were divided into 13 levels based on their weight, with around 4.5 kg increments. As the cotton was ginned and the lint
conveyed past the sensor, the data output from the
sensor was recorded with the data acquisition unit that reads the sensor output at a frequency of about 50 Hz
and stores the average of the readings in each second.
Seed cotton samples were weighed before being ginned and the lint weights were determined after the flow data were collected. The ginning sequence included dryer
1, cylinder cleaner, stick machine, dryer 2, cylinder
cleaner, extractor feeder gin stand, and saw-type lint cleaner (Figure 2). There was no heat added in the dry -ers in the ginning process. Three sub-samples of lint
were collected after the lint cleaner from each sample for MC determination and testing with Advanced Fiber Information System (AFIS) and High Volume Instru
-ment (HVI). All lint samples were analyzed at the
USDA ARS CGRU at Stoneville, MS and the USDA ARS SRRC (Southern Regional Research Center) to
determine the effect of fiber quality on performance of the sensor. Fiber quality parameters, including trash content, reflectance, yellowness, and short fiber content (SFC), were measured with AFIS and HVI tests. MC was determined by the conventional oven method
(Shepherd, 1972).
Data Analysis. Average of ten minimum output
values of the mass flow sensor with each sample was
calculated and used as a baseline of sensor output
for the sample. Sensor output was corrected by sub -tracting the baseline from the original output value.
After baseline correction, sensor output values were accumulated over the ginning time with each sample. Linear regression was then used to determine the relationship between the lint weight and the summa
-tion of sensor output. Lint weights were computed using the regression functions and compared with the actual lint weights of the samples. Lint weight residu
-als were -also calculated by subtracting the predicted weights from the actual weights. The residuals were
graphically analyzed to determine the suitability of
the regression model. Signal-to-weight ratio (STWR) was calculated by dividing the summation of sensor output by the lint weight. One-way ANOVA and a Tukey post-hoc test were conducted with SAS to
compare the effect of the cotton cultivar on the STWR.
Figure 2. Show the location of mass flow sensor and the
ginning sequence in test.
Figure 3. Bracket on gin duct.
Figure 4. The mass flow sensor installed on a duct behind
Cultivar differences in fiber moisture content and fiber quality; including micronaire, reflectance, yellowness, SFC, and trash content were also analyzed using an ANOVA test. Additionally PROC MEANS procedure was used to calculate the mean, standard deviation, standard error, maximum, and minimum of the fiber quality data, turnout, and the STWR.
RESUltS AND DIScUSSIoN
Sensor Performance. The mass flow sensor performed well during the test. As the cotton passed the sensor, the output of the sensor varied with the change of cotton mass flow (Fig. 5a and 5b). Though the mass flow rate was not intentionally controlled in this phase of study, the mass flow rate did change
due to the variation of operational condition of the gin such as the fan speed and seed cotton feeding rates.
The lint flow rate for data shown in fig. 5a was 2.92kg/ min while it was 2.55kg/min for the data shown in fig. 5b. The higher mass flow rate generated greater
sensor output values. Fluctuation of the sensor output
was about 0.5 V across the range of mass flow rates in
the test. The maximum output range of the sensor is
3.8 V. Fig. 6a shows the correlation between lint-flow weight and the sensor output with cultivars FiberMax
960B2 and PhytoGen 485WRF. Fig. 6b is a plot of
the lint-flow weight versus the sensor output using combined data of the two cultivars. Both figure 6a and 6b indicated that the lint weight measured by the sensor was closely correlated with summation of the
sensor output (r2=0.87). Lint weights calculated using
the regression function shown in Fig 6b were plotted against the actual weights (Fig. 7). Fig. 8 showed a plot of lint weight residuals versus the actual lint weights of samples. The residuals appeared to behave randomly, suggesting that the models fit the data well.
Sensor output data indicated that the baseline varied about ±6% over the tests. This change had
sig-nificant effect on sensor accuracy. Baseline drift could
be mainly caused by the instability of the light emitting
diode (LED) that was the light source of the sensor without going through an aging process in this case. The
baseline could be expected to become more consistent
as the LEDs pass their aging period. However, baseline
drift could also be attributed to other issues like noise
in electronic circuitry, sensor window contamination,
and operational temperature and humidity variation. An effective method to solve this baseline problem could be to detect the baseline and make baseline correction of
the sensor output in real time during the data acquisition.
Figure 5a. Mass flow sensor output as cotton passed by the sensor at a higher flow rate (2.92kg/min).
0 0.1 0.2 0.3 0.4 0.5
0 100 200 300 400 500
Sen
sor
o
ut
pu
t (
V
)
Time (second)
Figure 5b. Mass flow sensor output as cotton passed by the sensor at a lower flow rate (2.55kg/min).
0 0.1 0.2 0.3 0.4 0.5
Sen
so
r o
utp
ut
(V)
Time (second)
0 100 200 300 400 500
y = 1.25x R² = 0.85
y = 1.35x R² = 0.89
0 5 10 15 20 25 30 35 40
0 5 10 15 20 25
Su
mm
ati
on
of
sensor
ou
tpu
t (V
)
Lint cotton weight (kg)
FiberMax 960 PhytoGen 485 Linear (FiberMax 960) Linear (PhytoGen 485) Figure 6a. correlation of sensor output versus total lint
weight with the cultivar FiberMax 960B2 and PhytoGen
The sensor’s optical window remained fairly
clean throughout the test. The method used in sensor
installation worked effectively. No maintenance for the sensor was required during the test. However, cotton tags were occasionally created inside the duct on the bolt heads that were used in mounting the bracket. It was possible that the tag could be viewed
by the sensor causing a “false” output signal, and generate the measurement error. This issue can be
solved by welding the bracket onto the duct instead of mounting it by using screws.
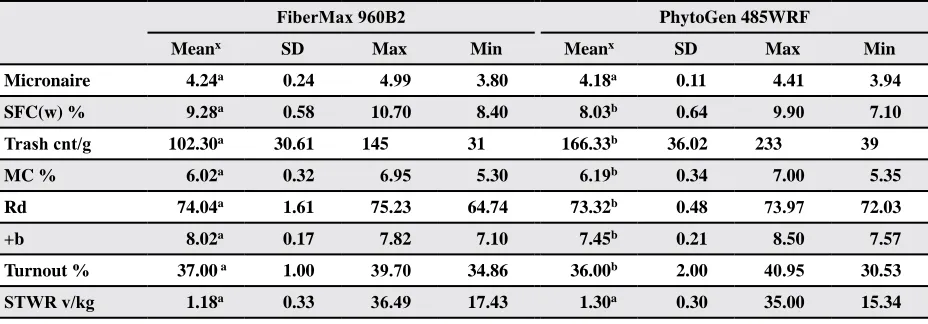
Fiber Quality and turnout. Table 1 shows major fiber quality factors of the cotton used in the test. A one-way ANOVA test revealed that SFC in the samples differed significantly as a function of the cultivar (F (1,
76) = 81.63, p < 0.0001). FiberMax samples had higher SFC (M = 9.28%, SD = 0.58%) than PhytoGen samples
(M = 8.03%, SD = 0.64%). The one-way ANOVA
tests also indicated that the effect of cultivar on trash content (F (1, 76) = 71.54, p < 0.0001) was significant.
There was more trash (M = 166.33 cnt/g, SD = 36.02
cnt/g) in PhytoGen samples than the trash (M = 102.31 cnt/g, SD = 30.61 cnt/g) in the FiberMax. MC of the
PhytoGen samples was a little higher (M = 6.19%, SD
= 0.34%) than that of the FiberMax (M = 6.02%, SD =
0.32%), but the ANOVA test showed the difference was statistically significant (F (1, 76) = 5.25, p = 0.0214).
The ANOVA test revealed fiber reflectance (Rd) of the FiberMax and PhytoGen cultivar was significantly
different (F (1, 76) = 7.32, p = 0.0084). And their fiber
yellowness was also significantly different (F (1, 76)
= 182.61, p < 0.0001). Means of the micronaire value
were 4.24 (SD = 0.24) with the FiberMax samples and 4.18 (SD = 0.11) with the PhytoGen. They were not significantly different (F (1, 76) = 1.89, p = 0.1737). Turnout of FiberMax cultivar (M = 37%, SD = 1%)
was one percent higher than the PhytoGen (M = 36%, SD = 2%). However, the difference was statistically significant (F (1, 76) = 5.54, p = 0.0212).
Effect on Sensor output. A one-way ANOVA test revealed that STWR did not differ significantly
as a function of cotton cultivar (F (1, 75) = 2.92, p
= 0.0917). Tukey post-hoc comparison of the two cultivars indicated that STWR of the sensor with
FiberMax samples (M = 1.18 v/kg, SD = 0.33 v/
kg) was not significantly different from that with
PhytoGen samples (M = 1.30 v/kg, SD = 0.30 v/kg)
(Table 1). Results showed that effect of the cotton cultivar on the sensor’s performance was not sig
-nificant although fiber quality of the cotton differed significantly between the cultivars.
0 5 10 15 20 25 y = 1.299x
R² = 0.868
0 5 10 15 20 25 30 35 40
Su
m
of
sen
sor
o
ut
pu
t (
V
)
Total lint weight (kg)
Figure 6b. correlation of sensor output versus lint weight using the combined data of the two cultivars.
0 5 10 15 20 25
0 5 10 15 20 25
Predicted lint weight (kg)
Actual lint weight (kg)
Figure. 7 Actual total lint weight versus predicted lint weight.
0 5 10 15 20 25
Actual lint weight (kg)
-10 -8 -6 -4 -2 0 2 4 6 8
Lint weight residual (kg)
Moisture and trash content of the cotton could
be two key factors which may negatively affect the
sensor performance because either can change
spec-tral characteristics of the cotton. However, this study
indicated that the variation of moisture and trash
content in the samples did not significantly affect the sensor output. The mass flow sensor functioned well in measuring lint flow at gin. However, the
cotton processed at gins has a greater range of vari-ability than the cotton used in this study. Maximum tolerance of the sensor to the variation of cotton properties, including MC and trash content, needs to be further evaluated.
coNclUSIoNS
A mass flow sensor was built and evaluated with two different cultivars of cotton to predict lint mass flow at a gin. The mass flow sensor was installed on a conveying duct between the gin stand and the first lint cleaner. Lint weight showed a close correlation with the accumulated sensor output (r2 = 0.87). It was
qualitatively observed that higher lint flow rate gen
-erated greater sensor output though the lint flow rate was not directly controlled in this phase of the study. Fiber quality of two cotton cultivars used in the test was analyzed using AFIS and HVI tests. The results indicated that the SFC, trash content, reflectance, yellowness, and MC differed significantly. Sensor output was not significantly affected by cultivar.
Baseline drift of sensor output and its affect on
sen-sor accuracy was observed. Sensen-sor baseline needs
to be detected and corrected in real time for
improv-ing sensor’s accuracy. The flow rate sensitivity and moisture sensitivity of the sensor will be tested in next phase of the study. The mass flow sensor was
easy to install and maintain. It has the potential to be used for the control of cotton ginning processes.
AckNoWlEDGEMENtS
The authors would like to extend their apprecia -tion to the staff of USDA ARS CGRU at Stoneville, MS and Mr. Chris Delhom of USDA ARS SRRC at
New Orleans, LA for their assistance in this study.
DISclAIMER
Mention of a commercial product is solely for
the purpose of providing specific information and
should not be construed as a product endorsement
by the authors or the institutions with which the authors are affiliated.
REFERENcES
Barker, G.L., M.G. Pelletier, J.W. Laird, and A.D. Brashears.
2000. Evaluation of mass flow sensors for stripper
harvested cotton. p. 1574-1577. In Proc. Beltwide Cot -ton Conf., San An-tonio, TX. 4-8 Jan. 2000. Natl. Cot-ton Counc. Am., Memphis, TN.
Durrence, J.S., C.D. Perry, G. Vellidis, D.L. Thomas, and
C.K. Kvien. 1998. Evaluation of commercially available
cotton yield monitors in Georgia field conditions, ASAE
Paper No. 983106. ASABE, St. Joseph, MI.
Ge, Y., J.A. Thomasson, R. Sui, C.L. Morgan, S.W. Searcy,
and C.B. Parnell. 2008. Spatial variation of fiber quality
and associated loan rate in a dryland cotton field. Preci
-sion Agric. 9:181-194.
Gvili, M. 2001. Cotton flow monitoring system for gins. p.
1410-1412. In Proc. Beltwide Cotton Conf., Anaheim, CA.
9-13 Jan. 2001. Natl. Cotton Counc. Am., Memphis, TN.
Table 1. Summary of fiber quality parameters of cotton cultivars used in the test and the effect of the cultivar on STWR.
FiberMax 960B2 PhytoGen 485WRF
Meanx SD Max Min Meanx SD Max Min
Micronaire 4.24a 0.24 4.99 3.80 4.18a 0.11 4.41 3.94
SFc(w) % 9.28a 0.58 10.70 8.40 8.03b 0.64 9.90 7.10
Trash cnt/g 102.30a 30.61 145 31 166.33b 36.02 233 39
Mc % 6.02a 0.32 6.95 5.30 6.19b 0.34 7.00 5.35
Rd 74.04a 1.61 75.23 64.74 73.32b 0.48 73.97 72.03
+b 8.02a 0.17 7.82 7.10 7.45b 0.21 8.50 7.57
turnout % 37.00 a 1.00 39.70 34.86 36.00b 2.00 40.95 30.53
STWR v/kg 1.18a 0.33 36.49 17.43 1.30a 0.30 35.00 15.34
Moody, F.H., J.B. Wilkerson, W.E. Hart, J.E. Goodwin, and
P.A. Funk. 2000. Non-intrusive flow rate sensor for har
-vester and gin application. p. 410-415. In Proc. Beltwide
Cotton Conf., San Antonio, TX. 4-8 Jan. 2000. Natl. Cotton Counc. Am., Memphis, TN.
Roades, J.P., A.D. Beck, and S.W. Searcy. 2000. Cotton yield mapping: Texas experiences in 1999. p. 404-408. In Proc.
Beltwide Cotton Conf., San Antonio, TX. 4-8 Jan. 2000.
Natl. Cotton Counc. Am., Memphis, TN.
Sassenrath-Cole, G.F., S.J. Thomson, J.R. Williford, K.B. Hood, J.A. Thomasson, J. Williams, and D. Woodard. 1999. Field testing of cotton yield monitors. p. 364-366.
In Proc. Beltwide Cotton Conf., Orlando, FL. 3-7 Jan.
1999. Natl. Cotton Counc. Am., Memphis, TN.
Shepherd, J. V. 1972. Standard procedures for foreign matter
and moisture analytical tests used in cotton ginning research. USDA Agricultural Handbook No. 422.
Sui, R., and J.A. Thomasson. 2002. Test of temperature and
stray-light effects on mass-flow sensor for cotton yield
monitor. Appl. Eng. Agric. 18(4): 127-132.
Sui, R., and J.A. Thomasson. 2006. Ground-Based Sensing System for Cotton Nitrogen Status Determination. Trans. of the ASABE. 49(6):1983-1991.
Sui, R., J.A. Thomasson, R.Mehrle, M. Dale, C. Perry, and G. Rains. 2004. Mississippi Cotton Yield Monitor: Beta test for Commercialization. Comput. Electron. Agr. 42(3):149-160.
Thomasson, J.A., D.A. Pennington, H.C. Pringle, E.P. Colum-bus, S.J. Thomson, and R.K. Byler. 1999. Cotton mass
flow measurement: experiments with two optical devices.
Appl. Eng. Agric. 15(1): 11-17.
Thomasson, J.A., and R. Sui. 2000. Advanced optical cotton yield monitor. p. 408-410. In Proc. Beltwide Cotton
Conf., San Antonio, TX. 4-8 Jan. 2000. Natl. Cotton Counc. Am., Memphis, TN.
Thomasson, J.A. and R. Sui. 2003. Mississippi Cotton Yield Monitor: Three Years of Field Test Results. Appl. Eng. Agric. 19(6): 631-636.
Thomasson, J.A., and R. Sui. 2004. Optical-Reflectance-Based Mass-Flow Sensor. US Patent No.: 6,809,821
Vellidis, G., C.D. Perry, G.C. Rains, D.L. Thomas, N. Wells,
and C.K. Kvien. 2003. Simultaneous assessment of cot-ton yield monitors. Appl. Eng. Agric. 19(3): 259-272.
Wilkerson, J.B., J.S. Kirby, W.E. Hart, and A.R. Womac. 1994.
Real-time cotton flow sensor, ASAE Paper No. 941054.
ASABE, St. Joseph, MI.
Wilkerson, J.B., F.H. Moody, and W.E. Hart. 2002.
Imple-mentation and field evaluation of a cotton yield monitor.
Appl. Eng. Agric. 18(2): 153-159.
Whitelock, D. P. and S. J. Thomson. 1998. Estimating lint
cleaner waste flow-rate. p. 1071-1075. In Proc. Beltwide
Cotton Conf., San Diego, CA. 5-9 Jan. 1998 Natl. Cotton Counc. Am., Memphis, TN.
Wolak, F. J., A. Khalilian, R. B. Dodd, Y. J. Han, M. Keshlkin, R. M. Lippert, and W. Hair. 1999. Cotton yield monitor evaluation, South Carolina-Year 2. p. 361-364. In Proc.
Beltwide Cotton Conf., Orlando, FL. 3-7 Jan. 1999. Natl.