R E S E A R C H A R T I C L E
Open Access
Reconstructing the ups and downs of primate
brain evolution: implications for adaptive
hypotheses and
Homo floresiensis
Stephen H Montgomery
1, Isabella Capellini
2, Robert A Barton
2, Nicholas I Mundy
1*Abstract
Background:Brain size is a key adaptive trait. It is often assumed that increasing brain size was a general evolutionary trend in primates, yet recent fossil discoveries have documented brain size decreases in some lineages, raising the question of how general a trend there was for brains to increase in mass over evolutionary time. We present the first systematic phylogenetic analysis designed to answer this question.
Results:We performed ancestral state reconstructions of three traits (absolute brain mass, absolute body mass, relative brain mass) using 37 extant and 23 extinct primate species and three approaches to ancestral state reconstruction: parsimony, maximum likelihood and Bayesian Markov-chain Monte Carlo. Both absolute and relative brain mass generally increased over evolutionary time, but body mass did not. Nevertheless both absolute and relative brain mass decreased along several branches. Applying these results to the contentious case ofHomo floresiensis, we find a number of scenarios under which the proposed evolution ofHomo floresiensis’small brain appears to be consistent with patterns observed along other lineages, dependent on body mass and phylogenetic position.
Conclusions:Our results confirm that brain expansion began early in primate evolution and show that increases occurred in all major clades. Only in terms of an increase in absolute mass does the human lineage appear particularly striking, with both the rate of proportional change in mass and relative brain size having episodes of greater expansion elsewhere on the primate phylogeny. However, decreases in brain mass also occurred along branches in all major clades, and we conclude that, while selection has acted to enlarge primate brains, in some lineages this trend has been reversed. Further analyses of the phylogenetic position ofHomo floresiensisand better body mass estimates are required to confirm the plausibility of the evolution of its small brain mass. We find that for our dataset the Bayesian analysis for ancestral state reconstruction is least affected by inclusion of fossil data suggesting that this approach might be preferable for future studies on other taxa with a poor fossil record.
Background
Phylogenetic comparative methods and ancestral state reconstruction play important roles in evolutionary biol-ogy. They enable historical evolutionary processes, and the function and evolution of specific traits, to be inferred from patterns of diversity in extant species [1-3]. Extant primate brains, which vary from 1.8 g (Microcebus murinus) to 1330 g (Homo sapiens), fall within the range of non-primate mammalian brain masses [4]. However, after correcting for allometric
scaling with body mass, primates have relatively large brains compared to most other mammals [5]. A trend towards brain expansion is assumed to have occurred throughout primate evolution [6] and this has been interpreted as an indication of directional selection on cognitive abilities, due, for example, to arms races in social cognition [7,8].
Recent studies, however, indicate that brain size, mea-sured either in volume or mass, may have decreased in some vertebrate lineages [9,10]. Decreases in both abso-lute and relative brain size appear to have occurred in a number of taxa including birds [11], bats [10], bovids [12], elephants [13] and hippopotami [14,15]. Dwarfism * Correspondence: [email protected]
1Department of Zoology, University of Cambridge, Downing Street,
Cambridge, UK
following island isolation (the island rule) can account for some of these decreases [15,16] but not all. For at least some of these cases it is likely that a reduction in brain size has occurred to meet the demands of the spe-cies’changing ecological needs rather than being due to geographical isolationper se [10,11].
Although many studies have investigated the possible selective advantages and disadvantages of increased brain size in primates [5,17-21], few consider how fre-quently brain size has reduced. Periods of primate evo-lution which show decreases in brain size are of great interest as they may yield insights into the selective pressures and developmental constraints acting on brain size. Bauchot & Stephan [22] noted the evolution of reduced brain size in the dwarf Old World monkey
Miopithecus talapoin and Martin [23] suggested relative brain size in great apes may have undergone a reduction based on the cranial capacity of the extinct hominoid
Proconsul africanus. Taylor & van Schaik [24]reported a reduced cranial capacity inPongo pygmaeus morio com-pared to other Orang-utan populations and hypothesise this reduction is selected for as a result of scarcity of food. Finally, Henneberg [25] has shown that during the late Pleistocene human absolute brain size has decreased by 10%, accompanied by a parallel decrease in body size. The importance of understanding the evolution of reduced brain size in primates has recently been brought into sharp focus with the discovery of a small-brained hominin, Homo floresiensis, which overlapped both geographically and temporally with modern humans [26,27]. This has challenged our understanding of human evolution and created much debate about whetherH. floresiensiswas a distinct species or a patho-logical example of modern humans [28-30]. Studies describing the endocast and post-cranial features of the type specimen (LB1) have resulted in mixed conclusions [31-38]. Analyses using known cases of dwarfism to model brain and body size reduction in H. floresiensis
from an ancestralHomo erectus population suggested insular dwarfism cannot explain the smaller brain and body size [[39,40]; but also [15]]. However, recent stu-dies have found that both the degree and temporal rate of reduction in brain and body size observed inH. flore-siensis, assuming ancestry withH. erectus, fall within the range of size reductions in other island primate species [41,42]. An alternative phylogenetic hypothesis forH. floresiensis has recently been proposed and indicates that this species may not have evolved by insular dwarf-ism of a knownHomo species [43]. Instead Argue et al [43] propose two equally parsimonious cladograms in which H. floresiensisis a distinct early species Homo, emerged after H. rudolfensisand either before or after
H. habilis(Figure 1b &1c). The debate about the place of H. floresiensis in the primate tree and the possible
evolutionary significance of its small size and encephali-zation could be illuminated by placing the specimens in the context of a broader phylogenetic analysis.
Reconstructing ancestral brain and body sizes provides a means of testing the generality of the trend of increas-ing brain and body size through primate evolution. It also provides estimates of brain and body sizes at key points along the primate phylogeny allowing inferences to be made about the ecology of the ancestors of key clades, based on what we know about the relationship between body size, ecology and life history traits in liv-ing primates [44,45]. However, before makliv-ing any infer-ences based on estimated ancestral states it is vital to perform a thorough comparison of reconstruction meth-ods in order to obtain the most reliable estimates. Pre-vious studies have used weighted square change parsimony and maximum likelihood (ML) to reconstruct ancestral character states and infer the adaptive origins of phenotypes [46-49] and to study important genotype-phenotype associations [50]. However, basing conclu-sions on these methods may be problematic as they fail to provide reliable estimates when there are directional evolutionary changes and can also be adversely affected when ancestral states fall outside the range of extant species [51,52], as is expected to be the case for primate brain evolution [6]. Incorporating data from fossils can improve ancestral reconstruction estimates as they may more completely describe the range and temporal distri-bution of the character’s history, and thus help improve the estimated nodal values both in the presence of directional trends and when ancestral values are mark-edly different from extant species values [47,53]. More recently, a method to model directional change and find the best-fitting models of evolution prior to ancestral state reconstruction in Bayesian framework has been developed [54,55]. Whether this method performs better than parsimony and ML in estimating ancestral states and whether it is influenced by including fossil data like other methods has yet to be examined using real datasets.
necessary in order to interpret the nature of evolution-ary changes in relative brain size. We therefore investi-gated the evolutionary history of both relative and absolute brain size.
First, we adopted three approaches to reconstructing the evolutionary history of these traits: weighted squared-change parsimony, maximum likelihood (ML) and Bayesian Markov-chain Monte Carlo (MCMC) [54,55,62,63] (see Methods), and performed each analy-sis with and without inclusion of fossil data. Following previous studies showing that ancestral state reconstruc-tion is improved by including fossil data particularly when traits evolved under a directional trend [47,53], we assessed the sensitivity of each method to the inclusion of fossil data, and also compared estimates across
pattern of change in brain and body size through the tree under the most supported model.
We discuss the implications of our results for hypoth-eses on the adaptive origins of modern primates, and identify branches along which brain mass has increased greatly or at a high rate, or along which brain mass has decreased in either absolute or relative terms. Finally we use our results to evaluate alternative scenarios about the origin ofH. floresiensis, specifically from three differ-ent populations ofH. erectus and from H. habilis. This analysis aims to evaluate whether descent ofH. floresien-sis from a putative ancestral population involves a decrease in brain and body mass that is beyond those observed in other primate lineages. Our analyses show that ancestral state reconstruction can be an informative way to infer evolutionary processes using data from liv-ing species, but highlight the need to assess the reliabil-ity of these estimates when doing so.
Results and discussion
Ancestral reconstructions: congruence between estimates with and without fossil data
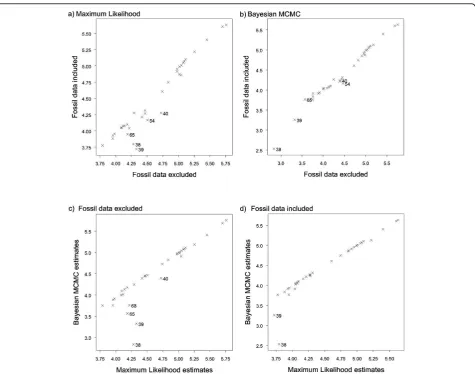
Previous studies have used either volume or mass as a measure of brain size. Here we used log10-transformed brain and body mass in all analyses. Brain and body mass estimates were collected for 37 extant and 23 extinct primate species (Additional file 1, Table S1). We first performed the reconstruction analysis using three alternative approaches (parsimony, ML and Bayesian MCMC in BayesTraits). Following Webster & Purvis [64], we then assessed the reliability of the estimates, by comparing results obtained with and without fossil data using correlations. In comparing results, estimates of ancestral states for each node obtained in the Bayesian framework were taken as the average of the posterior distribution. The phylogenies that we used are shown in Figure 1 (extant and extinct species) and Figure 2 (extant species).
Ancestral values for all nodes of the tree with and with-out the inclusion of fossil data were highly correlated for absolute brain mass (parsimony, Spearman’s correla-tion coefficient (rs) = 0.932; ML, rs = 0.932; Bayesian MCMC, rs= 0.993, allP < 0.001) and body mass (parsi-mony,rs= 0.939; ML, rs= 0.941; Bayesian MCMC, rs= 0.960, all P < 0.001). As expected, ML and parsimony methods produce almost identical results for estimates made with (rs= 1.000,P< 0.001) and without fossils (rs = 1.000, P < 0.001). We therefore only present the results of further comparisons between ML and Baye-sian MCMC. The lowerrsvalues in the parsimony and ML analyses are caused by increased disparity between the estimates at deeper nodes. In particular, estimates of log(brain mass) using fossils are 10-15% lower for the root (Figure 2, node 38), the ancestral haplorhine (39),
the ancestral anthropoid (40) and the ancestral New World monkey (54) than estimates made without inclu-sion of the fossil data (Figure 3a), suggesting the accu-racy of the estimates decreases at the deeper nodes when fossil data are not used. The standard errors in ML analysis support this conclusion, being larger for deeper nodes. Conversely, the results of the Bayesian MCMC analysis do not show this disparity and deep nodes fall on the same line as shallower nodes (Figure 3a &3b) although confidence intervals of the root esti-mate are still higher than those of all other nodes (Addi-tional file 1, Table S3).
The results from the Bayesian analyses agree more strongly with ML when fossil data are included than when they are excluded for both brain mass (with fos-sils:rs= 0.995,P < 0.001; without fossils:rs= 0.923, P< 0.001; Figure 3c and 3d) and body mass (rs= 0.981,P< 0.001 with fossils; rs = 0.926,P < 0.001 without fossils). The greatest disparity between estimates made without fossils between parsimony/likelihood analysis and Baye-sian MCMC analysis are found at the root (node 38), the ancestral haplorhine (39), the ancestral anthropoid (40), the ancestral strepsirhine (65) and the ancestral lemur (68). When fossil data are included disparity between the MCMC & ML remain for nodes 38 and 39, with the estimates from the Bayesian analysis being lower than those made by the other methods.
for brain and body mass should they evolve under dif-ferent models. These two approaches, however, pro-duced very similar relative brain size values, as the residuals at each node returned by the two methods were highly correlated (rs = 0.979, P < 0.001) and we therefore present only the results of theresiduals second
method.
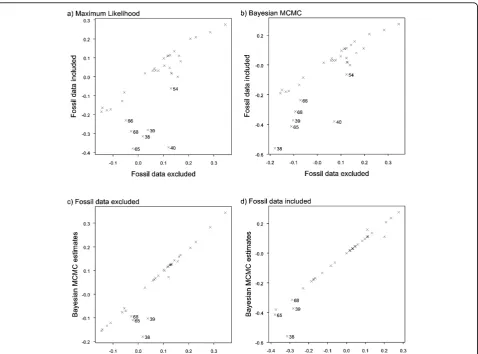
The level of congruence between ancestral state esti-mates made with and without fossil data was much lower for relative brain mass than for absolute brain
(for both analyses: rs= 1.000, P < 0.001). The results from Bayesian MCMC analysis were again more similar to those estimated by the two other methods when fossil data were included (rs= 0.994 with fossils, rs= 0.968 without; Figure 4c and 4d).
It is interesting to note that for all three approaches the estimated brain mass of the last common ancestor of humans and chimpanzees is larger when fossil data are not included. For example, the average estimate of brain mass for the Homo-Pan ancestor using MCMC analysis was 569.4 g (95% CI: 567.7 - 572.2 g) without fossils, while when fossils were included the average estimate was 425.6 g (95% CI: 424.2 to 426.8 g). This suggests the mass of the human brain can exert a large influence over ancestral state reconstructions in the great ape clade.
To summarise, parsimony and ML produced ances-tral state estimates that were more discrepant between
analyses with and without fossils when compared to estimates obtained with Organ et al.’s [55] method in a Bayesian framework. Moreover, the estimates of the Bayesian analysis were more consistent with those pro-duced by ML and parsimony when fossil data were included. These results thus suggest that Organet al.’s [55] method is more robust and therefore preferable for reconstructing ancestral states with our dataset. Although we cannot say whether this approach will generally perform most reliably when reconstructing ancestral states in taxa where little or no fossil data are available, our results suggest that this might be the case. It would thus be interesting to test whether Organ et al.’s [55] method for reconstructing ancestral states does perform better than parsimony and ML in the absence of fossil data using simulations and data-sets where the ancestral states are known [for example, [51]].
One possible reason for lower consistency in estimates with and without fossils, particularly for ML and parsi-mony, might be the presence of directional trends [51,64]. Although this problem can in part be mitigated by incor-porating fossil data that provide temporal information and variation not observed among living species and improve the accuracy of ancestral state reconstructions with these two methods [47,53], neither parsimony nor ML can expli-citly model directional trends, unlike analyses in Bayesian framework. Thus, we next addressed this issue and tested whether body size, brain size and encephalization evolved under directional trends in primates.
Evolutionary trends in body and brain mass evolution We tested for evolutionary trends by comparing a direc-tional random-walk model to the non-direcdirec-tional ran-dom-walk model in BayesTraits. The implementation of the directional model requires variation in root-to-tip branch length [3,55,65] which in our otherwise ultra-metric tree is provided by the inclusion of fossil data. To explicitly test for directionality in encephalization
rather than simply inferring this from the evolutionary histories of brain and body mass, we used the residuals of brain size on body size of the species (computed as explained above with the residuals first approach) as species data of relative brain size in this analysis. The
residuals secondapproach, in fact, could not be used in this context since it is based on residuals computed at internal nodes of the phylogeny.
To assess how the presence of a directional trend affects the accuracy of estimates made with a non-direc-tional model we performed correlations between the results obtained from the directional and non-direc-tional models. Correlations between the estimates made for absolute brain mass under the directional and non-directional models suggest no nodes are estimated less accurately than others under the non-directional con-stant-variance model (rs = 0.995,P < 0.001). However, the directional model tends to give lower estimates for all nodes (Additional file 1, Figure S1 a). For relative brain mass the rs between estimates under directional vs. non-directional model is lower (rs = 0.943, P < 0.001) and, while nodes are generally estimated as hav-ing lower values under the directional model (Additional file 1, Figure S1 b), the ancestral state reconstructions for the deepest nodestend to differ more drastically.
Taken together our results suggest that the ancestral state reconstruction procedure implemented in Bayesian framework following Organet al. [55] might be more reliable in comparison to parsimony and ML methods, as it first identifies the best predictive model based on known data, and then uses such model to infer unknown ancestral states. In addition it can explicitly model directionality, and therefore we could identify a directional trend to increase in both absolute and rela-tive brain mass - but not body mass - in primates. For
the purposes of this paper, we conclude that the most reliable estimates are thus obtained with Bayesian ana-lyses, under a non-directional random walk model for body mass and directional random walk for absolute brain mass (Additional file 1, Table S3). For a discussion of the rate parameters used in the final analyses see the Supplementary information and Additional file 1, Table S2.
Having obtained the most reliable estimates of ances-tral states at each node in the tree for each phenotype it is then possible to use these to make evolutionary infer-ences. For example our most supported estimate of the body mass at the root of the primate tree using Bayesian analysis is largely consistent with some previous qualita-tive estimates. Martin [23] suggested the ancestral pri-mate probably weighed less than 500 g, while Fleagle [45] used early primate fossils to conclude that the ancestral primate was probably as small as 20 g. This is similar to our estimated body mass at the root of the phylogeny obtained with the inclusion of fossil species (48.98 g, 95% CI: 48.97 g to 50.00 g; Figure 6). The esti-mate made without the fossils is similarly low (37.71 g, CI: 37.60 g to 37.76 g). Importantly, our estimate of body mass at the root lies within the range of the pro-posed extinct sister-group to modern primates, the ple-siadapiforms, which ranged from 7 g (the
Micromomyidae family) to 3,000 g (theCarpolestidae
Figure 5Posterior distributions of log-likelihoods for the non-directional and directional models. Figurea)shows body mass;b)brain mass;c)relative brain size. The log-likelihood of the directional model is shown in red, the non-directional model in blue. The posterior distributions of ancestral state estimates were obtained using uniform priors, two million iterations and a sampling interval of 100 (see Methods). The harmonic means and Bayes Factors of the posterior distributions are given in Table 1.
Table 1 Tests for evolutionary trends1.
Phenotype Harmonic mean Log(Lh): Constant-variance model Harmonic mean Log(Lh): Directional model Bayes Factor
Absolute body size -44.688 -45.275 -1.174
Absolute brain size -30.282 -27.087 6.390
Relative brain size 1.647 8.576 13.857
1
family), and is consistent with the estimated body masses of two putative early modern primates Altanius
(10 g) andAltiatlasius(50 to 100 g) [45,69]. In contrast, a much higher estimate of ancestral primate body mass [1,171 g (95% CIs: 236 to 3,610 g)] was recently obtained using a parsimony method and extant species data only [46]. However, our results show that in the absence of fossil data parsimony leads to overestimates of body size, thus questioning this conclusion.
Body mass variation is associated with a number of behavioural, ecological and life history traits [44,45,70-75] which are frequently used to infer charac-teristics of extinct species. Small body mass in extant primates (less than 500 g) is usually associated with noc-turnality, an insectivorous trophic niche [76] and leaping mode of locomotion for species weighing less than 3,000 g [45]. The probable small body mass of the ancestral primate has been interpreted as evidence that it occu-pied a fine-branch niche and was adapted for grasping small insect prey [23,77]. On the basis of correlates of body mass and ecological and life history traits of living primates [44,45], our estimated mass at the root would suggest the ancestral primate was a leaping insectivore, which might have had a lifespan of four to six years. This proposed ecology suggests that visual specialisation to meet the demands of a fine-branch, insect grasping niche may have had a significant role in the early expan-sion of the primate brain [18,23], a hypothesis consistent with recent evidence revealing an association between visual expansion and brain size in fossil endocasts of early primates [78].
Our reconstructions suggest the ancestral primate had a small brain (120.23 mg, 95% CI: 114.42 mg to 126.33
mg) which, in relative terms, was much smaller than in any living primate. This result is consistent with a study of a virtual endocast ofIgnacius graybullianus, an Early Eocene Plesiadapiform (Paromomyidae), indicating that early euprimates exhibited only small advances in brain mass over ancestral groups and that the majority of increases in brain size occurred after the origin of mod-ern primates [78]. Finally we note that our best estimate of brain mass for the last common ancestor of Homo
andPan (338.75 mg, 95% CI: 321.37 mg to 340.64 mg; which equates to a cranial capacity of 355.16 cm3, 95% CI: 336.61 cm3to 357.17 cm3) is similar to estimates for the two earliest hominids known from the fossil record, the 7.7 million year oldSahelanthropus tchadensis(360 to 370 cm3;) [79] and the 4.4 million year old Ardipithe-cus ramidus(280 to 350 cm3) [80]. These two fossil spe-cies were not included in our analysis due to uncertainty in their phylogenetic position which has only recently been resolved [80].
Increases in brain mass in particular lineages
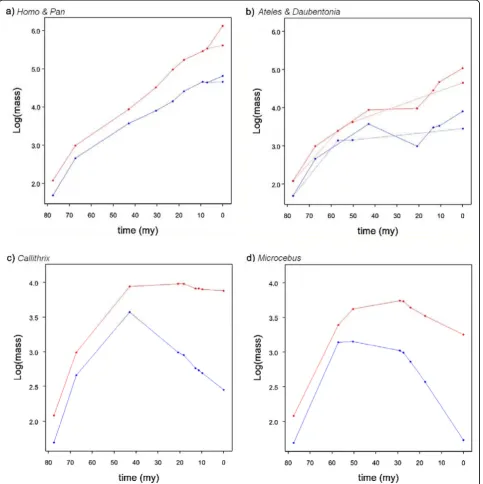
We next examined the amount of change along different branches of the tree, both as total change along the branches and as rate of change accounting for differ-ences in branch lengths (see below). We first calculated the means of the posterior distribution of the ancestral states for each node, using the same posterior predictive model developed for brain and body mass, and we com-puted the change in absolute brain and body mass, and relative brain mass (using theresiduals secondapproach described above) along each branch by comparing the values (either observed (Additional file 1, Table S1) or estimated (Additional file 1, Table S3)) at consecutive nodes. Our estimates show that both absolute and
relative brain size have increased independently in all major clades of primates (examples shown in Figure 7a and 7b).
Changes in absolute brain mass along each branch of the phylogeny can be considered in two ways: a propor-tional increase (as % of increase relative to the ancestor) and an absolute increase in mass (described above). The average proportional change in absolute brain mass
along a branch is 0.243 (i.e. a 24.3% increase), with changes greater than 0.344 being in the upper quartile, which includes branches from all the major clades of the phylogeny. Notably, three of the top four propor-tional increases are along the deepest branches (ances-tral primate to ances(ances-tral strepsirrhine (node 38-node 65; see Figure 2), 1.310; ancestral primate to ancestral hap-lorhine (38 to 39), 0.942; ancestral haphap-lorhine to
Figure 7Evolutionary trajectories of brain and body mass. Evolution of brain (red) and body (blue) mass from the ancestral primate toa)
ancestral anthropoid (39 to 40), 0.929), suggesting selec-tive pressures favouring the expansion of the brain were strong early in primate evolution. Interestingly the pro-portional increase along the terminal human branch is only the seventh largest change (0.594). However in terms of absolute change the terminal human branch shows the largest change, almost four times greater than the second biggest change (the terminalPongobranch).
The average proportional change in relative brain mass is 0.201 (that is, 20.1% increase), with changes above 0.278 falling in the upper quartile, which again includes branches from all major primate groups. The five branches which show the largest increase in relative brain mass are the terminalTarsiusbranch (0.917), the terminal Daubentonia branch (0.837), the terminal
Galago branch (0.514), the terminal human branch (0.479) and the branch between the last common ances-tor of Catarrhines and PlatyrrhinesSimiformes and the ancestral Platyrrhine (40 to 54: 0.431). Because Dauben-tonia andTarsius are no more gregarious than their close relatives [81], this suggests that social complexity is unlikely to have been the sole factor in primate brain mass evolution [c.f [7]] and that other selective pres-sures have also been important. For example the large brain ofDaubentonia is partly due to olfactory speciali-sation [82,83] which is consistent with selection acting on sensory systems having had a significant role in brain size evolution [84]. The finding that the human branch only comes fourth by this measure is perhaps surprising, but we note that of these five branches the terminal human branch is the shortest.
We next examined evolutionary changes along branches controlling for branch length (change relative to time). The average rates were an increase of 0.025/ million years (that is, a 2.5% increase/million years) for a proportional change in brain mass, 5,640 mg/million years for an absolute change in brain mass, and 0.020/ million years for a change in relative brain mass con-firming that most change in relative brain mass was due to brain rather than body mass. The branch with the highest rate of change in absolute brain mass is the terminal human branch (140,000 mg/million years). However for rate of proportional change in absolute brain mass the human branch comes only fourth, below the branches between the last common ancestor of Macaques and other Papionini, and the last common ancestor of baboons, mangabeys and mandrills (48 to 49), the ancestral primate and ancestral haplorhine (38 to 39) and the branch between the last common ances-tor of Cebinae, Aotinae and Callitrichidae, and the ancestralCebinae(58 to 60). The rate of change in rela-tive brain mass along the human branch (0.068/million years) is also exceeded by the branch between the last common ancestor of Alouatta, Ateles and Lagothrix
with the last common ancestor of AtelesandLagothrix
(branch 55 to 56; 0.73), the branch connecting the last common ancestor of Cebinae, Aotinaeand Callitrichi-dae, and the ancestralCebinae (branch 58 to 60; 0.074/ million years) and the branch connecting the last com-mon ancestor of the Papionini with the last common ancestor of Papio, Mandrillusand Cercocebus(branch 48 to 49; 0.084). We therefore conclude that only in terms of absolute mass and the rate of change in abso-lute mass has the increase in brain size been exceptional along the terminal branch leading to humans. Once scaling effects with body mass have been accounted for the rate of increase in relative brain mass remains high but is not exceptional.
It is also notable that the estimated brain size of the last common ancestor of modern primates is smaller relative to body size than any living species and that the expansion of the primate brain began early, with the deepest branches (for example, 38 to 39; 38 to 65; 39 to 40) ranking in the upper quartile in terms of both increases in absolute and relative brain mass (Additional file 1, Table S4).
Decreases in brain mass and evolutionary scenarios forH.
floresiensis
Despite both absolute and relative brain mass showing strong and significant evolutionary trends to increase, we find several branches go against this trend (examples shown in Figure 7c and 7d; Additional file 1, Table S4). Absolute brain mass decreases on approximately 14% of branches (10/70); independent decreases are observed in Old World monkeys (the terminalCercocebus branch); in New World monkeys - several branches in the calli-trichids, supporting the conclusion that this family has evolved by a process of phyletic dwarfism [85]; and in strepsirhines - several branches in the lemur clade. Branches on which there is an overall decrease in abso-lute brain mass account for approximately 6% of the total evolutionary time covered by the phylogeny used in this analysis. In all cases a decrease in absolute brain mass is accompanied by a decrease in absolute body mass. Body mass decreases much more frequently: 46% of branches show a decrease, accounting for 47% of the total evolutionary time covered. Decreases in relative brain mass occur less frequently, with only 4% (3/70) of branches showing a decrease in relative brain mass, representing only 2.1% of evolutionary time. Decreases in relative brain mass mostly appear to be linked to body mass increasing to a greater extent than brain mass. This, for example, provides some support for the hypothesis that small relative brain size in gorillas reflects increased somatisation rather than decreased encephalization [[86]; but see [87]].
brain mass which have occurred elsewhere in the pri-mate phylogeny, we calculated the ratio change in brain and body mass [(brain descendant - brain ancestor)/ (body descendant-body ancestor)] for branches showing a decrease, in order to facilitate comparisons with the literature (see methods). We used log values to take var-iation in body mass into account; decreases here are therefore proportional decreases in absolute mass. Our aim in this analysis is not to estimate the probability or likelihood of the evolution of a hominin with reduced brain and body mass but rather to test whether or not decreases seen during the evolution ofHomo floresiensis
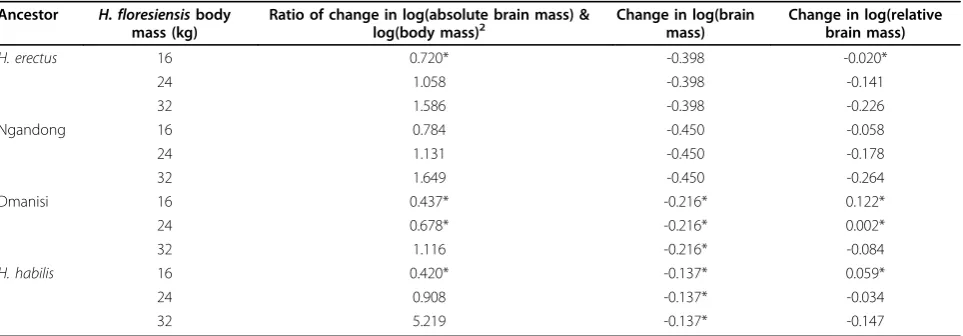
fall within the range of other observed decreases in Pri-mates. First we consider the evolution of the H. flore-siensisbrain assuming descent from a known hominin by insular dwarfism, a widely cited hypothesis [15,16,39,40]. For the 10 branches which showed a decrease the average ratio was 0.265 and the range was 0.006 to 0.825. We calculated the same ratio usingH. floresiensis (estimated brain mass c. 380 g [26,31]) and three possible ancestral forms of Homo erectus, follow-ing Martinet al. [39]: Homo erectus broadly defined, NgandongH. erectus, and Dmanisi hominins. We also includeHomo habiliswhich has not been ruled out as a possible ancestor [36]. The change in brain size and the ratio of the change in brain and body mass were calcu-lated for the two extreme values of body mass estimated for H. floresiensis (16 and 32 kg) [26] and their mid-point. In addition we used the brain/body mass scaling relationships [(brain descendant - brain ancestor)/(body descendant-body ancestor)] during the 10 decreases in brain mass to estimate the decrease in brain mass expected for the observed decrease in body mass for each ancestor and body mass. The results of this analy-sis are shown in Additional file 1, Table S5 and invoke similar conclusions to those discussed below.
Under a number of scenarios the evolution ofH. flore-siensis lies within the range of decreases in brain mass estimated here (Table 2). For any ancestor, except Ngandong hominoids, and aH. floresiensisbody mass of 16 kg the decreases in brain and body mass always fall within the range of the decrease that we found in other primate branches. For aH. floresiensisbody mass of 32 kg the decrease in relative brain mass is not consistent with changes estimated in other branches, but assuming a body mass estimate of 24 kg and descent from a Dma-nisi hominin population, the decrease in relative brain size falls within the range of decreases observed else-where in the primate phylogeny. We also note that for both body mass estimates the proportional change in absolute brain mass from either a Dmanisi hominin (-0.216) orH. habilis(-0.137)ancestor is actually smaller than the decrease in the terminal Microcebus branch (-0.273). Finally the calculated change in relative brain mass from any of the four ancestors is compatible with the results obtained here only for a H. floresiensisbody mass close to 16 kg, or descent from either a Dmanisi hominin orH. habilisifH. floresiensis had a body mass towards 24 kg.
Thus under the insular dwarfism model, if H. flore-siensisdescended from either an ‘average’H. erectus or Ngandong populations, the decrease in brain mass is not compatible with our results unless H. floresiensis
had a body mass near 16 kg. The evolution of H. flore-siensis also appears less likely if it had a body mass towards the upper estimate, as the decrease in relative brain mass falls outside our estimates on other branches. However, ifH. floresiensishad a body mass of 16 to 24 kg, descent from either a Dmanisi hominin or
H. habilisancestor is in line with decreases in brain and body mass along other primate lineages. We therefore conclude that further studies addressing the affinities of
Table 2 Evolution of brain size during the evolution ofH. floresiensisfrom four possible ancestors by insular dwarfism.
Ancestor H. floresiensisbody mass (kg)
Ratio of change in log(absolute brain mass) &
log(body mass)2 Change in log(brainmass) Change in log(relativebrain mass)
H. erectus 16 0.720* -0.398 -0.020*
24 1.058 -0.398 -0.141
32 1.586 -0.398 -0.226
Ngandong 16 0.784 -0.450 -0.058
24 1.131 -0.450 -0.178
32 1.649 -0.450 -0.264
Dmanisi 16 0.437* -0.216* 0.122*
24 0.678* -0.216* 0.002*
32 1.116 -0.216* -0.084
H. habilis 16 0.420* -0.137* 0.059*
24 0.908 -0.137* -0.034
32 5.219 -0.137* -0.147
1
computed as: [(brain descendant - brain ancestor)/(body descendant-body ancestor)]
H. floresiensiswith different possible ancestors and more accurate predictions of body mass are necessary to rule out the possibility of H. floresiensisbeing a true novel hominin using this kind of analysis. Our analysis sug-gests it is possible that, under the insular dwarfism model, the only unexpected aspect of H. floresiensis’
evolution is the rate at which brain mass decreased, however some evidence suggests morphological evolu-tion may accelerate on islands [88].
Next we performed several analyses to test whether the evolution of theH. floresiensisbrain under the alter-native phylogenetic scenario proposed by Argue et al. [43] by estimating the ancestral brain and body masses of the node at the base of the H. floresiensis lineage (Additional file 1, Table S6) and subsequently analysing the evolution of brain size along that lineage. The analy-sis was run for each of the two most parsimonious trees separately and then for both trees together, taking advantage of BayesTraits ability to take phylogenetic uncertainty into account. The results again suggest that ifH. floresiensis body mass did not greatly exceed 24 kg the decrease in brain size observed along the lineage leading toH. floresiensisfalls within the range seen else-where in the primate phylogeny, scales with body mass in a way consistent with other episodes of brain mass reductions, and actually results in an increase in relative brain size (Table 3; Additional file 1, Table S7). Conver-sely, a larger body size produces an allometric decrease in brain size beyond the range observed in the primate tree. To conclude, for a body mass toward the lower end of the range of estimates all the phylogenetic hypotheses on the ancestry ofH. floresiensis so far pro-posed are consistent with the observed decrease in brain size. An alternative method of these hypotheses based on using the model of brain evolution developed in BayesTraits is presented in the supplementary informa-tion, and produces results broadly consistent with the main analysis.
To further study the selective pressures and anatomical changes associated with decreases in brain mass we sug-gestMicrocebus,CallithrixandMiopithecusor Cercoce-busmay be useful, independent models. For example, Falket al. [31] identified a number of potentially derived features in an endocast ofH. floresiensis, and comparative analyses of the brain anatomies of these species might show whether similar structures are modified in indepen-dent episodes of brain mass reduction. Likewise a com-parative analysis of the ecologies of these smaller brained primates may reveal selective pressures associated with decreases in brain and body mass. We note that for both decreases in absolute and relative brain mass there appears to be no relation with isolation on islands, nor is there any clear single ecological trait that can explain these decreases. As with evolutionary increases in brain mass, decreases in mass are likely to be influenced by a number of ecological factors. For example, Taylor & van Schaik [24] have shown that brain size has decreased dur-ing the evolution of Pongo p. morio, particularly in females. These authors suggest this reduction is asso-ciated with an increase in periods of food scarcity result-ing in selection to minimise brain tissue which is metabolically expensive [17]. Food scarcity is also believed to have played a role in the decrease in brain size in the island bovidMyotragus[12]. Taylor & van Schaik [24] therefore propose thatH. floresiensis may have experienced similar selective pressures asMyotragus
andPongo p. morio. Future studies are needed to address the relative contributions of proposed social and ecologi-cal factors in both decreases and increases in brain mass across Primates and other species.
Conclusions
By reconstructing ancestral states of brain and body mass in primates we have shown that Organ’s et al [55] method, implemented in BayesTraits using Bayesian analysis, is least affected by the inclusion of fossil data
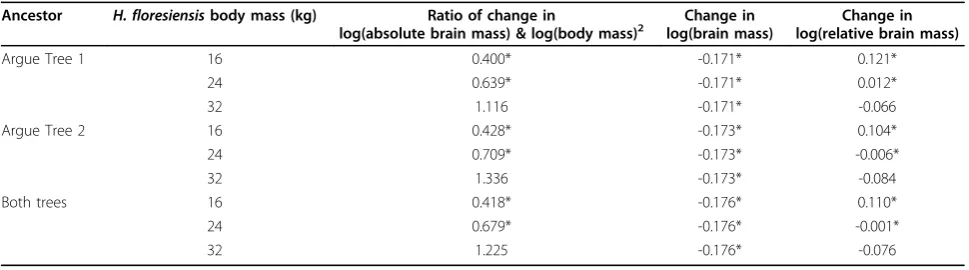
Table 3 Evolution of brain size during the evolution ofH. floresiensisunder two phylogenetic scenarios1.
Ancestor H. floresiensisbody mass (kg) Ratio of change in
log(absolute brain mass) & log(body mass)2 log(brain mass)Change in log(relative brain mass)Change in
Argue Tree 1 16 0.400* -0.171* 0.121*
24 0.639* -0.171* 0.012*
32 1.116 -0.171* -0.066
Argue Tree 2 16 0.428* -0.173* 0.104*
24 0.709* -0.173* -0.006*
32 1.336 -0.173* -0.084
Both trees 16 0.418* -0.176* 0.110*
24 0.679* -0.176* -0.001*
32 1.225 -0.176* -0.076
1
These are the two most parsimonious topologies obtained by Argueet al. [43] and are shown in Figure 1 b (tree 1) & c (tree 2)
2
computed as: [(brain descendant - brain ancestor)/(body descendant-body ancestor)]
and is therefore more reliable for our dataset. In this respect this approach outperforms parsimony and ML methods which instead tend to produce lower estimates at deep nodes when using only data of extant species. This is likely to be because BayesTraits first identifies the best predictive model based on known tip data to then infer unknown ancestral states at each node of interest in the tree and can incorporate evolutionary trends. If Organet al.’s [55] method generally outper-forms ML and parsimony methods, this may have important implications for future studies which attempt to estimate ancestral states in groups where little fossil information is available, or where evolutionary trends are suspected, especially when the reconstruction is per-formed on deep nodes within phylogenies which cover large time periods. Studies on datasets with known ancestral states are thus needed to fully assess if the method implemented in BayesTraits consistently pro-duces more reliable ancestral state reconstructions.
Our results provide robust confirmation for the sug-gestion that strong evolutionary trends have governed the expansion of the primate brain. In contrast body size evolution has not tended to increase in primates, implying brain and body mass have been subject to separate selection pressures and supporting the findings of previous studies in other taxonomic groups that these two highly correlated traits can show differences in their patterns of evolution [89,90]. In primates, brain mass has independently expanded in both absolute and rela-tive terms in all the major clades of the primate phylo-geny and began to increase early in primate evolution. We have highlighted branches along which the change or rate of change in brain mass is particularly large. Sur-prisingly only in terms of change in absolute mass is the terminal human branch exceptional; once scaling effects are accounted for, humans rank only seventh. Despite the presence of an overall trend to increase mass, we also provide evidence for independent decreases in brain mass in New and Old World Monkeys and in strepsir-hines. From our analyses of evolution ofH. floresiensis
brain size under different phylogenetic hypotheses, we conclude that the evolution ofH. floresiensisis consis-tent with our results across the primate phylogeny if it either evolved from populations ofH. habilisor Dmanisi hominin by insular dwarfism, or under Argue et al.’s [43] proposed phylogenetic scenarios, and ifH. floresien-sishad a body mass towards the lower end of the range of estimates obtained from skeletal remains. In this respect we note that Brown et al. [26] suggested the lower body mass estimates are probably most appropri-ate, assuming H. floresiensisshared the lean body shape typical of Old World tropical modern humans. If this were true we estimate the evolution of H. floresiensis
involved a reasonable decrease in absolute brain mass,
but an increase in relative brain size. Our analysis, together with studies of brain size in island populations of living primates[41,42], therefore suggests we should perhaps not be surprised by the evolution of a small brained, small bodied hominin, although further clarifi-cation of the relationships between H. floresiensis and other hominins are required to confirm this observation. Finally, our analyses add to the growing number of stu-dies that conclude that the evolution of the human brain size has not been anomalous when compared to general primate brain evolution [59,61,91,62-94].
Methods
Brain and body mass data
Data for body and brain mass were obtained from pre-viously published datasets [22,82,95]. For reconstruc-tions of ancestral brain and body mass, we used data from as many extant genera as possible, leading to a dataset of 37 primate genera including 14 catarrhines, 12 platyrrhines, 1 tarsier and 10 strepsirhines (Addi-tional file 1, Table S1a).
Through a literature search we obtained data for fos-sils where cranial remains were sufficiently intact to make reliable estimates of cranial capacity (N = 23, Additional file 1, Table S1b). We converted cranial capacity to brain mass using the equation given in Mar-tin [23]: Log(cranial capacity) = [1.018 × Log(brain mass)] - 0.025. Where body and brain mass estimates were not available from the same individual we took the body mass estimate for the species given in Fleagle [45]. The dataset includes seven extinct hominins, which we use to examine whether ancestral values were overly influenced by the large disparity between the brain mass ofHomo sapiensand the other apes.
signal); kappa, which stretches and compresses branch lengths; and delta, which scales path lengths. As these parameters can improve the fit to the data, we first esti-mated all parameters at once following Organet al. [55] and, where a parameter was significantly different from the default value of 1, indicating gradualism, it was then estimated in the final regression analysis. However, while lambda can be estimated alone, kappa and delta are better estimated as additional parameters in the model that also included lambda. The regression was highly significant (t59 = 14.53, R2= 0.858,P< 0.001), the branch-length scaling parameters lambda and delta were not significantly differ-ent from the default value of one (lambda: lambda = 0.979, LR = 2.04,P= 0.153; delta: delta = 1.091, LR = 0.03,
P= 0.857). Conversely, kappa was estimated to be 0.474, significantly different to one (LR = 8.132,P= 0.004).
Relative brain mass on body mass for each species (extant or extinct) was calculated as residual values using the regression equation (see below). These resi-duals were used to test for an evolutionary trend to increase relative brain mass and to reconstruct ancestral states (residuals first).
Phylogeny
It is important to incorporate both topology and branch length information during reconstruction analyses as species are part of a hierarchically structured phylogeny, therefore not statistically independent, and differences in time since divergence from the common ancestors determines differential potential for evolutionary change [3,47,99,100]. We used a genus level composite phylo-geny of primates using published trees. The topology is taken from Goodman et al. [101] for haplorhine pri-mates and Horvathet al. [102] for strepsirhines. Propor-tional branch lengths were obtained from recent studies of primate divergence dates [103-106] scaled to agree with dates of divergence for the deeper primate nodes estimated by Steiper & Young [107]. The tree obtained therefore has branch length information and is ultra-metric. There are two trichotomies: one between the
Cebidae, PitheciidaeandAtelidae, the other at the base ofCebidae(Figure 2). As the topology of our composite phylogeny is well studied and the branch lengths are based on the best available divergence date estimates in all subsequent analyses it is assumed our phylogeny is known without error.
Where fossil data were included we follow Finarelli & Flynn [47] in minimising phylogenetic assumptions and placed extinct taxa as polytomies at the node nearest to their estimated position in the primate phylogeny. Branch lengths for fossil species were calculated as the time from this node to the end of the geological period in which they are last found. Both phylogenetic relation-ships and temporal presence in the fossil record were taken from Fleagle [45]. Where the programs described
below require a fully bifurcating tree, trichotomies were randomly resolved and the new, intervening branch given a branch length of zero.
We also use the two most parsimonious Hominin
topologies obtained by Argue et al. [43]. Here branch lengths were determined based on the earliest and latest known fossils for each species [27,45,108,109], with divergence dates of internal nodes coming from the first appearance of any species within the lineages which evolved from that node. Where the time of origin for a lineage could not be determined in this way we mini-mise phylogenetic assumptions by placing in the node in centre of the branch. The rest of the phylogeny was identical to that presented in Figure 1[110].
Reconstruction methods
Ancestral state reconstructions of absolute brain and body mass and relative brain mass at each node of the phylogeny were estimated using three methods: weighted squared-change parsimony in the Mesquite [101], ML in the program ANCML [63], and Bayesian MCMC [97,98], in BayesTraits following Organ et al.’s [55] method, all of which incorporate phylogenetic information
Weighted squared-change parsimony infers ancestral states by minimising the square-change along branches [62,63], but parsimony approaches are not robust to vio-lations of assumptions of constant rate of evolution or equal probability of change in either direction [3,51,64,111]. Throughout the paper we refer to this method as Parsimony method.
ML reconstruction is based on a Brownian motion model to estimate transitions at any node along the phy-logeny. The advantages of this method are that the probability of change at any point in the tree is not dependent on a prior state change or on changes on other branches [2]. Like parsimony approaches however, the model assumes a constant rate of evolution and may perform poorly if the trait shows an evolutionary trend [2,51,64] (see below). Throughout the paper we refer to this method as the ML method.
lambda and delta, set as 1 [3,65]. We then simultaneously estimated the branch length scaling parameters, because these parameters can improve the fit to the data and thus help identify the best evolutionary model for the data. We tested whether the branch scaling parameters differed from the default value of one by comparing the harmonic mean of the model in which the parameters were esti-mated to the harmonic mean of the model where they were set as one, using Bayes factors. The Bayes Factor is computed as:2(log [harmonic mean(directional model) -log[harmonic mean(constant variance model)]. A positive Bayes factor greater than two is taken as positive evidence for a difference between the two models with the best fit-ting model having the highest log(harmonic mean), a Bayes factor greater than five representstrongevidence and greater than 10 isvery strongevidence [97]. Thus, the default value of one for a scaling parameter was used in the final analysis when the Bayes factor was less than two. Where they did, the rate parameters were incorporated in the estimation for the best fitting model (see supplemen-tary information). Therefore, contrary to parsimony and ML, this method has the advantage of finding the best model of trait evolution before estimating ancestral states.
Results of the Bayesian analysis obtained using 2 or 10 million runs were qualitatively similar, therefore we per-formed all analyses with two million runs. All analyses were performed using uniform priors (prior range: -100 to +100), with 2,000,000 MCMC runs after a burn-in of 500,000, sampling every 100 runs, and repeated multiple times to test the stability of the harmonic means. Rate deviation was adjusted to obtain an acceptance of the proposed model parameters (above) between 20% and 40%. Ancestral state reconstructions were then simulta-neously estimated using the best evolutionary model for the data; data deviation was adjusted to obtain an accep-tance rate for each node’s estimate between 20 to 40%.
Next we tested if a directional-change random walk model improved the fit to the data relative to the best non-directional random walk (Brownian motion) model obtained as described above. While the non-directional random walk model has one parameter - alpha, the var-iance of evolution - the directional random-walk model has an additional parameter that captures the directional change using a regression between trait values and the total path length (beta) [3,65]. Because all species have the same total path length in ultrametric trees, this ana-lysis could be done only with the tree that incorporated fossil species as the directional model requires root-to-tip (path length) variation in order to estimate direction-ality unless the scaling parameters are used. The harmo-nic mean of the likelihoods of the directional and non-directional random walk models can be compared with Bayes factors [97,98] to determine which model fits the data best (see above).
ANCML (ML analysis) provide standard errors for each nodal value reconstruction. However, some authors con-sider standard errors to be underestimated and difficult to compare across methods [52]. The vast majority of posterior distributions of estimates made by the Bayesian MCMC runs were normally distributed using a W-test, so we present the mean and 95% confidence intervals for each node. To test for the sensitivity of each method to the inclusion of fossil species, we followed Webster & Purvis [64] and checked the strength of the association between estimates at each node made with and without fossil data using correlation analysis in GenStat (VSNi, Hemel Hempstead, UK). For the Bayesian analysis we thus calculated the mean of the posterior distribution of the ancestral states at each node of the tree. Because some sets of estimates made with different methods were not normally distributed, we used Spearman’s rank corre-lation for all tests to allow correcorre-lation coefficients (rs) to be fully comparable throughout the analysis.
The change in brain and body mass along each branch was calculated by taking the difference between consecu-tive nodes. As the estimates for each node using absolute values of log brain and body mass are log values, sub-tracting consecutive node values gives a proportional change in mass. We therefore also converted log values into absolute numbers before calculating differences to get the absolute change in mass. Estimates of ancestral relative brain mass are based on residual values from a regression analysis of two log values. We therefore simply subtracted successive nodes to calculate change in rela-tive brain mass. Finally, to control for differential poten-tial in divergence due to longer time since the last splitting event we repeated the analysis and calculated the rate of change by dividing the change along a branch by the branch length, for each measure of brain mass.
Additional file 1: Supplementary tables and figures. 1. Table S1: Brain and body mass of primates used in the analyses. 2. Table S2: Posterior distribution of the scaling parameters to identify the best model before reconstructing ancestral states in Bayesian analysis. 3. Figure S1: Correlations between estimates made using directional constant variance random walk and non-directional constant variance random walk models in BayesTraits. 4. Table S3: Ancestral state estimates using most supported models. 5. Table S4: Change in absolute brain and body mass and relative brain mass along each branch. 6. Additional analyses in relation toH. floresiensis:•Table S5: Range of estimated decreases in brain mass during the evolution ofH. floresiensisgiven scaling relationships during episodes of brain mass reduction.•Table S6: Estimated Log(body) and Log(brain) masses for the node at the base of theH. floresiensisterminal branch using the topologies proposed by Argueet al. [43].•Table S7: Range of estimated decreases in brain mass during the evolution ofH. floresiensisusing the topologies proposed by Argueet al. [43] and given scaling relationships during brain mass reduction in primates.
Click here for file
Abbreviations
CI: Confidence Interval; GLS: Generalised Least Squares; MCMC: Markov-Chain Monte Carlo; ML: Maximum Likelihood.
Acknowledgements
We thank Chris Venditti for advice and help with the analysis in BayesTraits and for helpful comments on the manuscript, and Brenda Bradley, Adrian Friday, Dieter Lukas, Jeremy Niven and four anonymous reviewers for helpful comments on the manuscript. SHM & NIM thank BBSRC, the Leverhulme Trust and Murray Edwards College for financial support. IC & RAB thank BBSRC/NERC for financial support (grant number BB/E014593/1).
Author details
1Department of Zoology, University of Cambridge, Downing Street,
Cambridge, UK.2Evolutionary Anthropology Research Group, Department of
Anthropology, Durham University, Dawson Building, South Road, Durham, DH1 3LE, UK.
Authors’contributions
SHM, NIM, IC and RAB designed the study, SHM performed the study, SHM, NIM, IC and RAB wrote the manuscript.
Received: 19 March 2009
Accepted: 27 January 2010 Published: 27 January 2010
References
1. Harvey PH, Pagel MD:The Comparative Method in Evolutionary Biology Oxford University Press, Oxford 1991.
2. Cunningham CW, Omland KE, Oakley TH:Reconstructing ancestral character states: a critical reappraisal.Trends Ecol Evol1998,13:361-366. 3. Pagel M:Inferring the historical patterns of biological evolution.Nature
1999,401:877-884.
4. Roth G, Dicke U:Evolution of the brain and intelligence.Trends Cogn Sci 2005,9:250-257.
5. Barton RA:Primate brain evolution: integrating comparative,
neurophysiological and ethological data.Evolutionary Anthropology2006,
15:224-236.
6. Jerison HJ:Evolution of the Brain and IntelligenceNew York: Academic Press 1973.
7. Dunbar R, Schultz S:Evolution in the social brain.Science2007,
7:1344-1347.
8. Pérez-Barberia FJ, Shultz S, Dunbar RIM:Evidence for coevolution of sociality and relative brain size in three orders of mammals.Evolution 2007,61:2811-2821.
9. Niven JE:Brain evolution: Getting better all the time?.Curr Biol2005,15: R625-R626.
10. Safi K, Seid MA, Dechmann KN:Bigger is not always better: when brains get smaller.Biol Lett2005,1:283-286.
11. Boerner M, Krüger O:Why do parasitic cuckoos have small brains? Insights from evolutionary sequence analyses.Evolution2008,
62:3157-3169.
12. Köhler M, Moyá-Solá S:Reduction of brain and sense organs in the fossil insular bovidMyotragus.Brain Behav Evol2004,63:125-140.
13. Roth VL:Inferences from allometry and fossils: dwarfing of elephants on islands.Oxford Surveys in Evolutionary Biology1992,8:259-288.
14. Simmons AH:Faunal Extinction in an Island Society: Pygmy Hippopotamus Hunters of Cyprus.Plenum Press, New York 1999. 15. Weston EM, Lister AM:Insular dwarfism in hippos and a model for brain
size reduction in Homo floresiensis.Nature2009,459:85-88.
16. Niven JE:Brains, islands and evolution: breaking all the rules.Trends Ecol Evol2007,22:57-59.
17. Aiello LC, Wheeler P:The expensive-tissue hypothesis: the brain and the digestive system in human and primate evolution.Curr Anthropol1995,
36:199-221.
18. Barton RA:Visual specialization and brain evolution in primates.Proc Roy Soc B1998,265:1933-1937.
19. Dunbar R:The social brain hypothesis.Evol Anthrop1998,6:178-190. 20. Brown WM:Natural selection of mammalian brain components.Trends
Ecol Evol2001,16:471-473.
21. Reader SM, Laland KN:Social intelligence, innovation, and enhanced brain size in primates.Proc Natl Acad Sci USA2002,99:4436-4441.
22. Bauchot R, Stephan H:Encéphalisation et niveau evolutif chez les Simiens.Mammalia1969,33:225-275.
23. Martin RD:Primate origins and evolution.London: Chapman & Hall 1990. 24. Taylor AB, van Schaik CP:Variation in brain size and ecology in Pongo.J
Hum Evol2007,52:59-71.
25. Henneberg M:Evolution of the human brain: is bigger better?.Clin Exp Pharmacol Physiol1998,25:745-749.
26. Brown P, Sutikna T, Morwood MJ, Soejono RP, Jatmiko , Saptomo EW, Due RA:A new small-bodied hominin from the Late Pleistocene of Flores, Indonesia.Nature2004,431:1055-1061.
27. Roberts RG, Westaway KE, Zhao J, Turney CSM, Bird MI, Rink WJ, Fifield LK:
Geochronology of cave deposits at Liang Bua and of adjacent river terraces in the Wae Racang valley, western Flores, Indonesia: a synthesis of age estimates for the type locality ofHomo floresiensis.J Hum Evol 2009,57(5):484-502.
28. Jacob T, Indriati E, Soejono RP, Hsu K, Frayer DW, Eckhardt RB, Kuperavage AJ, Thorne A, Henneberg M:Pygmoid Australomelanesian
Homo sapiensskeletal remains from Liang Bua, Flores: Population affinities and pathological abnormalities.Proc Natl Acad Sci USA2006,
103:13421-13426.
29. Hershkovitz I, Kornreich L, Laron Z:Comparative skeletal features between
Homo floresiensisand patients with primary growth hormone insensitivity (Laron Syndrome).Am J Phys Anthropol2007,134:198-208. 30. Delaval B, Doxsey S:Dwarfism, where pericentrin gains stature.Science
2008,319:732-733.
31. Falk D, Hildebolt C, Smith K, Morwood MJ, Sutikna T, Brown P, Jatmiko, Wayhu Saptomo E, Brunsden B, Prior F:The brain of LB1,Homo floresiensis.Science2005,308:242-245.
32. Weber J, Czarnetzki A, Pusch CM:Comment on“The brain of LB1,Homo floresiensis”.Science2005,310:236.
33. Falk D, Hildebolt C, Smith K, Morwood MJ, Sutikna T, Jatmiko, Saptomo EW, Imhof H, Seidler H, Prior F:Brain shape in human microcephalics and
Homo floresiensis.Proc Natl Acad Sci USA2007,104:2513-1518. 34. Larson SG, Jungers WL, Tocheri MW, Orr CM, Morwood MJ, Sutikna T,
Awe RD, Djubiantono T:Descriptions of the upper limb skeleton ofHomo floresiensis.J Hum Evol57(5):555-570.
35. Tocheri MW, Orr CM, Larson SG, Sutikna T, Jatmiko , Saptomo EW, Awe RD, Djubiantono T, Morwood MJ, Jungers WL:The primitive wrist ofHomo floresiensisand its implications for Hominin evolution.Science2007,
317:1743-1745.
36. Gordon AD, Nevell L, Wood B:TheHomo floresiensiscranium (LB1): Size, scaling, and earlyHomoaffinities.Proc Natl Acad Sci USA2008,
105:4650-4655.
37. Falk D, Hildebolt C, Smith K, Morwood MJ, Sutikna T, Jatmiko, Saptomo EW, Prior F:LB1’s virtual endocast, microcephaly, and hominin brain evolution.J Hum Evol2009,57(5):597-60.
38. Jungers WL, Harcourt-Smith WEH, Wunderlich RE, Tocheri MW, Larson SG, Sutikna T, Due Awe Rhokus, Morwood MJ:The foot of Homo floresiensis. Nature2009,459:81-84.
39. Martin RD, MacLarnon AM, Phillips JL, Dussubieux L, Williams PR, Dobyns WB:Comment on“the brain of LB1Homo floresiensis“.Science 2006,312:999b.
40. Martin RD, MacLarnon AM, Phillips JL, Dussubieux L, Williams PR, Dobyns WB:Flores Hominoid: new species or microcephalic dwarf?.Anat Rec2006,288A:1123-1145.
41. Bromham L, Cardillo M:Primates follow the‘island rule’: implications for interpretingHomo floresiensis.Biol Lett2007,3:398-400.
42. Welch JJ:Testing the island rule: primates as a case study.Proc Roy Soc B 2009,276:675-682.
43. Argue D, Morwood M, Sutikna T, Jatmiko , Saptomo W:Homo floresiensis: A cladistic analysis.J Hum Evol2009,57(5):623-639.
44. Jungers WL:Body size and scaling of limb proportions in primates.Size and Scaling in Primate BiologyPlenum Press, New YorkJungers WL 1985. 45. Fleagle JG:Primate Adaptation and Evolution.New York: John Wiley &
Sons, Second 1999.
46. Soligo C, Martin RD:Adaptive origins of primates revisited.J Hum Evol 2006,50:414-430.
48. Finarelli JA, Flynn JJ:The evolution of encephalization in Caniform carnivores.Evolution2007,61:1758-1772.
49. Masters JC, Lovegrove BG, de Wit MJ:Eyes wide shut: can
hypometabolism really explain the primate colonization of Madagascar?. J Biogeogr2007,34:21-37.
50. Ali F, Meier R:Positive selection inASPMis correlated with cerebral cortex evolution across primates but not with whole-brain size.Mol Biol Evol2008,25:2247-2250.
51. Oakley TH, Cunningham CW:Independent contrasts succeed where ancestor reconstruction fails in a known bacteriophage phylogeny. Evolution2000,54:397-405.
52. Garland T, Bennet AF, Rezende EL:Phylogenetic approaches in comparative physiology.J Exp Biol2005,208:3015-3035.
53. Polly PD:Paleontology and the comparative method: Ancestral node reconstructions versus observed node values.Am Nat2001,157:596-609. 54. Pagel M, Meade A, Barker D:Bayesian estimation of ancestral character
states on phylogenies.Systematic Biology2004,53:673-684.
55. Organ CL, Shedlock SM, Meade A, Pagel M, Edwards SV:Origin of avian genome size and structure in non-avian dinosaurs.Nature2007,
446:180-184.
56. Healy SD, Rowe C:A critique of comparative studies of brain size.Proc R Soc B2007,274:453-464.
57. MacLean E, Barrickman NL, Johnson EM, Wall CE:Sociality, ecology and relative brain size in lemurs.J Hum Evol2009,56(5):471-478. 58. Striedter GF:Principles of brain evolution.Sunderland, MA: Sinauer
Associates 2005.
59. Marino L:Absolute brain size: did we throw the baby out with the bathwater.Proc Natl Acad Sci USA2006,103:13563-13564.
60. Deaner RO, Isler K, Burkart J, van Schaik C:Overall brain size, and not encephalization quotient, best predicts cognitive ability across non-human primates.Brain Behav Evol2007,70:115-124.
61. Herculano-Houzel S, Collins CE, Wong P, Kaas JH:Cellular scaling rules for primate brains.Proc Natl Acad Sci USA2007,204:3562-3567.
62. Maddison WP:Squared-change parsimony reconstructions of ancestral states for continuous-valued characters on a phylogenetic tree. Systematic Zoology1991,40:304-314.
63. Schluter D, Price T, Mooers AO, Ludwig D:Likelihood of ancestor states in adaptive radiation.Evolution1997,51:1699-1711.
64. Webster AJ, Purvis A:Testing the accuracy of methods for reconstructing ancestral states of continuous characters.Proc Roy Soc B2002,
269:143-149.
65. Pagel M:Inferring evolutionary processes from phylogenies.Zool Scripta 1997,26:331-348.
66. Soligo C:Correlates of body mass evolution in primates.Am J Phys Anthropol2006,130:283-293.
67. Alroy J:Cope’s Rule and the dynamics of body mass evolution in North American fossil mammals.Science1998,280:731-734.
68. Polly PD:Cope’s Rule.Science1998,282:50-51.
69. Bloch JI, Silcox MT, Boyer DM, Sargis EJ:New paleocene skeletons and the relationship of plesiadapiforms to crown-clade primates.Proc Natl Acad Sci USA2007,104:1159-1164.
70. Barton RA:Allometry of food intake in free-ranging anthropoid primates. Folia Primatol1992,58:56-59.
71. Peters RH:The ecological implications of body size.Cambridge University Press, Cambridge 1983.
72. Schmidt-Nielsen K:Scaling: why is animal size so important?.Cambridge University Press, Cambridge 1984.
73. Charnov E, Berrigan D:Why do primates have such long lifespans and so few babies.Evol Anthrop1993,1:191-194.
74. Ross C:Primate life histories.Evol Anthropol1997,6:54-63.
75. Dial KP, Greene E, Irschick DJ:Allometry of behavior.Trends Ecol Evol2008,
23:394-401.
76. Kay RF:On the use of anatomical features to infer foraging behaviour in extinct primates.Adaptations for foraging in nonhuman primatesColumbia University Press, New YorkRodman PS, Cant JGH 1984, 21-53.
77. Cartmill M:Arboreal adaptations and the origin of the order Primates. The functional and evolutionary biology of PrimatesAldine-Athertone, ChicagoTuttle R 1872, 97-122.
78. Silcox MT, Dalmyn CK, Bloch JI:Virtual endocast ofIgnacius graybullianus
(Paromomyidae, Primates) and brain evolution in early primates.Proc Natl Acad Sci USA2009,106(27):10987-10992.
79. Zollikofer CPE, Ponce de León MS, Lieberman DE, Guy F, Pilbeam D, Likius A, Mackaye HT, Vignaud P, Brunet M:Virtual cranial reconstruction ofSahelanthropus tchadensis.Science2005,434:755-759.
80. Suwa G, Asfaw B, Kono RT, Kubo D, Loverjoy CO, White TD:The
Ardipithecus ramidusskull and its implications for Hominid origins. Science2009,326:68e1-68e7.
81. Smuts BB, Cheney DL, Seyfarth RM, Wrangham RW, Struhsaker TT:Primate Societies.University of Chicago Press 1987.
82. Stephan H, Frahm H, Baron R:New and revised data on volume of brain structures in insectivores and primates.Folia Primatol1981,35:1-29. 83. Kaufman JA, Ahrens ET, Laidlaw DH, Zhang S, Allman JM:Anatomical
analysis of an aye-aye brain (Daubentonia madagascariensis, Primates: Prosimii) combining histology, structural magnetic resonance imaging, and diffusion-tensor imaging.Anat Rec A Discov Mol Cell Evol Biol2005,
287A:1026-1037.
84. Barton RA, Purvis A, Harvey PH:Evolutionary radiation of visual and olfactory brain systems in primates, bats and insectivores.Phil Trans R Soc Lond B1995,348:381-392.
85. Ford S:Callitrichids as phyletic dwarfs, and the place of the Callitrichidae in Platyrrhini.Primates1980,21:21-43.
86. Byrne RW:The Thinking Ape: Evolutionary Origins of Intelligence.Oxford University Press, Oxford 1995.
87. Deaner RO, Nunn CL:How quickly do brains catch up with bodies? A comparative method for detecting evolutionary lag.Proc R Soc Lond B 1999,266:687-694.
88. Millien V:Morphological Evolution Is Accelerated among Island Mammals.PLoS Biol2006,4:e321, doi:10.1371/journal.pbio.0040321. 89. Finarelli JA, Flynn JJ:Brain-size evolution and sociality in Carnivora.Proc
Natl Acad Sci USA2009,106(23):9345-9349.
90. Gonzalez-Voyer A, Winberg S, Kolm N:Distinct evolutionary patterns of brain and body size during adaptive radiation.Evolution2009,
63:2266-2274.
91. Zilles K, Armstrong E, Moser KH, Schleicher A, Stephan H:Gyrification in the cerebral cortex of primates.Brain Behav Evol1989,34:143-150. 92. Semendeferi K, Lu A, Damasio H:Humans and great apes share a large
frontal cortex.Nat Neurosci2002,5:272-276.
93. Bush EC, Allman JC:The scaling of frontal cortex in primates and carnivores.Proc Natl Acad Sci USA2004,101:3962-3966. 94. Sherwood CC, Stimpson CD, Raghanti MA, Wildman DE, Uddin M,
Grossman LI, Goodman M, Redmond JC, Bonar CJ, Erwin JM, Hof PR:
Evolution of increased glia-neuron rations in the human frontal cortex. Proc Natl Acad Sci USA2006,203:13606-13611.
95. Zilles K, Rehkemper G:The brain with special reference to the telencephalon.Orang-utan BiologyOxford University Press, OxfordSchwartz JH 1988, 157-176.
96. Pagel M, Meade A:Bayesian analysis of correlated evolution of discrete characters by reversible-jump Markov Chain Monte Carlo.American Naturalist2006,167:808-825.
97. Kass RE, Raftery AE:Bayes factors.J Am Stat Assoc1995,90:773-795. 98. Gilks WR, Richardson S, Spiegelhalter DJ:Introducing Markov Chain Monte
Carlo.Markov Chain Monte Carlo in PracticeLondon: Chapman and HallGilks WR, Richardson S, Spiegelhalter DJ 1996, 1-19.
99. Felsenstein J:Phylogenies and the comparative method.Am Nat1985,
125:1-15.
100. Nunn CL, Barton RA:Comparative methods for studying primate adaptation and allometry.Evol Anthropol2001,10:81-98. 101. Goodman M, Grossman LI, Wildman DE:Moving primate genomics
beyond the chimpanzee genome.Trends Genet2005,21:511-517. 102. Horvath JE, Weisrock DW, Embry SL, Fiorentino I, Balhoff JP, Kappeler P,
Wray GA, Willard HF, Yoder AD:Development and application of a phylogenomic tookit: Resolving the evolutionary history of Madagascar’s lemurs.Genome Res2008,18:489-499.
103. Opazo JC, Wildman DE, Prychitko T, Johnson RM, Goodman M:
Phylogenetic relationships and divergence times among New World monkeys (Platyrrhini, Primates).Mol Phylogenet Evol2006,40:274-280. 104. Page SL, Goodman M:Catarrhine phylogeny: Noncoding DNA evidence
for a diphyletic origin of the mangabeys and for a human-chimpanzee clade.Mol Phylogenet Evol2001,18:14-25.
106. Purvis A:A composite estimate of primate phylogeny.Phil Trans Roy Soc B1995,348:405-421.
107. Steiper ME, Young NM:Primate molecular divergence dates.Mol Phylogenet Evol2006,41:384-394.
108. Wood B, Collard M:The human genus.Science1999,284:65-71. 109. Vekua A, Lordkipanidze D, Rightmire GP, Agusti J, Ferring R, Maisuradze G,
Mouskhelishvili A, Nioradze M, Ponce de Leon M, Tappen M, Tvalchrelidze M, Zollikofer C:A new skull of earlyHomofrom Dmanisi, Georgia.Science2002,297:85-89.
110. Maddison WP, Maddison DR:Mesquite: A modular system for evolutionary analysis. Version 2.5.2008http://mesquiteproject.org. 111. Pedersen N, Holyoak DT, Newton AE:Systematics and morphological
evolution within the moss family Bryaceae: A comparsion between parsimony and Bayesian methods for reconstruction of ancestral character states.Mol Phylogenet Evol2007,43:891-907.
doi:10.1186/1741-7007-8-9
Cite this article as:Montgomeryet al.:Reconstructing the ups and downs of primate brain evolution: implications for adaptive hypotheses andHomo floresiensis.BMC Biology20108:9.
Submit your next manuscript to BioMed Central and take full advantage of:
• Convenient online submission
• Thorough peer review
• No space constraints or color figure charges
• Immediate publication on acceptance
• Inclusion in PubMed, CAS, Scopus and Google Scholar
• Research which is freely available for redistribution
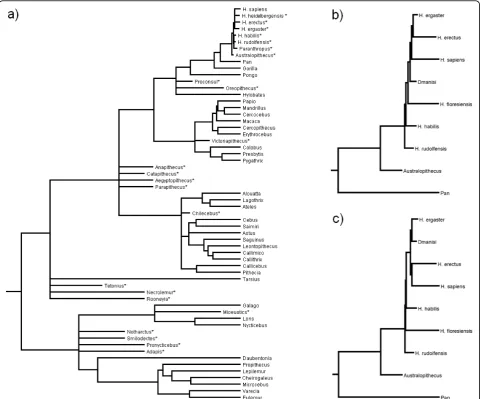
![Figure 2 Phylogeny of extant primate genera. Branches are drawn proportional to time. This figure was prepared in Mesquite [110].](https://thumb-us.123doks.com/thumbv2/123dok_us/8913881.1838065/5.595.58.547.86.571/figure-phylogeny-extant-primate-branches-proportional-prepared-mesquite.webp)