* Corresponding author. Tel: +98 (21) 64545394 E-mail: [email protected] (A. Ahmadi) © 2013 Growing Science Ltd. All rights reserved. doi: 10.5267/j.ijiec.2013.01.001
International Journal of Industrial Engineering Computations 4 (2013)273–284
Contents lists available at GrowingScience
International Journal of Industrial Engineering Computations
homepage: www.GrowingScience.com/ijiec
Considering supply risk for supplier selection using an integrated framework of data envelopment analysis and neural networks
VahidNourbakhsh, Abbas Ahmadi* and MasoudMahootchi
Department of Industrial Engineering and Management Systems, Amirkabir University of Technology, Tehran, Iran
C H R O N I C L E A B S T R A C T
Article history: Received October202012 Received in revised format December 28 2012
Accepted December29 2012 Available online
2January 2013
For many years, supplier selection as an important multi-criteria decision has attracted both the researchers and practitioners. During recent years, high incidence of natural disasters, terrorism attacks, labor strikes and other kinds of risks, also known as disruptions, indicates the vulnerability of procurement process to these unpredicted events. In this study, a new framework is introduced to select suppliers while considering the supply risks. In the proposed framework, an expert determines the reliabilities of procurement elements (i.e., production, transportation and communication) based on some proposed risk factors. Then, a trained Multi-Layer Perceptron (MLP) network plays the role of the expert opinion for estimating the reliability scores. In addition to reliabilities, the Data Envelopment Analysis (DEA) is used to take into account the conventional selection criteria: price, delivery, quality and capacity. A set of Pareto-optimal suppliers is obtained from the combination of efficiencies and reliability scores. Finally, the decision maker chooses between the non-dominated suppliers. Obtained experiment results indicate the effectiveness of the proposed framework.
© 2013 Growing Science Ltd. All rights reserved Keywords:
Data Envelopment Analysis Multi-Layer Perceptron Supplier Selection Supply Risk Disruption
1. Introduction
During the last decades, different geo-political events such as earthquakes, strikes, terrorist attacks and political instability have disrupted the supply process. These supply failures have significant effects on the buyers' performance. For example, the earthquake in Kobe, Japan, halted the production at car manufacturers such as Toyota, Honda, Nissan and Mitsubishi and caused considerable revenue losses (Sheffi, 2005). In 2005, BMW stopped its production for three days due to defective fuel injection pumps delivered by its supplier, Bosch. Furthermore, the company recalled 20,000 cars and stopped the production of 3,600 cars (Reuters, 2005). There are many other companies suffered from such disruptions in the supply process.
tremendously. While Ericsson lost 400 million dollars in terms of potential revenues, Nokia recommenced its production after three days as it has other suppliers to mitigate the shortage (Wall Street Journal, 2001). After a fire in Avon Rubber and Injected Plastics, its customers were obliged to help the firm to rebuild its plant as it was their sole supplier (Wall Street Journal, 2001). Furthermore, many firms have adopted Just-In-Time and lean practices in which they maintain little or no inventory. The studies show that these practices will increase the vulnerability of firms to supply disruption (Sheffi, 2005). Moreover, Just-In-Time indicates the concentration on a particular supplier to achieve economies of scale and lower transaction costs, which in turn will increase the vulnerability (Foster, 2005).
There are many other reasons that account for the vulnerability of firms. Today, the advent of complex global supply chains, in which firms rely on the suppliers, dispersed around the world increases the risks. Obviously, the probability that something affect the normal performance of a particular node or its connection is higher for complex supply chains (Pochard, 2003).
The plethora of supply failures and their considerable impacts ranging from halt of operations, delay or cancelation of customer orders or even loss of customers and revenue have compelled the managers and decision makers to find ways to reinforce their firms against these disruptions. While many studies have addressed the supply risk, there is a lack of comprehensive quantitative methods in this field. In this paper, we propose a novel method to consider both the conventional selection criteria such as price and quality, which are related to suppliers’ reliabilities. On the one hand, for conventional criteria, we utilize data envelopment analysis (DEA) as the most popular method for supplier selection (Ho et al., 2010). On the other hand, regarding suppliers' reliabilities, experts express the reliability of suppliers in different areas and then combined to obtain a single reliability score. To lessen the effort of experts, artificial neural network simulates the judgment of the experts and substitutes the experts. Finally, the decision makers can choose the appropriate suppliers according to the efficiencies and reliability scores from a set of non-dominated suppliers. In other words, the trade-off between the efficiency and reliability helps the decision makers to choose the suppliers.
The rest of the paper is organized as follows. Section 2 reviews the prior studies about supplier selection. In section 3 and section 4, DEA and MLP are explained in detail, respectively. The proposed method is described in section 5. Experiments are conducted for the proposed method in section 6. Finally, the conclusion and future research directions are presented in section 7.
2. Literature Review
Several studies address issues related to supplier selection. These studies have used different methods ranging from Analytic Hierarchy Process (AHP) (Nydick& Hill, 1992) and cost ratio method (Timmerman, 1987) to total cost of ownership (Ellram, 1990; Gheidar Kheljani et al.,2009), linear programming (Ng, 2008; Talluri and Narasimhan, 2003), multi-objective programming (Narasimhanet al., 2006) and DEA (Liu et al., 2000; Ramanathan, 2007; Weber, 1996). Muralidharanet al. (2002) proposed an AHP-based model in which nine criteria were used for ranking the suppliers. Furthermore, they take into account the opinions of experts from different departments such as purchasing and quality control in their model. Chan and Chan (2010) developed an AHP-based model for supplier evaluation and selection as well as Muralidharanet al. (2002) with a case in fashion industry. They considered twenty-nine criteria and divided them to two main groups: suppliers’ performance criteria and company’s strategic criteria. Ng (2008) proposed a linear programming model using the subjective and mathematical approach to maximize the supplier’s score. While aforementioned studies have solved the supplier selection problem from the buyer’s point of view, GheidarKheljaniet al. (2009) developed a mixed-integer nonlinear programming in which the total cost rather than only the buyer’s cost in a two-echelon supply chain (i.e., a buyer and multiple potential suppliers) is minimized.
and electricity distribution (Sadjadi&Omrani, 2008; Sadjadiet al., 2010). In a survey on different applications of DEA, Liu et al. (2012) found that the top-five industries are banking, health care, agriculture and farm, transportation, and education. Weber (1996) for the first time applied DEA to vendor selection problem and evaluated six vendors in the baby food industry. He also illustrated that how much savings and quality improvements could be achieved while keeping the delivery performance unchanged. Regarding DEA, Seydel (2006) compared DEA model with the simple multi-attribute rating technique and demonstrated the prominence of the DEA model. Some studies tried to combine DEA model with other techniques. In this way, Narasimhanet al. (2001) categorized the suppliers to four clusters according to their efficiencies (i.e., DEA model outcome) and their performance. Then, they proposed the benchmarks for the suppliers with inefficiency and/or lack of performance. Furthermore, JafariSonghoriet al.(2011) developed a framework, which aimed at maximizing the efficiencies of suppliers and transportation facilities by using a DEA model while minimizing the ordering, transportation, inventory and holding costs by using a linear programming model.
Although, numerous studies have been accomplished for dealing with supplier selection problems, only some of them have taken the supply risk into account. Among these studies, Berger et al. (2004) considered two types of risks: super-events and unique events that affect a single supplier and multiple suppliers, respectively. They utilized the decision tree algorithm to determine the optimal number of suppliers while considering suppliers’ failures. In 2007, Ruiz-Torres and Mahmoodi presented an extension to the model of Berger et al.(2004). Their models allow a more realistic decision-making process in which the case that suppliers independently fail to supply is considered. They also demonstrated that when suppliers are very unreliable and have a low ability to mitigate the failure of other suppliers, a good strategy is to have multiple suppliers. In addition, Levary (2008) used AHP to rank suppliers while considering the reliability of suppliers and presented a case study to apply the proposed methodology. Xu and Nozick(2009) considered the loss of production capability for suppliers. They presented a two-stage stochastic programming in which there is a trade-off between costs and risks. They explored the effectiveness of their model and proposed a solution scheme in a case study. While Xu and Nozick (2009) considered the uncertainty of suppliers’ capacities, Li and Zabinsky (2011) incorporated uncertainty of both customers’ demands and suppliers’ capacities into their optimization model. They developed a two-stage stochastic programming and a chance-constrained programming model. In both models, a set of Pareto-optimal solutions was obtained by the trade-off between cost and risk.Moqri et al. (2011) investigated supplier selection and order lot sizing using dynamic programming.Azar et al. (2011) presented an empirical investigation using balanced score card method for supplier selection strategy in a case study of part maker industry. ZandeHesami et al. (2011) presented a hybrid analytical network process and fuzzy goal programming for supplier selection in a case study of auto part maker.
Based on the aforementioned points, it seems that further researches for the risk consideration in supplier selection problems are needed. In this study, a new framework is presented in which not only the conventional selection criteria such as quality and price is used but also different risks affecting the procurement process are considered. Here in this research study, DEA as a widely used method for supplier selection (Ho et al.,2010) which is not subjective in comparison to AHP, is utilized to consider the conventional selection criteria. In addition, an expert determines the reliability of suppliers based on some risk factors. Various forms of risks are considered in the selection and the evaluation process as compared to prior studies in which different risk measures are combined to each other to make a single factor. To exploit the expert opinion in a more efficient way, a trained neural network estimates the reliability of suppliers. Finally, the efficiencies and reliability scores are combined to find the best suppliers.
3. Data Envelopment Analysis
In order to compute the efficiency of a DMU, DEA attempts to find a set of weights associated with each input and output such that the DMU’s efficiency is maximized. The only constraint in the plain DEA is that efficiencies of other DMUs should not exceed maximum possible efficiency, namely one. Obviously, the DMUs with the most efficiency have better performance as compared to the others and this assists the DM in choosing between DMUs.
Suppose that there is a set of n DMUs, each of which uses m inputs and s outputs. Let k (k∈
{
1,...,n}
) denote a DMU whose relative efficiency should be maximized. The plain DEA model is given as:1
1
min ,
s r rk r k m i ik i u Y e v X = = =
∑
∑
(1) subject to{
}
1 11, 1,..., ,
s r rj r j m i ij i u Y
e j n
v X = = =
∑
≤ ∀ ∈∑
(2){
}
, 1,..., ,
r
u ≥ε ∀ ∈r s (3)
{
}
, 1,..., .
i
v ≥ε ∀ ∈i m (4)
where, ekis the efficiency of thekthDMU to be maximized (ek should be between zero and one), uris the
weight of output i, viis the weight of input i,Yrj is the amount of output i, andXijis the amount of input i
of DMU j. Xij andYrjshould be positive. In addition, is non-Archimedean infinitesimal value, which
prevents weights to be equal to zero. When efficiency of a DMU is 1, it is called an efficient DMU; otherwise, it is an inefficient one.The above nonlinear model will be transformed into the following linear model:
1
max ,
s r rk r u Y =
∑
(5) subject to 1 1, m i ik i v X = =∑
(6){
}
1 10, 1,..., ,
s m
r rj i ij
r i
u Y v X j n
= =
− ≤ ∀ ∈
∑
∑
(7){
}
, 1,..., ,
i
v ≥ε ∀ ∈i m (8)
{
}
, 1,..., .
r
u ≥ε ∀ ∈r s (9)
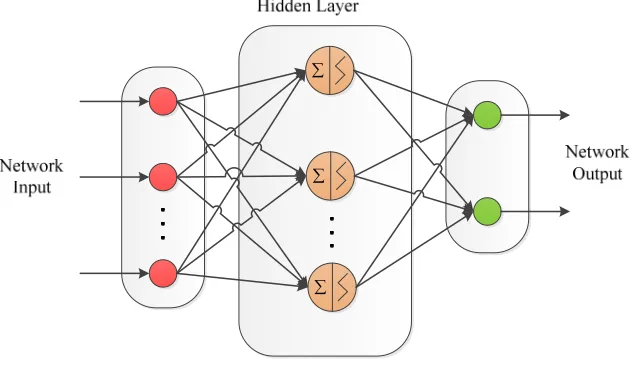
4. Neural Networks(Multi-Layer Perceptron)
∑
∑
∑
Fig. 1. Schematic representation of the MLP network with a single hidden layer (Karray& De Silva, 2004)
In order to train the network, Backpropagation learning (BPL) algorithm as a widely used method for training MLP network is applied. This algorithm was originally developed by Werbos (1974) and firstly implemented by Rumelhartet al. (1986) in the MLP networks with a great success. BPL is based on the gradient descent technique and least mean square error in which the cumulative error (i.e. Euclidean distance between actual and target output) is minimized. The algorithm for a network with a single hidden layer is depicted in Fig. 2 (Karray& De Silva, 2004).
a
Propagate the signal forward through the network a the weights randomly
each tr
nd compute the output values
Compute the total error value
aining pattern
Re In
p itialize
eat For
Update the weights in the network
{termination criteria is met
}
End Until
Fig. 2.Pseudo-code of BPL learning algorithm for a network with a single hidden layer (Karray& De Silva, 2004)
Determining the number of nodes in the hidden layer is important because the neural network’s mapping accuracy and ability to generalize from training data notablydepends on the number of units in hidden layer (Schalkoff, 1997; Alizadeh et al., 2011). A network with small hidden units cannot completely identify the organization in the training data. This is known as under fitting issue in training MLP. At the same time, a network with large hidden units produces undesirable effect that results in units memorizing certain aspects of certain inputs. Consequently, an experiment should be conducted to determine the best number of hidden nodes by trying various numbers and comparing their errors.The accuracy rate of each configuration is computed by means of average Root Mean Square Error function (RMSE), root of mean squared difference between the actual output and the target as:
2 1
( )
,
n
i i i
d t
RMSE
n
=
−
=
∑
(10)
where, di and tiare the actual and target output of thei
th
( )
1.
1 x
sigmoid x
e−
= +
(11)
Here, the sigmoid activation function is selected to satisfy the conditions of Cybenko theorem.
5. Proposed Method
In this study, on one hand, DEA finds the most efficient suppliers according to conventional selection criteria including price, quality, delivery and capacity. On the other hand, a new method is proposed to determine the reliabilities of suppliers. Finally, by combining the obtained efficiencies and reliabilities a set of non-dominated Pareto-optimal solutions are presented to the final decision makers.
While in the proposed method, DEA as the most widely used method for selecting suppliers determines the efficiencies based on conventional criteria, expert opinion is used to determine the reliability of suppliers. The need for human judgment arises from the inherent complexity of risks. There is a wide range of risks that affect the procurement process. In other words, it seems very hard or even impossible to gather information, which can directly be used to determine the reliability of suppliers. To this end, a new method is proposed to extract the reliability of suppliers from some risk factors by the aid of experts. It is worth mentioning that by separating conventional criteria and risks, which are inherently different, a trade-off between performance and reliability is obtained.
To find the reliabilities of suppliers, experts determine each supplier’s reliability as a critical measure in different procurement elements based on some risk factors. To lessen the effort of experts, MLP networks can substitute the experts and play their role to estimate the reliability of new suppliers based on their risk factors. MLP can effectively be used as an expert as its performance in nonlinear function approximation have been proved in different applications (Samarasinghe, 2006). Finally, to reach a single score, the weighted average of reliabilities among different elements is introduced as the reliability score. According to aforementioned efficiencies and reliability scores, suppliers are divided into four main groups as illustrated in Fig. 3. In this way, managers and decision makers can choose suitable suppliers based on the trade-off between efficiency and risk.
The process of determining the efficiencies and reliability scores of suppliers are explained in the following subsections in more detail.
5.1. Determining efficiencies by DEA
As it is clear, the main objective of DEA is to select efficient suppliers using proper criteria. Dickson (1986), a pioneer researcher in DEA, identified 23 criteria for assessing the performance of suppliers based on responses of 170 managers and the purchasing agents. To find the efficiencies of suppliers by DEA, we use the most important criteria such as quality, delivery, price and capacity selected by Ho et al. (2010). These criteria are categorized into the following groups:
Inputs:
• Price: the unit price of the product. Outputs:
• Quality: the expected percent of flawless units,
• On-time delivery: the expected percent of orders delivered on time,
• Capacity: the number of units that the supplier can supply in an ordering period.
5.2. Determining reliabilities by expert opinion and MLP
To find the reliability score of a supplier, the first step is to divide the whole supply processes (i.e., all the processes performed for the delivery of raw material from a supplier to a manufacturer) to different interrelated components each of which has various risk factors. This process is divided into three following main categories called procurement elements in the respective literature:
• Production: the risks that affect the production include facilities’ failure, unavailability of raw materials, labor strikes and natural disasters.
• Transportation: the risks that threat the transportation include vehicles’ failure, route insecurity, terrorist attacks and natural disasters.
• Communication: the risks that threat the communication and information infrastructure include sanctions on transaction that disables the operations and transactions.
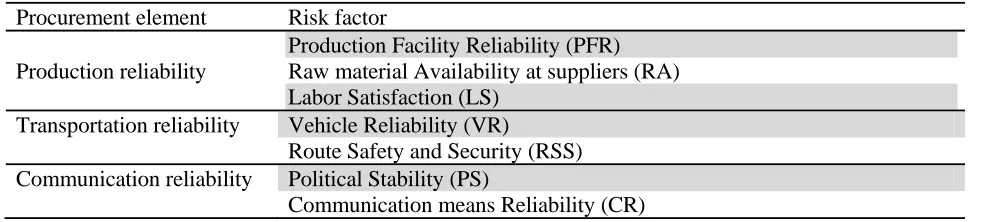
Since the aforementioned risks are very diverse and to some extent unquantifiable, requesting experts to determine the level of these risk criteria for each supplier seems a feasible way. To do this, risk factors that threat each procurement element are extracted as shown in Table 1.
Table 1
Procurement elements and the risk factors that threat them Procurement element Risk factor
Production Facility Reliability (PFR) Production reliability Raw material Availability at suppliers (RA)
Labor Satisfaction (LS) Transportation reliability Vehicle Reliability (VR)
Route Safety and Security (RSS) Communication reliability Political Stability (PS)
Communication means Reliability (CR)
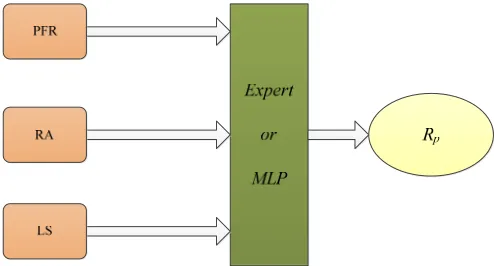
obvious result, the reliabilities of the procurement elements for new suppliers can be estimated using the trained MLP network and not by directly asking the expert to determine the score. If MLP networks are trained sufficiently with enough training data, the MLP networks can substitute the experts. However, if there is insufficient data to train the networks, the networks can be used for pre-qualification of suppliers. Then, experts would perform the more accurate analysis for final selection only among qualified suppliers. In real cases, the decision makers can use the expert opinion to determine the reliability scores until sufficient data for training MLP networks is produced. Therefore, the trained MLP networks can be used instead of the experts or for pre-qualification.
Fig.4.Extracting the reliability score based on the risk factors for production element
To convert these three procurement elements to a single reliability score, the experts determine the relative importance of these criteria in terms of weights. Then, by applying the weighted average method, the final reliability score is determined as follows:
Reliability Score p p t t c c.
p t c
W R W R W R
W W W
⋅ + ⋅ + ⋅
=
+ +
(12)
where, Wp, Wtand Wc are the weights associated with each element reliability score, that is, production,
transportation and communication, respectively.
6. Experimental Results
To assess the effectiveness of the proposed Neural Network-based methodology with risk consideration, a numerical experiment is designed in which data for ten suppliers are generated randomly. The suppliers utilize one input variable, price, to generate three output factors: quality, on-time delivery and capacity. These data along with suppliers’ efficiencies are listed in Table 2. The unit price is purchasing cost paid for each item; quality is the expected percent of flawless units; delivery is the expected percent of orders delivered on time and capacity is the number of units that the supplier can supply in the planning horizon. The price and capacity of each supplier are usually determined by the supplier while quality and delivery can be extracted from the whole transactions reflected in the historical data.
Table 2
Input/output data and efficiencies
Supplier Input Criterion Output Criterion Efficiency
Price Quality Delivery Capacity
1 95 0.94 0.83 210 0.79
2 84 0.85 0.87 450 0.99
3 92 0.99 0.84 280 0.96
4 94 0.88 0.97 240 0.85
5 94 0.87 0.8 320 0.77
6 88 0.97 0.85 450 1
7 92 0.98 0.99 310 1
8 94 0.81 0.9 170 0.73
9 86 0.91 1 340 1
In this experiment, an expert uses risk factors to determine the reliabilities. The values of risk factors are presented in Table 3. It should be noted that the value of each risk factor is between 0 and 10.
Table 3 Risk factors
Risk Factor Supplier
1 2 3 4 5 6 7 8 9 10
PFR 8 4 7 8 9 6 7 7 3 5
RA 6 5 9 5 5 7 8 3 6 7
LS 9 5 5 9 7 9 6 7 4 3
VR 8 6 6 8 7 7 7 8 6 7
RSS 7 5 4 6 7 6 7 5 5 5
PS 9 9 5 5 7 3 3 5 9 9
CR 8 8 7 6 8 8 8 7 7 8
Table 4 demonstrates the reliability of suppliers obtained by experts for each procurement element.
Table 4
Reliability of procurement elements
Procurement element Supplier
1 2 3 4 5 6 7 8 9 10
Production 7 5 7 7 7 7.5 7 6 5 5
Transportation 7.5 5.5 5 7 7 6.5 7 6.5 5.5 6
Communication 8.5 8.5 6 5.5 7.5 5.5 5.5 6 8 8.5
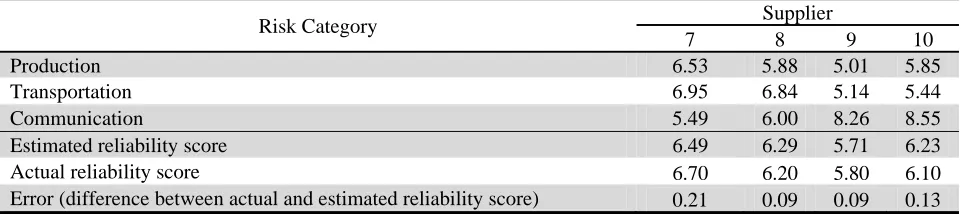
In Table 5 the best architecture of the MLP network, architecture with minimum RMSE, is suggested. Note that the first six out of ten suppliers and the four next ones are used for training and testing the network, respectively. The reliabilities of all four last suppliers estimated using the trained networks are demonstrated in Table 6. The last row of this table indicates a single value as a reliability score for each supplier obtained by taking average of all reliability scores calculated for procurement elements.
Table 5
Different MLP networks’ RMSEs
No. of hidden neurons 1 2 3 4 5 6 7 8 9 10
Production 1.44 1.05 0.49* 0.55 1.53 1.63 0.59 1.87 0.6 0.61
Transportation 0.45 0.47 0.37* 0.51 0.81 0.61 2.18 0.56 1.86 1.21
Communication 0.51 1.4 1.35 0.13* 0.25 1.3 0.98 0.27 1.75 0.28
*Minimum RMSE
Table 6
Actual and Estimated reliability scores (reliability scores obtained by MLP networks)
Risk Category Supplier
7 8 9 10
Production 6.53 5.88 5.01 5.85
Transportation 6.95 6.84 5.14 5.44
Communication 5.49 6.00 8.26 8.55
Estimated reliability score 6.49 6.29 5.71 6.23
Actual reliability score 6.70 6.20 5.80 6.10
Error (difference between actual and estimated reliability score) 0.21 0.09 0.09 0.13
Fig.5. Suppliers grouped according to their efficiencies and reliability scores
According to Fig. 5, seventh and tenth suppliers dominate eighth supplier because both the efficiency and reliability score of the eighth supplier are low. Ninth supplier has a perfect efficiency; however, the seventh supplier in terms of reliability score dominates it. Finally, seventh and tenth suppliers are non-dominated in this experiment. Thus, the decision maker can choose between these non-non-dominated suppliers. It is notable that the error of the MLP network has not affected the final Pareto-solutions.
As determining the number of training patterns is a crucial task to obtain an appropriate neural network, an analysis is conducted on different number of patterns (i.e. 10, 20, 30, 40, 50, 60 and 70). For each case, 80 percent of the data is used for training and the remaining is used for testing the network. Then, the average of the errors (i.e. differences between actual and estimated reliability scores among test data) is computed. The respective errors depicted in Figure 6 indicate that by increasing the number of patterns to 50 patterns the error decreases but after that the error increases which can be resulted from over fitting. However, according to Figure 5, even 10 patterns can adequately distinguish suppliers.
Fig.6.The relationship between number of patterns and the error of the neural networks
7. Conclusion
This study introduces a new method for considering supply risks in supplier selection. The expert determines the reliability of each procurement element based on some proposed risk factors. Then, MLP network is trained to play the role of the expert opinion in estimating the reliabilities. In addition to supply risk, the DEA takes into account the common selection criteria including price, delivery, quality and capacity. The efficiencies are then combined with the reliability scores so that non-dominated suppliers are obtained. The decision maker can choose between the obtained non-dominated suppliers. Finally, the experiments verified the effectiveness of the proposed framework.
Supplier 7 Supplier 8
Supplier 9 Supplier 10
5 5.5 6 6.5 7 7.5 8 8.5 9 9.5 10
0.5 0.55 0.6 0.65 0.7 0.75 0.8 0.85 0.9 0.95 1
Re
li
ab
il
it
y Scor
e
Efficiency
Estimated reliability scores
Actual reliability scores
0 0.02 0.04 0.06 0.08 0.1 0.12 0.14
10 20 30 40 50 60 70
E
rror
(d
if
fer
en
ce
be
tw
ee
n actu
al
and
es
ti
mated
r
el
iab
il
it
y
score
s
)
In the future researches, it is recommended to cluster the suppliers according to their efficiencies and reliabilities, especially when the number of suppliers is considerably high. In addition, in this study, it is assumed that the expert expresses his/her opinion in terms of crisp values. However, it might not be the case in reality and one can use fuzzy set theory to deal with the vagueness of expert attitude. Finally yet importantly, while this study focuses on introducing a novel method to consider risk in the selection of suppliers, applying this method for real cases is of great value.
References
Alizadeh, M., Gharakhani, M., Fotoohi, E., & Rada, R. (2011). Design and analysis of experiments in ANFIS modeling for stock price prediction. International Journal of Industrial Engineering Computations, 2(2), 409-418.
Azar, A., Olfat, L., Khosravani, F., & Jalali, R. (2011). A BSC method for supplier selection strategy using TOPSIS and VIKOR: A case study of part maker industry. Management Science Letters, 1(4), 559-568.
Berger, P.D., Gerstenfeld, A., & Zeng, A.Z. (2004). How many suppliers are best? A decision-analysis approach. Omega, 32(1), 9-15.
Caballer-Tarazona M., Moya-Clemente I., Vivas-Consuelo D., Barrachina-Martínez, I. (2010). A model to measure the efficiency of hospital performance. Mathematical and Computer Modelling, 52(7), 1095-1102.
Chan, F. T. S., & Chan, H. K. (2010). An AHP model for selection of suppliers in the fast changing fashion market. The International Journal of Advanced Manufacturing Technology, 51(9), 1195-1207.
Charnes, A., Cooper, W., & Rhodes, E. (1978). Measuring the efficiency of decision making units.
European Journal of Operational Research, 2, 429-444.
Cybenko, G. (1989). Approximation by super positions of a sigmoidal function. Mathematics of Control, Signals, and Systems, 2(4), 303-314.
Dickson, G.W. (1966). An analysis of vendor selection systems and decisions. Journal of Purchasing, 2(1), 5-17.
Ellram, L.M. (1990). The supplier selection decision in strategic partnerships. Journal of Purchasing and Materials Management, 26(4), 8-14.
GheidarKheljani, J., Ghodsypour, S., & O'Brien, C. (2009). Optimizing whole supply chain benefit versus buyer's benefit through supplier selection. International Journal of Production Economics, 121(2), 482-493.
Ho, W., Xu X., &Dey, P.K. (2010). Multi-criteria decision making approaches for supplier evaluation and selection: A literature review. European Journal of Operational Research, 202(1), 16-24.
JafariSonghori, M., Tavana M., Azadeh, A., &Khakbaz, M. H. (2011). A supplier selection and order allocation model with multiple transportation alternatives. The International Journal of Advanced Manufacturing Technology, 52(1), 365-376.
Karray, F. O., & De Silva, C. W. (2004). Soft computing and intelligent systems design: theory, tools, and applications: Addison-Wesley.
Levary, R.R. (2008). Using the analytic hierarchy process to rank foreign suppliers based on supply risks. Computers and Industrial Engineering, 55(2), 535-542.
Li, L. &Zabinsky, Z.B. (2011). Incorporating uncertainty into a supplier selection problem.
International Journal of Production Economics, 134(2), 344-356.
Liu, J., Ding, F.Y., &Lall, V. (2000). Using data envelopment analysis to compare suppliers for supplier selection and performance improvement. Supply Chain Management: An International Journal, 5(3), 143-150.
Liu, J. S., Lu, L. Y. Y., Lu, W.-M., & Lin, B. J. Y. (2013). A survey of DEA applications. Omega, 41(5), 893–902.
Moqri, M. M., MoshrefJavadi, M., &Yazdian, S. A. (2011). Supplier selection and order lot sizing using dynamic programming. International Journal of Industrial Engineering Computations, 2(2), 319-328. Muralidharan, C., Anantharaman, N., &Deshmukh, S. (2002). A Multi-Criteria Group Decisionmaking
Narasimhan, R., Talluri, S., Mahapatra, S.K. (2006). Multi-product, multi-criteria model for supplier selection with product life cycle considerations. Decision Sciences, 37(4), 577-603.
Narasimhan, R., Talluri, S., & Mendez, D. (2001). Supplier evaluation and rationalization via data envelopment analysis: an empirical examination. Journal of Supply Chain Management, 37(3), 28-37. Ng, W.L. (2008). An efficient and simple model for multiple criteria supplier selection problem.
European Journal of Operational Research, 186(3), 1059-1067.
Nydick, R. L., & Hill, R. P. (1992). Using the analytic hierarchy process to structure the vendor selection procedure. International Journal of Purchasing and Materials Management, 28(2), 31-36. Pochard, S. (2003). Managing risks of supply-chain disruptions: dual sourcing as a real option.
Citeseer.
Ramanathan, R. (2007). Supplier selection problem: integrating DEA with the approaches of total cost of ownership and AHP. Supply Chain Management: An International Journal, 12(4), 258-261. Reuters (2005). BMW to recall 20,000 cars with faulty Bosch part, Press release on February 2, 2005. Ruiz-Torres, A.J., &Mahmoodi, F. (2007). The optimal number of suppliers considering the costs of
individual supplier failures. Omega, 35(1), 104-115.
Rumelhart, D. E., Hintont, G. E., & Williams, R. J. (1986). Learning representations by back-propagating errors. Nature, 323(6088), 533-536.
Sadjadi, S., &Omrani, H. (2008). Data envelopment analysis with uncertain data: An application for Iranian electricity distribution companies. Energy Policy, 36(11), 4247-4254.
Sadjadi, S., &Omrani, H. (2010). A bootstrapped robust data envelopment analysis model for efficiency estimating of telecommunication companies in Iran. Telecommunications Policy, 34(4), 221-232. Sadjadi, S., Omrani, H., Abdollahzadeh, S., Alinaghian, M., &Mohammadi, H. (2011). A robust
super-efficiency data envelopment analysis model for ranking of provincial gas companies in Iran. Expert Systems with Applications, 38(9), 10875-10881.
Sadjadi, S., Omrani, H., Makui, A., &Shahanaghi, K. (2011). An interactive robust data envelopment analysis model for determining alternative targets in Iranian electricity distribution companies. Expert Systems with Applications, 38(8), 9830-9839.
Samarasinghe, S. (2006). Neural networks for applied sciences and engineering: from fundamentals to complex pattern recognition: Auerbach Publications.
Schalkoff, R.J. (1997). Artificial neural networks. McGraw-Hill Companies.
Seydel, J. (2006). Data envelopment analysis for decision support. Industrial Management and Data Systems, 106(1), 81-95.
Sharma S., and Gupta S. (2010). Malmquist productivity and efficiency analysis for banking industry in India. International Journal of Business Excellence, 3(1), 65-76.
Sheffi, Y. (2005). The Resilient Enterprise: Overcoming Vulnerability for Competitive Advantage. Cambridge, MA: MIT Press.
Talluri, S., &Narasimhan, R. (2003). Vendor evaluation with performance variability: a max-min approach. European Journal of Operational Research, 146(3), 543-552.
Timmerman, E. (1987). An approach to vendor performance evaluation. Engineering Management Review, IEEE, 15(3), 14-20.
Wall Street Journal (2001). Trail by Fire: A Blaze in Albuquerque Sets off Major Crisis for Cell-phone Giants. Press release on January 29, 2001.
Werbos, P. (1974). Beyond regression: new tools for prediction and analysis in the behavioral sciences. PhD, Harvard.
Xu, N., &Nozick, L. (2009). Modeling supplier selection and the use of option contracts for global supply chain design. Computers and Operations Research, 36(10), 2786-2800.
ZandeHesami, H., Afshari, M.A., Ayazi, S.A., &SiahkaliMoradi, J. (2011). A hybrid analytical network process and fuzzy goal programming for supplier selection: A case study of auto part maker.
![A Molecular Electron Density Theory Study of the Reactivity of Azomethine Imine in [3+2] Cycloaddition Reactions](data:image/gif;base64,R0lGODlhAQABAIAAAP///wAAACH5BAEAAAAALAAAAAABAAEAAAICRAEAOw==)