* Corresponding author. Tel.: +91-9416358678 E-mail: [email protected] (K. Jangra) © 2011 Growing Science Ltd. All rights reserved. doi: 10.5267/j.ijiec.2011.04.005
International Journal of Industrial Engineering Computations 2 (2011) 479–490
Contents lists available at GrowingScience
International Journal of Industrial Engineering Computations
homepage: www.GrowingScience.com/ijiec
Simultaneous optimization of material removal rate and surface roughness for WEDM of WC-Co composite using grey relational analysis along with Taguchi method
Kamal Jangraa*, Sandeep Grovera and Aman Aggarwalb
a
Department of Mechanical Engineering, YMCA University of Science and Technology, Faridabad, India b
Mechanical and Automation Engineering Department, Maharaja Agrasen Institute of Technology, Sector-22, Rohini, Delhi 110085, India A R T I C L E I N F O A B S T R A C T
Article history:
Received 20 January 2011 Received in revised form April, 20, 2011 Accepted 20 April 2011 Available online 24 April 2011
In this paper, wire electrical discharge machining of WC-Co composite is studied. Influence of taper angle, peak current, pulse-on time, pulse-off time, wire tension and dielectric flow rate are investigated for material removal rate (MRR) and surface roughness (SR) during intricate machining of a carbide block. In order to optimize MRR and SR simultaneously, grey relational analysis (GRA) is employed along with Taguchi method. Through GRA, grey relational grade is used as a performance index to determine the optimal setting of process parameters for multiple machining characteristics. Analysis of variance (ANOVA) shows that the taper angle and pulse-on time are the most significant parameters affecting the multiple machining characteristics. Confirmatory results, proves the potential of GRA to optimize process parameters successfully for multi-machining characteristics.
© 2011 Growing Science Ltd. All rights reserved Keywords:
Tungsten carbide composite Wire electrical discharge machining
Taguchi method Grey relational analysis Multi-characteristics optimization
1. Introduction
The cemented carbides such as WC-Co are typically used in tool and die industries because of their excellent hardness and strength. It is hard to machine material, produced by sintering of WC powder with the binder (typically Co or Ni) at temperature near the melting point of the metal (Kim et al., 2005). The formation of liquid phase during sintering enhances the densification process and hence increases the hardness of the composite.
produced between the wire electrode (usually smaller than 0.3 mm) and workpiece through deionised water, (used as dielectric medium surrounding the workpiece) which erodes the workpiece to produce complex of two and three-dimensional shapes (Çaydaş et al., 2009).
Some unstable machining during EDM of tungsten carbide (Mahdavinejad, 2005) composite has been found. This unstable machining is due to the large difference between the electrical conductivity, melting and evaporation temperature of WC and Co grains. The melting and evaporation temperature are 2800o C, 6000o C for WC and 1320o C, 2700oC for Co, respectively. Therefore, discharge energy tends to melt, evaporate and remove cobalt even before the melting of WC. As a result, the WC grains may be released without melting and hence causes unstable machining (Saha et al., 2008). In order to achieve an efficient process planning in machining of WC-Co composite into desired shape, we need accurate machinability data. Jangra et al. (2011) evaluated the effect of various factors and their sub-factors on machinability of WC-Co composite with WEDM using digraph and matrix method. They broadly grouped these factors into work material, machine tool, tool electrode, cutting conditions and geometry to be machined where machinability is measured in terms of material removal rate (MRR). They concluded that the machine tool is the most influencing factor affecting the machinability of WC-Co composite. Low cobalt concentration and small grain size favours the high MRR. In case of cutting conditions, good conductivity and high flow rate of distilled water results in high MRR.
The influence of cobalt concentration and electrical conductivity of the dielectric fluid on WEDM of sintered carbide has been studied by Kim and Kruth (2001). Results revealed that increase of cobalt amount in carbides affect the metal removal rate and worsen the surface quality as greater quantity of solidified metal gets deposited on the eroded surface. Higher electrical conductivity of water yields a higher material removal rate but poorer surface roughness. Lauwers et al. (2006) described the influence of composition and grain size of WC-based cermets on manufacturability by WEDM. It was shown that the cutting rate decreases with increasing grain size and cobalt percentage, which can be explained mainly by the change in thermal conductivity of the material.
An extensive experimental study was conducted by Lee and Li (2001) to investigate the effect of machining parameters such as the electrode materials, electrode polarity, open circuit voltage, peak current, pulse duration, pulse interval and flushing on the machining characteristics, such as MRR, surface finish and relative tool wear in EDM of tungsten carbide. They observed that the MRR generally decreases with the increase of open circuit voltage. For low current setting, the MRR increases with increase in peak current, but becomes constant when machining at higher values of peak current. The surface roughness increases with increasing peak current. Increase in pulse duration results in increase in MRR. Lee and Li (2003) studied surface integrity of EDMed surface of tungsten carbide. They found that the surface roughness is a function of two main parameters, peak current and pulse duration, both of which were settings of the power supply. High peak current and/or long pulse duration produces a rough surface. At high peak current and pulse duration abundance of micro-cracks was observed. Saha et al. (2008) developed a second order multi-variable regression model and a feed forward back-propagation neural network to correlate the input process parameters, such as pulse on time, pulse-off time, peak current and capacitance with the performance measures namely cutting speed and surface roughness while doing WEDM of tungsten carbide-cobalt composite material. Increase in both peak current and capacitance led to increase of cutting speed and surface roughness within the range of investigation. Chen at al. (2010) optimized the WEDM for pure tungsten using an approach that integrates Taguchi’s parameter design method, back-propagation neural network, genetic algorithm and engineering optimization concepts. Through ANOVA, the percentage of contribution to the WEDM process, the pulse on time is the most significant controlled factor affecting the cutting speed and surface roughness. Several other researchers (Puertas et al., 2004; Kanagarajan et al., 2006; Kung et al., 2007; etc.) investigated the performance of EDM in processing of tungsten carbide.
P en th p fu p an o w ch to w u g co th (2 el re re co R ro co ch m 2 2 In co th H m m 0 1 b Phadke (1989 ngineering j heory propo
oor, insuffic urther be ef
erformance nalyze the rthogonal ar with multiple haracteristic o optimize t weld qualitie sing the gre rey relation omposites. P he optimal d 2009) optim
lectronic pri elational ana elational ana omponent a Results show ough cutting onclude that haracteristic multiple-optim . Experimen .1 Experime
n this study, omposite ha hickness 13 HRC, respect manufactured machine tool -63μs; wire 2 litre per m ecause of its
9), it is diffi judgment is
sed by Den cient and un ffectively ad characterist processes w rray and gre e performan cs can be solv
the process es. Huang et ey relational
nal analysis Pan et al. (2 design of cutt mized the m inted circuit alysis. Tzeng
alysis. Lu e analysis for wed that the p
g processes t the grey re cs in differe
mization of
ntal set up,
ental set up
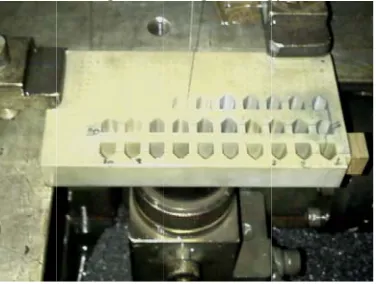
, intricate m aving 6% c mm. The d tively. The d by Electron
were as fol speed, 1-15 minute (LM s good capab
K. Jangra et al.
cult to optim primarily u g (1982) ha ncertain info dopted for s ics. In recen with multipl ey relational
ce character ved, effectiv parameters t al. (2003) analysis alo s to investi 2007) combin
ting paramet multiple per
board (PCB g et al. (200 et al. (2009 optimization proposed ap
in high sp elational ana ent fields. T the machinin
design and
machining of obalt was t density and experiments nica Machin llows: peak
m/min.; wir -1). Zinc coa
bility to susta
Fig. 1.
/ International Journal o
mize multi-r used to reso as been prov ormation. Th olving the c nt years, gre le performan
analysis to ristics. The r vely. Tarang of submerg successfully ong with Ta igate the E ned Taguch ters for Nd: formance ch B) carrier sub 09) optimize 9) applied th
n design of proach can b eed end mi alysis is a be Therefore, gr ng character
results
f WC-Co com taken as a w
hardness of s were perfo ne Tool Ltd, current, 10-2 re tension, 1 ated brass w ain high disc
Cavities pro
of Industrial Engineering
esponse in c olve such a ven to be us he grey rela complicated ey relational
nce charact optimize th results show
et al. (2002 ged arc weld y optimized aguchi metho EDM param
i method wi YAG laser w haracteristic bstrate of ad ed the CNC he grey rel f the cutting be useful too illing proces
etter approa rey relationa ristics for W
mposite was work materi f die materia ormed on
5-India. The r 230 amp.; p 1-15N; servo wire of diam charge energ
oduced in car
g Computations 2 (2011)
complex pro complicated seful for dea
tional analy d interrelatio analysis ha eristics. Lin he electrical
wed that the ) utilized the ding in hard
the machini od. Narende meters on m
ith grey rela welding titan cs in laser dvanced integ
turning oper lational anal g parameters ol to improv ss. Based o ch for optim al analysis
EDM of WC
s performed ial in the fo al was meas
axis sprint c range of var pulse-on time o voltage, 10 meter 0.25 m
gy.
rbide block )
ocess by Tag d problem. aling with th ysis based on onship amon
as become a n and Lin ( discharge m problem of e grey-based dfacing, con
ing paramete r singh et al machining o ational analy nium alloy p cutting of grated circui ration for SK lysis couple s in high sp ve the cuttin
n the above mization of m
is utilized i C-Co compo
as shown i orm of rect sured as 14. cut (ELPLU riable param e, 100-131μ
0-90 V; diele mm was used
guchi method The grey sy he problems
n this theory ng the desig
powerful to (2002) comb machining pr
f multiple qu d Taguchi m nsidering mu
ers in wire l. (2004) ad of Al-10% ysis to inves plates. Li and
specially sh it (IC) using KD11 using ed with prin peed end mi
g performan e survey we multiple resp in this study osite.
n Fig. 1. W angular blo 95 g/cm3 an US-40)
wire-eters in sprin
μs; pulse-off ectric flow ra
d as an elec 481 d and ystem s with y can gnated ool to bined rocess uality method ultiple EDM dopted SiCp tigate d Tsai haped g grey g grey nciple illing. nce of e can ponse y, for WC-Co ck of nd 77
2.2 Experimental design
In present work, six process parameters namely peak current, pulse-on time, pulse-off time, wire tension, dielectric flow rate and taper angle were selected as input variables during intricate cutting of WC-%6Co composite with WEDM. The experiments were carried out with fixed value of servo voltage at 30V and distilled water was used as a dielectric fluid with a conductivity of 20S. Out of six input parameters, taper angle, which is a geometrical variable was kept at two levels while all five variables were assigned values of three levels. Taper angle was considered to provide some draft angle keeping in mind the concept of die and punch manufacturing. Preliminary experiments were conducted to select the range and values of the machining parameters. These results were discussed by Jangra et al. (2011) in section 5. Table 1 depicts the values of levels of the selected process variables. As the thickness of workpiece material is low (13 mm), therefore, feed rate (or downward movement) of wire was kept constant at a value of 8 m/min. Wire offset was taken at zero value.
Table 1
Process variables and their levels
Symbol Process Parameters Level 1 Level 2 Level 3
A Taper angle (degree) 3 1.5 -
B Peak Current (ampere) 80 100 120
C Pulse-on time (μs) 108 115 122
D Pulse-off time (μs) 30 40 50
E Wire Tension (N) 6 8 10
F Dielectric flow rate (LM-1) 4 7 10
The orthogonal array forms the basis for the experimental analysis in the Taguchi method. The selection of orthogonal array is concerned with the total degree of freedom of process parameters. Total degree of freedom (DOF) associated with six parameters is equal to 11 (1×1+5×2). The degree of freedom for the orthogonal array should be greater than or at least equal to that of the process
parameters. Thereby, a L18 orthogonal array having degrees of freedom equal to 17 has been
considered in present case. The experimental layout is shown in Table 2.
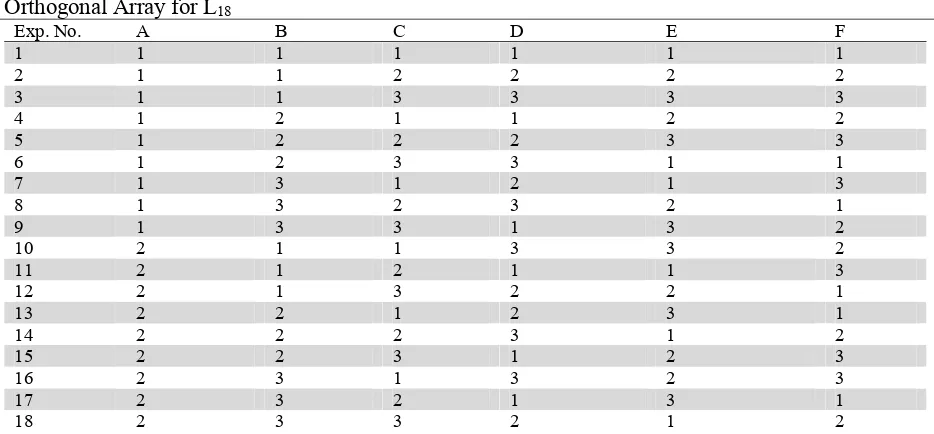
Table 2
Orthogonal Array for L18
Exp. No. A B C D E F
1 1 1 1 1 1 1
2 1 1 2 2 2 2
3 1 1 3 3 3 3
4 1 2 1 1 2 2
5 1 2 2 2 3 3
6 1 2 3 3 1 1
7 1 3 1 2 1 3
8 1 3 2 3 2 1
9 1 3 3 1 3 2
10 2 1 1 3 3 2
11 2 1 2 1 1 3
12 2 1 3 2 2 1
13 2 2 1 2 3 1
14 2 2 2 3 1 2
15 2 2 3 1 2 3
16 2 3 1 3 2 3
17 2 3 2 1 3 1
18 2 3 3 2 1 2
2.3 Experimental results
K. Jangra et al. / International Journal of Industrial Engineering Computations 2 (2011) 483
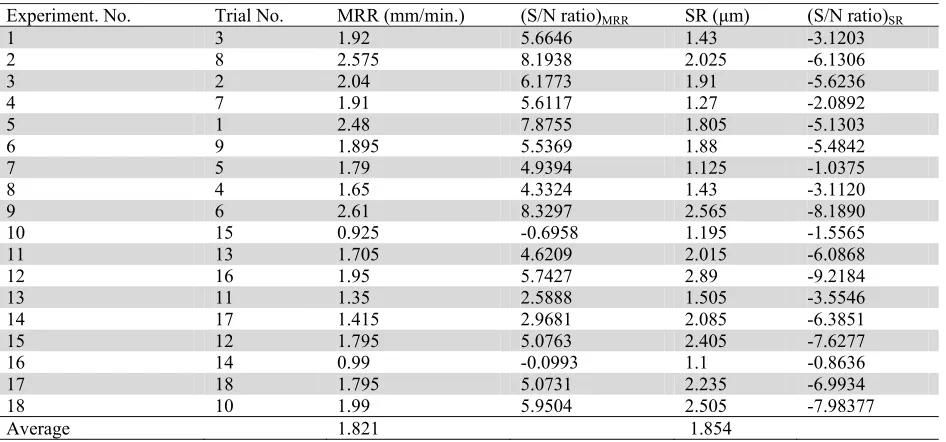
mm/min. which was observed from machine tool monitor screen. SR value (in µm) was measured in terms of mean absolute deviation (Ra) using the digital surface tester Mitutoyo 201P. Observed machining characteristics are depicted in Table 3.
Table 3
Mean values and S/N ratios of observed results
Experiment. No. Trial No. MRR (mm/min.) (S/N ratio)MRR SR (μm) (S/N ratio)SR
1 3 1.92 5.6646 1.43 -3.1203
2 8 2.575 8.1938 2.025 -6.1306
3 2 2.04 6.1773 1.91 -5.6236
4 7 1.91 5.6117 1.27 -2.0892
5 1 2.48 7.8755 1.805 -5.1303
6 9 1.895 5.5369 1.88 -5.4842
7 5 1.79 4.9394 1.125 -1.0375
8 4 1.65 4.3324 1.43 -3.1120
9 6 2.61 8.3297 2.565 -8.1890
10 15 0.925 -0.6958 1.195 -1.5565
11 13 1.705 4.6209 2.015 -6.0868
12 16 1.95 5.7427 2.89 -9.2184
13 11 1.35 2.5888 1.505 -3.5546
14 17 1.415 2.9681 2.085 -6.3851
15 12 1.795 5.0763 2.405 -7.6277
16 14 0.99 -0.0993 1.1 -0.8636
17 18 1.795 5.0731 2.235 -6.9934
18 10 1.99 5.9504 2.505 -7.98377
Average 1.821 1.854
3. Optimization of individual machining characteristics
In Taguchi method, the basic method converts the objective parameters to signal-to-noise (S/N) ratio treated as the quality characteristics evaluation index. The least variation and the optimal design are obtained by means of the S/N ratio. The higher the S/N ratio, the more stable the achievable quality. Depending on the required objective characteristics, there are three types of S/N ratio- the lower-the-better, the higher-the-better and the nominal-the-better. In present work, two types of S/N ratio has been used; Higher-the-better for MRR and lower-the-better for SR.
The S/N ratio with a higher-the-better characteristic that can be expressed as follows,
. 1 1 log 10
1 2⎪⎭
⎪ ⎬ ⎫ ⎪⎩
⎪ ⎨ ⎧
∑ −
=
= n
i ij
ij
y n
η
(1)The S/N ratio with a lower-the-better characteristics can be expressed as follows, ,
1 log 10
1 2
⎭ ⎬ ⎫ ⎩
⎨ ⎧ ∑ −
=
=
n
i ij
ij y
n
η (2)
where yij is the ith experiment at the jth test and n is the total number of tests. Table 3 shows the S/N ratios of measured mean values of MRR and SR.
The response table using Taguchi method is employed here to calculate the effect of each level of process parameter on machining characteristics. It is done by sorting the mean values of machining characteristics corresponding to levels of the process parameter in each column of the orthogonal array, and taking an average on those with same level. For example, the average effect on MRR for parameters A and B at level 1 can be calculated as follows:
A1 = (1.92 + 2.575 + 2.04 + 1.91 + 2.48 + 1.895 + 1.79 + 1.65 + 2.61)/9 = 2.097, B1 = (1.92 + 2.575 + 2.04 + 0.925 + 1.705 + 1.95)/6 = 1.853.
Table 4
Response for mean cutting speed and surface roughness
Mean cutting speed Mean surface roughness
Level A B C D E F Level A B C D E F
1 2.097 1.853 1.481 1.956 1.786 1.76 1 1.716 1.911 1.271 1.987 1.840 1.895
2 1.546 1.808 1.937 2.023 1.812 1.904 2 1.993 1.825 1.933 1.976 1.853 1.941
3 --- 1.804 2.047 1.486 1.867 1.80 3 ---- 1.827 2.359 1.60 1.869 1.727
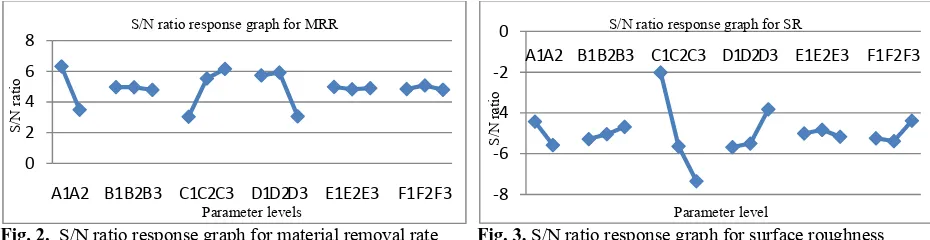
Fig. 2 and Fig. 3 show the S/N ratio plots for MRR and SR. The optimum parameters combination for MRR and SR are A1B1C3D2E1F2 and A1B3C1D3E2F3 corresponding to the largest values of S/N ratio for all control parameters.
Fig. 2. S/N ratio response graph for material removal rate Fig. 3. S/N ratio response graph for surface roughness
3.1 Predicted optimal results
In order to predict the optimal values of the machining characteristics, only significant parameters are included which were found utilizing analysis of variance (ANOVA). The optimal values are predicted using the following relationship,
∑ −
+ =
=
q
i i m
m opt
1(η η ),
η
η (3)
where η is the total mean of the machining characteristic under consideration; η is the mean values at the optimum level (from response Tables) and q is the number of process parameters that significantly affects the machining characteristics.
Table 5
ANOVA for mean MRR
Source DF Sum of square Variance F p-value % contribution
A 1 1.36400 1.36400 81.63 0.000* 54.95 B 2 0.00874 0.00437 0.26 0.778 0.17 C 2 1.08010 0.54005 32.32 0.001* 21.76 D 2 1.02671 0.51336 30.72 0.001* 20.68 E 2 0.02045 0.01023 0.61 0.573 0.0041 F 2 0.06647 0.03323 1.99 0.217 1.34 Error 6 0.10026 0.01671 0.67 Total 17 3.66674
DF: degree of freedom; * significant factor;
Table 6
ANOVA for mean SR
Source DF Sum of square Variance F p-value % contribution
A 1 0.34583 0.34583 10.25 0.019* 13.47 B 2 0.02891 0.01445 0.43 0.670 0.56 C 2 3.60863 1.80432 53.47 0.000* 70.29 D 2 0.58176 0.29088 8.62 0.017* 11.33 E 2 0.00256 0.00128 0.04 0.963 0.05 F 2 0.15261 0.07630 2.26 0.185 2.90
Error 6 0.20246 0.03374 1.31
Total 17 4.92276
DF: degree of freedom; * significant factor; 0
2 4 6 8
A1A2 B1 B2B3 C1C2C3 D1D2D3 E1E2E3 F1F2F3
S/
N r
atio
Parameter levels S/N ratio response graph for MRR
‐8
‐6
‐4
‐2 0
A1A2 B1 B2B3 C1C2C3 D1D2D3 E1E2E3 F1F2F3
S/
N r
atio
K. Jangra et al. / International Journal of Industrial Engineering Computations 2 (2011) 485
Table 5 and 6 depict the ANOVA for MRR and SR, respectively. ANOVA depicts that three process parameters namely taper angle (A), pulse-on time (C) and Pulse-off time (D) are the most significant
(since p-value ≤ 0.05) parameters affecting the MRR and SR under 95% confidence level. Peak
current shows the least contribution. Insignificance of dielectric flow rate and wire tension may be due to the low thickness of workpiece (13mm). In addition, the gap between work surface and upper wire nozzle is very low (1.5mm), which resists the wire electrode vibration even at low wire tension. Since only three parameters (A, C and D) are the most significant factors affecting the MRR, therefore, only these parameters are used to predict the optimal value of MRR. Using Eq. (3), the optimum value is calculated as follows,
∑ − = + − + − + − =
+ =
=
3
1( ) 1.821 (2.097 1.8210) (2.047 1.821) (2.023 1.821) 2.52 mm/min.
i i m
m
opt η η η
η
Similarly, optimal value for SR is predicted. Confirmatory experiments were conducted for MRR and SR corresponding to their optimal setting of process parameters to validate the used approach. Table 7 displays the predicted and experimental values of MRR and SR.
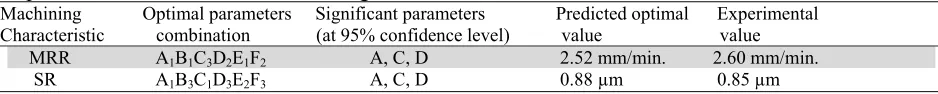
Table 7
Optimal values of individual machining characteristics
Machining Optimal parameters Significant parameters Predicted optimal Experimental Characteristic combination (at 95% confidence level) value value
MRR A1B1C3D2E1F2 A, C, D 2.52 mm/min. 2.60 mm/min. SR A1B3C1D3E2F3 A, C, D 0.88 µm 0.85 µm
4.Multi-machining characteristics optimization using grey relational analysis
In order to optimize the MRR and SR simultaneously using grey relational analysis (GRA), the following steps were followed:
• Convert the experimental data into S/N values, • Normalize the S/N ratio,
• Perform the grey relational generating and calculate the grey relational coefficient,
• Calculate the grey relational grade by using the weighing factor for the performance characteristics, • Analyse the experimental results using the grey relational grade and statistical analysis of variance (ANOVA),
• Select the optimal levels of process parameters,
• Conduct the confirmation experiment to verify the optimal process parameter settings.
4.1 Grey relational analysis
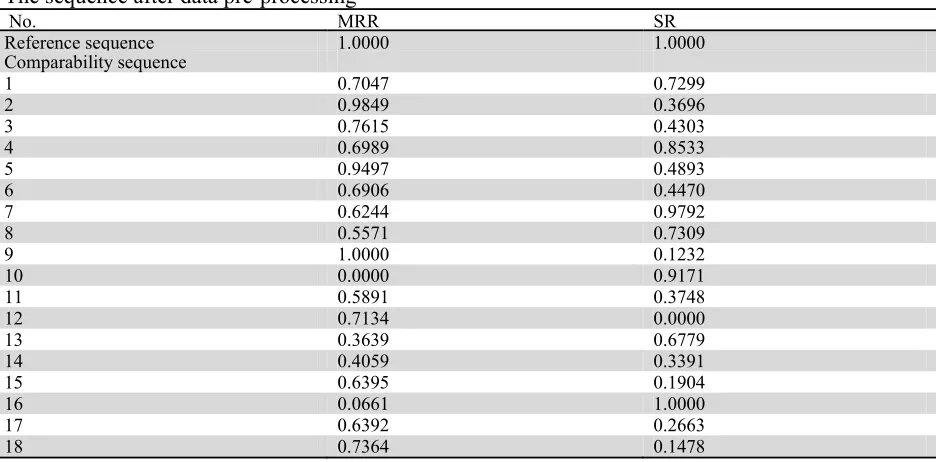
Grey data processing must be performed before calculating the grey correlation coefficients. In this study, a linear normalization of the experimental results (S/N ratios) for MRR and SR were performed in the range of 0 and 1, which is also called the grey relational generating. A linear data pre-processing method for the S/N ratio can be expressed as follows,
, ) ( min ) ( max
) ( min ) ( )
( 0 0
0 0
*
k x k
x
k x k
x k
x
i i
i i
i −
−
= (4)
where xi*(k) is the sequence after the data processing; xio(k) is the original sequence of S/N ratio, i =
1, 2, 3…., m and k =1, 2,…., n with m=18 and n=2; max is the largest value of ; min
is the smallest value of . Table 8 shows the normalized S/N ratio for the MRR and SR.
The outcomes are denoted as x*0(k) and x*i (k) for reference sequence and comparability sequence,
Table 8
The sequence after data pre-processing
No. MRR SR
Reference sequence 1.0000 1.0000
Comparability sequence
1 0.7047 0.7299
2 0.9849 0.3696
3 0.7615 0.4303
4 0.6989 0.8533
5 0.9497 0.4893
6 0.6906 0.4470
7 0.6244 0.9792
8 0.5571 0.7309
9 1.0000 0.1232
10 0.0000 0.9171
11 0.5891 0.3748
12 0.7134 0.0000
13 0.3639 0.6779
14 0.4059 0.3391
15 0.6395 0.1904
16 0.0661 1.0000
17 0.6392 0.2663
18 0.7364 0.1478
Next, the grey relational coefficient was calculated to express the relationship between the best (reference) and the actual normalized S/N ratio. The grey relational coefficient is expressed as follows,
. . . 0 . 1 (5)
where is the deviation sequence of reference sequence and comparability sequence
, i.e. = is the absolute value of the difference between and
,
min. min. ,
max. max. ,
is the distinguishing coefficients 0, 1 . is set as 0.5 in this study. The purpose of defining this
coefficient is to show the relational degree between the reference sequences and the
comparability of 18 sequences . where i = 1, 2, 3…., m and k =1, 2,…., n with m=18 and n=2 in this study. Using Table 9, the deviation sequence ∆ can be calculated as follows:
∆ 1 1.0000 0.7047 0.2953,
∆ 2 1.0000 0.7299 0.2701,
Therefore, ∆ 0.2953, 0.2701 .
The same calculating method was performed for i =1-18, and the results of all ∆ for i =1-18 are listed in Table 8. Investigating the data presented in Table 9, we can find that (k) and (k) are as follows:
= 1 2 1.000,
= 1 2 0.000,
According to Table 9 and Eq. (5), the grey relational coefficient . can be calculated as
follows:
1 . 1 0.0000 0.5 1.0000
0.2953 0.5 1.0000 0.6287,
2 . 2 0.0000 0.5 1.0000
0.2701 0.5 1.0000 0.6493,
K. Jangra et al. / International Journal of Industrial Engineering Computations 2 (2011) 487
Table 9
The deviation sequences
Deviation sequences ∆ (1) ∆ (2)
No. 1, i =1 0.2953 0.2701
No. 2, i =2 0.0151 0.6304
No. 3, i =3 0.2385 0.5697
No. 4, i =4 0.3011 0.1467
No. 5, i =5 0.0503 0.5107
No. 6, i =6 0.3094 0.5530
No. 7, i =7 0.3756 0.0208
No. 8, i =8 0.4429 0.2691
No. 9, i =9 0.0000 0.8768
No. 10, i =10 1.0000 0.0829
No. 11, i =11 0.4109 0.6252
No. 12, i =12 0.2866 1.0000
No. 13, i =13 0.6361 0.3221
No. 14, i =14 0.5941 0.6609
No. 15, i =15 0.3605 0.8096
No. 16, i =16 0.9339 0.0000
No. 17, i =17 0.3608 0.7337
No. 18, i =18 0.2636 0.8522
Similar procedure is applied for i = 1-18 and the results are summarized in Table 10.
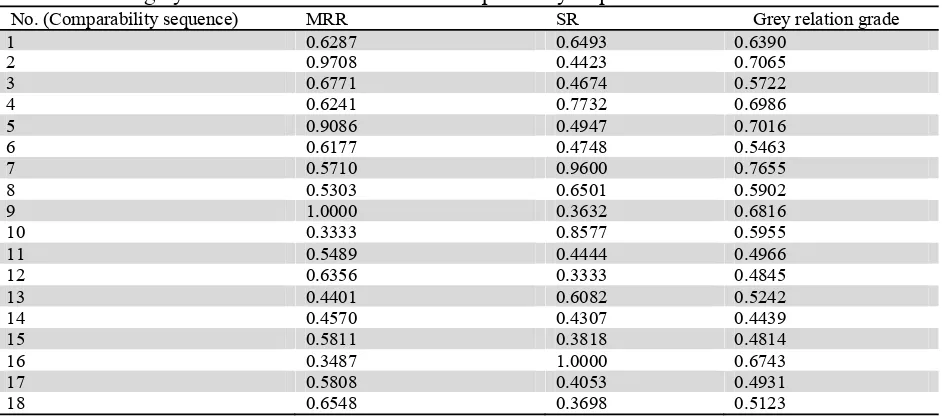
Table 10
The calculated grey relational coefficient for 18 comparability sequences
No. (Comparability sequence) MRR SR Grey relation grade
1 0.6287 0.6493 0.6390
2 0.9708 0.4423 0.7065
3 0.6771 0.4674 0.5722
4 0.6241 0.7732 0.6986
5 0.9086 0.4947 0.7016
6 0.6177 0.4748 0.5463
7 0.5710 0.9600 0.7655
8 0.5303 0.6501 0.5902
9 1.0000 0.3632 0.6816
10 0.3333 0.8577 0.5955
11 0.5489 0.4444 0.4966
12 0.6356 0.3333 0.4845
13 0.4401 0.6082 0.5242
14 0.4570 0.4307 0.4439
15 0.5811 0.3818 0.4814
16 0.3487 1.0000 0.6743
17 0.5808 0.4053 0.4931
18 0.6548 0.3698 0.5123
The grey relational grade is a weighting-sum of the grey relational coefficients. The overall evaluation of multiple performance characteristics is based on the grey relational grade and it is defined as follows,
. ∑ . (6)
where k represents the weighting value of the kth performance characteristics, and ∑ 1. Using the same weighting values of MRR and SR as were assigned in utility analysis (i.e.w1=w2=0.5), grey relational grade . is calculated as depicted in Table 10.
4.2 Optimal level of process parameters
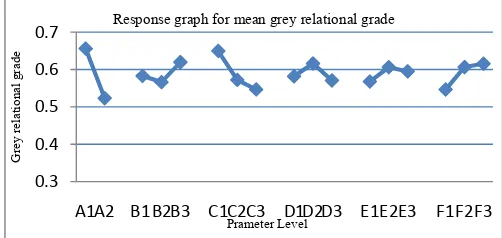
parameters setting of experiment no.7 has the highest grey relational grade. Thus, the seventh experiment gives the best multiple performance characteristics among the 18 experiments using GRA. To separate out the effect of each process variable on the grey relational grade at different levels, response graph for grey relational grade is constructed using the Taguchi methodology as shown in Fig. 4.
Fig. 4. Response graph for mean grey relational grade
Basically, the larger the grey relational grade, the better is the multiple performance characteristics. The combination of A1B3C1D2E2F3 shows larger value of the grey relational grade for the factors A, B, C, D, E and F, respectively. Therefore, A1(30), B3(120 ampere), C1(108µs),D2(40µs),E2(8N) and F3(10LM-1) is the optimal parameter combination for multi-machining characteristics.
4.3 Predicted optimal results
The optimal value of the machining characteristics has been predicted using the same procedure as discussed in previous section. ANOVA results given in Table 11 depict that the taper angle (A) and pulse-on time (C) are the most significant factors affecting the grade values under 95% confidence level (because p≤ 0.05), while dielectric flow rate (F) affects it under 90% confidence level. Therefore, only most significant process parameters i.e. A and C have been considered to predict the optimal values of machining characteristics using Eq. (3).
Table 11
ANOVA for grey relational grade
Source DF Sum of square Variance F p-value % contribution
A 1 0.07944 0.07944 47.22 0.00* 67.82 B 2 0.00901 0.00451 2.68 0.147 3.85 C 2 0.03462 0.01731 10.29 0.012* 14.77 D 2 0.00669 0.00334 1.99 0.218 2.85 E 2 0.00475 0.00237 1.41 0.314 2.02 F 2 0.01696 0.00848 5.04 0.052 7.24 Error 6 0.01009 0.00168 1.43 Total 17 0.16157
DF: degree of freedom; * Significant at 95% confidence level
The percentage error between experimental values and predicted values for MRR and SR using GRA are 2.2 and 0.35, respectively. Therefore, GRA process parameters can be successfully optimized for multiple machining characteristics during WEDM of WC-6%Co composite. Table 12 shows the predicted and experimental results for MRR and SR at a single optimal setting of process parameters using GRA.
Table 12
Predicted and confirmatory values of machining characteristics at single optimal setting
Machining
Characteristic Optimal parameters combination Predicted optimal value Experimentalvalue % error
MRR A1B3C1D2E2F3 1.76mm/min. 1.80mm/min. 2.2
SR A1B3C1D2E2F3 1.13µm 1.126µm 0.35
0.3 0.4 0.5 0.6 0.7
A1A2 B1 B2B3 C1C2C3 D1D2D3 E1E2E3 F1F2F3
G
rey
relational
grade
Prameter Level
K. Jangra et al. / International Journal of Industrial Engineering Computations 2 (2011) 489
5. Summary of results
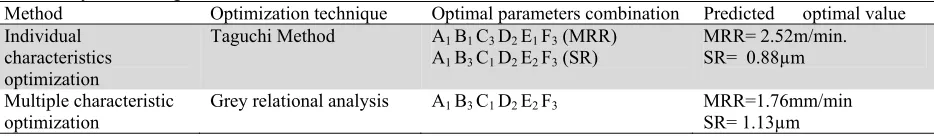
Using Taguchi method, process parameters were optimized individually for MRR and SR. The percentage error between experimental values and predicted results are less than 4% for both machining characteristics. Therefore, process parameters are successfully optimized for individual characteristics using Taguchi method. The optimal setting of process parameters for multiple machining characteristics, using GRA is A1 B3 C1 D2 E2 F3. Using ANOVA, two process parameters namely taper angle (A), pulse-on time (C) were found significant affecting the grey relational grade, significantly. The percentage error between experimental values and predicted values for MRR and SR using GRA are 2.2 and 0.35 respectively. Therefore, using GRA, process parameters can be successfully optimized for multiple machining characteristics during WEDM of WC-6%Co composite. Table 13 summarizes the results for individual and multiple machining characteristics.
Table 13
Summary and comparison of results
Method Optimization technique Optimal parameters combination Predicted optimal value
Individual characteristics optimization
Taguchi Method A1 B1 C3 D2 E1 F3 (MRR) A1 B3 C1 D2 E2 F3 (SR)
MRR= 2.52m/min. SR= 0.88µm
Multiple characteristic
optimization Grey relational analysis A1 B3 C1 D2 E2 F3 MRR=1.76mm/min SR= 1.13µm
6. Conclusions
In present work, wire electrical discharge machining (WEDM) for WC-Co composite has been studied. Grey relational analysis (GRA), along with Taguchi method were used to optimize the material removal rate (MRR) and surface roughness (SR), simultaneously. Based on the results and discussions, the following conclusions are made:
• Using Taguchi method, MRR and SR were optimized individually. Two different optimal settings
of process parameters were found for MRR and SR. The optimal predicted values for MRR and SR
are 2.52mm/min. and 0.88µm. Using ANOVA on experimental results, three process parameters
namely taper angle (A), pulse-on time (C) and pulse-off time (D) were found the most significant affecting the MRR and SR under 95% confidence level.
• In case of GRA, grey relational grade was used as a performance index to determine the optimal combination of process parameters for multiple machining characteristics. Equal weights were assigned to both the machining characteristics in calculating the grey relational grade. However, with a different set of weights, a different set of optimal parameters for machining characteristics will result. The optimal set predicted will be closer to the optimal set predicted for single characteristic with the largest weight.
• Using ANOVA, only two parameters namely taper angle (A) and pulse-on time (C) were affecting
the grey relational grade. The percentage error between experimental values and predicted values for MRR and SR using GRA are 2.2 and 0.35, respectively. Therefore, using GRA, process parameters can be successfully optimized for multiple machining characteristics during WEDM of WC-6%Co. The optimal combination of the process parameters, using GRA for multi-machining characteristics is set to A1 (30), B3 (120 ampere), C1 (108μs), D2 (40μs), E2 (8N) and F3 (10 LM-1). • GRA can be extended to more number of machining characteristics, provided accurate weights for
different characteristics to calculate grade values. Thus, the solutions from this method will be useful for tool manufacturer who are willing to search for an optimal solution of process parameters.
References
Çaydaş, U., Hasçalik, A. & Ekici, S. (2009). An adaptive neuro-fuzzy inference system (ANFIS) model for
wire-EDM. Expert Systems with Applications, 36, 6135-6139.
Chen, H. S., Lin, J. C., Yang, Y. K., & Tsai, C. H. (2010). Optimization of wire electrical discharge machining for
pure tungsten using a neural network integrated simulated annealing approach. Expert System and Application,
37, 7147-7153.
Deng, J. (1989). Introduction to grey system. Journal of Grey System, 1(1), 1-24.
Huang, J. T., & Liao, Y. S. (2003). Optimization of machining parameters of Wire-EDM based on Grey relational
and statistical analyses. International Journal of Production Research, 41(8), 1707 – 1720.
Jangra, K., Grover, S., Chan, F.T.S., & Aggarwal, A. (2011). Digraph and matrix method to evaluate the
machinability of tungsten carbide composite with wire EDM. International Journal of Advance Manufacturing
Technology, DOI: 10.1007/s00170-011-3234-5.
Kanagarajan, D., Karthikeyan, R., Palanikumar, K., & Paulo Davim, J. (2006). Optimization of electrical discharge machining characteristics of WC/Co composites uing non-dominated sorting genetic algorithm (NSGA-II).
International Journal of Advance Manufacturing Technology, 36(11-12), 1124-1132.
Kim, C. H., & Kruth, J. P. (2001). Influence of electrical conductivity of dielectrical fluid on WEDM of sintered
carbide. KSME International Journal, 15(12), 1276-1282.
Kim, H. C., Shon, I. J. & Munir, Z. A, (2005). Rapid sintering of ultra-fine WC-10% Co by high-frequency
induction heating. Journal of Material Science,40, 2849-2854.
Kung, K. Y., Horng, J. T., & Chiang, K. T. (2007). Material removal rate and electrode wear ratio study on the
powder mixed electrical discharge machining of cobalt-bonded tungsten carbide. International Journal of
Advance Manufacturing Technology, 40(5-8), 591-610.
Kucukturk, G., & Cogun, C. (2010). A new method for machining of electrically nonconductive workpieces using
electrical discharge machining technique. Machining Science and Technology, 14(2), 189-207.
Lauwers, B., Liu, W., & Eeraerts, W. (2006). Influence of the composition of WC-based cermets on
manufacturability by wire-EDM. Journal of Manufacturing process, 8(2), 83-89.
Lee, S. H., & Li, X. P. (2001). Study of the effect of machining parameters on the machining characteristics in
electrical discharge machining of tungsten carbide. Journal of Material Processing Technology, 115, 344-358.
Lee, S. H., & Li, X. P. (2003). Study of the surface integrity of the machined workpiece in the EDM of tungsten
carbide. Journal of Material Processing Technology, 139, 315-321.
Liu, K., Li, X. P., & Rahman, M. (2003). Characteristics of high speed micro cutting of tungsten carbide. Journal of
Material Processing Technology, 140, 352-357.
Lin, J. L., & Lin, C. L.(2002). The use of the orthogonal array with grey relational analysis to optimize the electrical
discharge machining process with multiple performance characteristics. International Journal of Machine Tool
& Manufacture, 42 (2), 237-244.
Li, C. H., Tsai, & M. J. (2009). Multi-objective optimization of laser cutting for flash memory modules with special
shapes using grey relational analysis. Optics & Laser Technology, 41, 634-642.
Lu, H. S., Chang, C. K., Hwang, N. C., & Chung, C. T. (2009). Grey relational analysis coupled with principle
component analysis for optimization design of the cutting parameters in high-speed end milling. Journal of
Material Processing Technology, 209, 3808-3817.
Mahdavinejad, R. A., & Mahdavinejad, A. (2005). ED machining of WC-Co. Journal of Material Processing
Technology, 162-163, 637-643.
Nath, C., Rahman, M., & Neo, K. S. (2009). A study on ultrasonic elliptical vibration cutting of tungsten carbide.
International Journal of Machine Tool & Manufacture, 49, 1089-1095.
Narender Singh, P., Raghukandan, K., & Pai, B.C.(2004).Optimization by grey relational analysis of EDM
parameters on machining Al-10% SiCp composite.Journal of Material Processing Technology, 155,1658-1661.
Pan, L. K., Wang, C. C., Wei, S. L., & Sher, H. F. (2007). Optimizing multiple quality characteristics via Taguchi
method based grey relational analysis. Journal of Material Processing Technology, 182, 107-116.
Phadke, S. M. (1989). Quality Enginerring Using Robust Design, Englewood Cliffs, NJ: Prentice Hall.
Puertas, I., Luis, C. J., & Alvarez, L. (2004). Analysis of the influence of EDM parameters on surface quality, MRR
and EW of WC-Co. Journal of Material Processing Technology, 153-154, 1026-1032.
Ross, P. J. (1996). Taguchi Techniques for Quality Engineering, McGraw-Hill, New York.
Roy, R. K. (2001). Design of Experiments using the Taguchi approach: 16 steps to Product and Process
Improvement, Wiley-Interscience, New York, 179-186.
Saha, P., Singha, A., & Pal, S. K. (2008). Soft computing models based prediction of cutting speed and surface
roughness in wire electro-discharge machining of tungsten carbide cobalt composite. International Journal of
Advance Manufacturing Technology, 39, 74-84.
Tarng, Y. S., Juang, S. C., & Chang, C. H. (2002). The use of grey based Taguchi methods to determine submerged
arc welding process parameters in hardfacing. Journal of Material Processing Technology, 128, 1-6.
Tzeng, C. J., Lin, Y. H., Yang, Y. K., & Jeng, M. C. (2009). Optimization of turning operations with multiple
performance characteristics using the Taguchi method and Grey relational analysis. Journal of Material