Telephone: +44 (0)1582 763133 Web: http://www.rothamsted.ac.uk/
Rothamsted Research is a Company Limited by Guarantee Registered Office: as above. Registered in England No. 2393175. Registered Charity No. 802038. VAT No. 197 4201 51. Founded in 1843 by John Bennet Lawes.
Rothamsted Repository Download
A - Papers appearing in refereed journals
Whalley, W. R., Binley, A., Watts, C. W., Shanahan, P., Dodd, I. C., Ober,
E. S., Ashton, R. W., Webster, C. P., White, R. P. and Hawkesford, M. J.
2017. Methods to estimate changes in soil water for phenotyping root
activity in the field. Plant and Soil. 415 (1-2), pp. 407-422.
The publisher's version can be accessed at:
•
https://dx.doi.org/10.1007/s11104-016-3161-1
The output can be accessed at:
https://repository.rothamsted.ac.uk/item/8v3vy/methods-to-estimate-changes-in-soil-water-for-phenotyping-root-activity-in-the-field
.
© 12 January 2017, CC-BY terms apply
METHODS PAPER
Methods to estimate changes in soil water for phenotyping root
activity in the field
W.R. Whalley&A. Binley&C.W. Watts&P. Shanahan& I.C. Dodd&E.S. Ober&R.W. Ashton&C.P. Webster& R.P. White&M. J. Hawkesford
Received: 31 August 2016 / Accepted: 20 December 2016 / Published online: 12 January 2017
#The Author(s) 2017. This article is published with open access at Springerlink.com
Abstract
Background and aims There is an urgent need to devel-op new high throughput approaches to phenotype roots in the field. Excavating roots to make direct measure-ments is labour intensive. An alternative to excavation is to measure soil drying profiles and to infer root activity.
Methods We grew 23 lines of wheat in 2013, 2014 and 2015. In each year we estimated soil water profiles with electrical resistance tomography (ERT), electromagnetic inductance (EMI), penetrometer measurements and measurements of soil water content. We determined the relationships between the measured variable and soil water content and matric potential.
Results We found that ERT and penetrometer measure-ments were closely related to soil matric potential and produced the best discrimination between wheat lines.
We found genotypic differences in depth of water uptake in soil water profiles and in the extent of surface drying.
Conclusions Penetrometer measurements can provide a reliable approach to comparing soil drying profiles by different wheat lines, and genotypic rankings are repeat-able across years. EMI, which is more sensitive to soil water content than matric potential, and is less effective in drier soils than the penetrometer or ERT, nevertheless can be used to rapidly screen large populations for differences in root activity.
Keywords Phenotyping . Roots . Soil water profiles . ERT . EMI . Penetrometer
Introduction
Two of the most important functions of the root systems in crop species are to acquire water and nutrients. Meister et al. (2014) note that the molecular tools to modify root architecture and function are available; however, they still found obstacles in developing im-proved crop ideotypes. Apart from uncertainty over the optimal combination of shoot and root traits, (Meister et al.2014) noted that there was a lack of technology for high throughput, non-invasive phenotyping of roots in the field. This applies to both root system architecture
and function. The ‘core-break’ method for wheat
(Rebetzke et al.2014; Wasson et al.2014; White et al.
2015) or the “shovelomics” approach for maize
(Trachsel et al.2011) provide methods for phenotyping root density or architecture in the field, but excavations
DOI 10.1007/s11104-016-3161-1
Responsible Editor: Hans Lambers.
Electronic supplementary material The online version of this article (doi:10.1007/s11104-016-3161-1) contains supplementary material, which is available to authorized users.
W. Whalley (*)
:
C. Watts:
R. Ashton:
C. Webster:
R. White:
M. J. HawkesfordRothamsted Research, Harpenden AL5 2JQ, UK e-mail: [email protected]
A. Binley
:
P. Shanahan:
I. DoddLancaster Environment Centre, Lancaster University, Lancaster LA1 4YQ, UK
E. Ober
remain labour intensive and time-consuming. An alter-native to excavating the root systems is to measure soil water content as a function of depth and infer root activity from those measurements. Indeed, root access to water deep in the soil profile by roots is positively correlated with higher yields (Ober et al.2015; Lopes and Reynolds2010). Soil moisture content can be accu-rately measured with buried sensors or with probes via access tubes installed in plots, but the cost and effort of instrumenting large experiments is prohibitive, especial-ly when the sensors are left in situ.
The aim of this study was to compare different methods for measuring soil water profiles that could accurately differentiate wheat cultivars, and which could be practically applied to a large number of experimental plots (on the order of several thousand for commercial breeding programmes). In our paper we focus on geo-physical approaches to subsurface investigation (Binley et al. 2015), which are usually used for mapping large land areas, and hence may be well suited to monitoring large experiments. However, the signal produced by these measurements depends on the resistivity of the soil, and thus indirectly relates to soil moisture content. Therefore, to provide a reference, we compared these measurements with direct measurements of soil water content with a neutron probe. An earlier paper described how the EMI method was initially tested and developed for root phe-notyping (Shanahan et al.2015). In addition, the extent of soil drying in surface layers was inferred from penetrom-eter measurements, based on the established relationship between soil matric potential and penetration resistance (Gao et al.2012,2016a,b). Both EMI and penetrometer measurements are rapid in comparison with soil coring, taking in the order of a few minutes (no more than 3 min) to collect data from an experimental plot. While soil coring produces direct assessments of rooting profiles, which is immensely valuable (e.g. White et al.2015), the speed of indirect estimation from soil water profiles is a clear advantage, moreover the two approaches may be used conjunctively to good effect.
Approaches to measure soil drying were compared in a field experiment of 23 different wheat lines over three consecutive years. From these data we concluded that the indirect assessment of root activity determined from soil water profiles is a promising approach that can give reliable and repeatable data that discriminate between wheat lines. However, the most appropriate approach depends on the extent of soil drying, which depends on the season and time of year. We critique different
methods of estimating soil water profiles beneath crops where the primary purpose is to make comparisons between genotypes.
Methods
The field experiments
The field sites
We used two experimental field sites: Warren Field (2013 and 2015) and the neighbouring Broadmead (2014), located in near Woburn, Bedfordshire, UK. The soils are described as a‘typical alluvial gley soil’ with a texture classification of silty clay loam soil (sim-ilar to FAO classification Fluvisol). Both sites are man-aged by Rothamsted Research and have a long-history under arable agriculture using the mouldboard plough as the primary tillage. In this experiment ‘first wheats’ were sown following at least one year of canola/ oilseed rape (Brassica napus) break crop. The surface layer (approximately 30 cm) has higher organic matter content and has a lower bulk density than deeper layers. In Warren field wheat roots take up water to a depth of approximately 1 m (Shanahan et al.2015).
In each year the experimental design was fully ran-domized complete block in four blocks. Each block contained 23 wheat lines and a fallow plot devoid of vegetation. Plot dimensions were 1.8 m wide and 7.0 m long, and plot ends were cut out to produce a 6 m length for combine harvest. Both sites had the same experimen-tal design but with a different randomization of geno-types. Sowing dates for the 2013 to 2015 harvest years were 01/03/13, 10/10/2013 and 26/9/14, respectively. The 2013 crop was sown late due to poor weather.
In each year, husbandry of the crops followed stan-dard agronomic protocols for the UK, with inputs to ensure adequate nutrition, weed, pest and disease con-trol. No irrigation was applied.
Plant material
Robigus), but feature heavily in the pedigrees of many current varieties. A subset of the lines which that showed genotypic differences in root activity was included from a previous study (Ober et al. 2015). A hybrid was also included, as some report that hybrids exhibit greater
rooting capacity (Bacon and Beyrouty 1987; Wang
et al.2006). The panel included two sets of isogenic lines to test the effect of Rht alleles on root activity, as the literature is not clear on how differentRhtalleles affect root growth and depth (e.g. Wojciechowski et al.2009; Miralles et al.1997). We compared the tall RhtC (Rht-B1a)and dwarfRht3(Rht-B1c) near isogenic lines, allelic at the Rht-B1 locus, in a Mercia background.
The instrumentation
Electrical resistance tomography (ERT)
ERT has been used to study the variation of soil electrical conductivity in the root zone (Srayeddin and Doussan
2009; Furman et al.2013). ERT is well suited for use in electrically resistive environments such as dry soil, pro-vided good electrical contact can be achieved between electrodes and soil. The disadvantage for agricultural applications is the requirement for galvanic contact be-tween electrical probes and the soil, resulting in a dis-turbed soil surface and extensive electrical cabling. The primary purpose of ERT in this work was to calibrate EMI measurements (Shanahan et al. 2015) rather than screen large numbers of genotypes. Calibration of EMI is needed because electromagnetic induction systems return only qualitative values for electrical conductivity because of instrument calibration difficulties (Lavoué et al.2010). This drawback can be overcome by adjusting EMI data to match the more reliable ERT measurements as described by (Shanahan et al.2015).
ERT measurements were made at both field sites on two of the four blocks. Fewer blocks were measured with ERT due to combinations of the cost of the arrays and time taken to make the measurements (approx. 1 h/array). These data were later used to assist with analysis of the EMI data (see below). We used four, 96-electrode arrays. Each array had electrodes measuring 0.1 m in length and 0.01 m diameter, inserted into the soil with 0.32 m separation, to give a 30.7 m long array. The arrays remained in position from just after crop emer-gence until just prior to harvest. A Syscal Pro electrical resistivity meter (Iris Instruments, Orleans, France) was used to measure apparent electrical resistivity,Raover a
dipole-dipole electrode configuration (see, for example, Binley2015). These data were checked for reciprocity of measurements (Parasnis1988) and then inverted to give a 2-D distribution of soil resistivity using the Occam’s based R2 (version 2.7a) ERT inverse code (Binley
2013). The resistivity was converted to conductivity data (σERT) and on each plot means were taken in the
hori-zontal direction to give a 1-dimensional (1-D) electrical conductivity profile, which could be used to calibrate EMI data (Shanahan et al. 2015) to make it consistent with resistivity profiles determined from ERT. Values of this profile are reported in units of ratio inversion ohm-meters.
Electromagnetic inductance
EMI measures apparent electrical conductivity, σa,
by inductive coupling (e.g., Mester et al. 2011),
without the need for contact with the soil surface. EMI is a quick and repeatable method that can be employed at the field and plot scale (Vereecken et al.
2014). The σa measured by EMI represents the
weighted average of soil electrical conductivity (σ)
over a depth range that depends on the separation
distance, s, between the transmitter and receiver
coils, as well as their orientation (McNeill 1980). Whensis increased the depth of soil contributing to the σa measurement increases (e.g., McNeill 1980;
Callegary et al.2007). Given a setσameasurements
obtained with different coil spacing and orientations, a 1-D vertical profile of soil conductivity can be estimated by inverse modelling (Mester et al. 2011; von Hebel et al. 2014).
We used a CMD Mini-Explorer (GF Instruments, Brno, Czech Republic) EMI instrument to make mea-surements of apparent electrical conductivity at three positions along the centre-line of the experimental plots. The instrument is 1.3 m long, and has a 30 kHz trans-mitter coil and three receiver coils at different spacing (s) from the transmitter (0.32 m, 0.71 m and 1.18 m). The probe can be rotated by 90° (about the long axis) to orientate the coils in a horizontal coplanar (HC) or a vertical coplanar (VC) position. The different coil spacing and orientation allow
mea-surements of σa to be made over six depths within
(McNeill 1980) for vertical coplanar orientation is given by:
CS zð Þ ¼ 4ð Þz=s 2þ1
1=2
−2ð Þz=s ð1Þ
and for horizontal coplanar orientation is given by:
CS zð Þ ¼ 4ð Þz=s2þ1
−1=2
ð2Þ
wheresis the coil separation andzis depth. Prior to the field campaign we developed a measure-ment protocol to minimize the effects of instrumeasure-ment drift over time (Shanahan et al.2015). On each measurement occasion the instrument was allowed to equilibrate to ambient temperatures for at least an hour. A single location at each site, away from the plots being moni-tored, was established as a“drift base”, where the probe could be returned periodically during each day to assess
for any instrument-drift (Corwin and Lesch 2005).
These assessments of instrument-drift were then used to adjust allσameasurements. A measurement period of
1.0 s providedσavalues with a reasonably low
variabil-ity (root mean square (RMS) error, typically <2% for most soil conditions). The probe was kept 1.5 m from any metallic items (e.g. electrical cables) to prevent interference. Measurements on all plots were made with one coil orientation, coils were rotated 90° and measure-ments were repeated.
To convert the six measured apparent conductivity (σa) values into an estimate of how electrical
conduc-tivity varies with depth it was necessary to use a refined inversion procedure (as detailed in the Appendix). Shanahan et al. (2015) established the utility of using the change in electrical conductivity with time to infer changes is soil water content. The variable derived from this procedure was termed‘conductivity from a differ-ence inversion’, and relates to soil drying. The new routine allows the inversion of the difference between two data sets measured at different times with the pur-pose of fitting the change in conductivity with depth to two sets ofσameasurements. Preliminary data showed
that soil moisture contents at ≥2 m depth remained stable over the course of a season. Therefore, when estimating the change in conductivity with depth be-tween two time points we used the a priori knowledge
that at a depth of 2 m there was no detectible soil drying (and therefore no change in conductivity). The different steps involved in converting apparent conductivity data measured at the plot with an EMI instrument (i.e. the six conductivity values that arise from the different three coil spacings and two orientations) into a conductivity change as a function of depth are summarised in Fig.1.
The penetrometer
The penetrometer is a rod tipped with a steel cone that is manually pushed down through the soil to obtain a relationship between the pressure at the base of the cone (penetrometer resistance) and depth (Bengough and Mullins1991). For this work we used a recording pen-etrometer (Solutions for Research, Silsoe, UK) fitted with a 30° cone with 9.45 mm base diameter on a 7.9 mm diameter shaft. The penetrometer has been widely used in soil science, but perhaps more commonly used to detect soil compaction (Campbell and O’Sullivan 1991). For the purpose of this work, the penetrometer was useful because penetrometer resis-tance is very sensitive to soil water status (Farrell and
Greacen 1966; To and Kay 2005; Gao et al. 2012,
2016b). Recently Gao et al. (2016b), proposed the fol-lowing relationship between penetrometer resistance,Q, and other soil properties,
Q¼ρ A*ðF−eÞ
2
1þe σ
p s−ψ
ψ ψae
b!f
0 @
1 A
2
ð3Þ
in relatively well-watered field conditions, whereρis the dry bulk density of soil in kN/m3,eis the void ratio,
σs is the net stress (kPa), ψ is matric potential (kPa)
andψaeis the matric potential at which air enters a drying
soil.F, A*, p, bandfare empirical adjustable parame-ters. Penetrometer resistance can be expected to be closely related to matric potential as well asσs, which
is a function of depth (Gao et al.2016a).
The neutron probe
reflectance have some important advantages. There is no need for a radioactive source and can be used for a wide range of soil types. In our experience the calibra-tions between dielectric properties and soil water content are more similar between different soil types than those between the count of thermalized neutrons and soil water content. More recently dielectric probes have been developed that can be inserted into access tubes, allowing measurements of soil water content to depth (e.g. Whalley et al.2006,2008). However, the performance of dielectric sensors inserted into access tubes depends on good contact between the tube and the soil. Whalley et al. (2004) found that the calibration of such dielectric probes depended on depth, implying that there was a systematic difference in tube-soil contact with depth from the sur-face. For this reason, we used the neutron moderation method in this work. Although this approach also uses an access tube to allow measurements of soil water at depth,
the instrument samples a much larger volume of soil than dielectric probes, detecting moisture in a radius of 0.15 m in wet soil and 0.5 m in very dry soil (Gardener et al.
1991). In soils that exhibit high shrinkage, Jarvis and Leeds-Harrison (1987) found that neutron probe mea-surements were affected by shrinkage of soil away from the access tube; however, the extent of the problem is considerably less than that reported for access-tube based dielectric probes (Whalley et al.2004).
Soil characterisation
Soil was collected from Warren field and electrical conductivity was measured in the laboratory on repacked samples in three cores 5.3 cm in diameter and 4 cm long. A four-electrode arrangement, with electrodes connected to a resistance meter (RM4, from Geoscan, Bradford, UK) was used to measure electrical Fig. 1 A flow chart to show the
conductivity. Volumetric water content was measured on a separate soil sample using a SM150 dielectric soil moisture sensor (Delta-T Devices Ltd., Cambridge, UK) connected to a logger device. All of the cores were placed in a pressure plate apparatus, and step changes in matric potential between −0.5 and −450 kPa were applied. Before the start of the calibration the soil sam-ples were saturated with 0.01 M NaCl and the water content and electrical conductivity were recorded at equilibrium water contents.
We took undisturbed cores (also 5.3 cm in diameter and 4 cm long) to measure the water release character-istic (Gregory et al.2010). On these samples we also measured the resistance to a needle penetrometer on the equilibrated samples (Gao et al.2012).
Field measurements
In 2013 we took soil samples to a depth of 1 m, followed by oven drying to estimate water content gravimetrically (Shanahan et al. 2015) on all plots of selected lines (Robigus, Hystar Hybrid, Xi19 and Rht-B1c) and at six time points (24–04-13, 13–05-13, 13–06-13, 20– 06-13, 27–06-13, 09–07-13). In 2014 we used a neutron probe to measure soil water content profiles to a depth of 1.45 m on all plots of Battallion, Robigus, Dover, Hybrid Hystar, Rht-B1a and Rht-B1c and at eight time points (19–0-14, 10–03-14, 02–04-14, 09–06-14, 10– 04-15, 19–06-14, 26–06-14, 04–07-14 & 17–07-14). In 2015 we used a neutron probe to measure soil water content profiles to a depth of 1.45 m on all plots of the 23 wheat lines and at 12 time points (22–01-15, 23– 01-15, 24–02-15, 25–02-15, 18–03-15, 19–03-15, 09– 04-15, 10,04,04-15, 16–04-15, 01–05-15, 08–06-15, 23– 06-15). The shift from gravimetric measurements of water content (2013) to the use of the neutron probe (503 Hydro probe, CPN, 5052 Commercial Circle, Concord, CA 94520) reflects the acquisi-tion of the instrument in 2014 and a second in-strument in 2015 to allow a greater number of plots to be measured.
At regular intervals during each season ERT and EMI was used to estimate the change in conductivity. In addition, soil temperature profiles were also measured with buried thermistors. The temperature data were used to correct conductivity data to a standard 25 °C to account for differences in temperature. Otherwise dif-ferences in either ERT or EMI data could simply reflect temperature differences. The correction rule is a 2% per
°C linear increase of the electrical conductivity of the soil with temperature using the following relationship;
σ25C¼σT=½1þ0:02ðT −25Þ; ð4Þ
withσTthe electrical conductivity at the temperature
T(degrees Celsius) andσ25°Cthe electrical conductivity
at 25 °C (see for example Michot et al.2003).
Penetrometer measurements were made during the season until the soil became too strong for the instru-ment to be used. However, in 2014 there was a more restricted set of penetrometer measurements due to lim-ited staff availability.
At harvest the grain and straw yields from each plot were measured with a plot combine and corrected to a standard 85% dry matter.
Statistical analysis
All experimental data were analysed with GenStat v16 (www.vsni.co.uk). In each of the experimental years (2013, 2014 and 2015) 23 lines of wheat and a follow plot were set out in a fully randomized complete block in four blocks. A different randomisation scheme was used in each year. The block structure, block/plots, was used for the statistical analyses with a treatment
structure of “wheat line” for yield and apparent
conductivity measurements and block/plots/depth was used with the treatment structure“wheat line*depth”for the penetrometer. Only conductivity data sets showing a statistically significant treatment effect were inverted to estimate conductivity depth profiles. Penetrometer data was analysed with REML (residual maximum likelihood), but these data required square root transformation to stabilize the variance with spline models to account for the profile with depth. For ease of comparison with other published data we plot penetrometer data on the natural scale and are unable to plot the standard error of differences (SED) which was obtained from the transformed data. In the case of ERT, splines were used to model the profile relation-ships between conductivity and depth obtained from the inversion procedure after they had been corrected for the effects of temperature. The fitted spline models were compared with REML. Unless stated otherwise we only discuss data as being statistically significant if
Results and discussion
Yield
There was significant genotypic variation in grain yields and total above-ground biomass on complementary ma-terial (data not shown) within each year when analysed by ANOVA (Fig. S1;P < 0.001). All yields in 2013 (sown in spring) were much smaller than in 2014 and 2015. In 2015, yields were consistently between 72 to 92% of the yields in 2014, with the exception of Hobbit and Rht-B1c (dwarf type) where the 2015 yields were greater than in 2014.
Relationships between soil properties
Laboratory analyses of soils sampled from the trial sites showed that electrical conductivity had a linear relation-ship with water content over the range considered (Fig.2). In contrast, there were curvilinear relationships between penetrometer resistance and electrical resis-tivity and soil water content. In drier soil there will be a much greater change in both penetrometer resistance and electrical resistivity for a given change in water content compared with the same increment in wet soil (Fig. 2). The relationship be-tween penetrometer resistance and matric potential is linear (Fig.3), assumingσs≈0, which is the case
for measurements in the laboratory. The water re-lease curve (the relationship between matric poten-tial and water content) is consistent with those pre-viously reported for the same soil (Fig. 3; Gregory et al. 2010). Although these data (Figs.2 and3) are from Warren field, the texture of Broadmead is similar and there is no reason to expect any differ-ence in the conclusions to be drawn from these two soils or indeed other soils with a relatively wide range of clay contents. Taken together, these results show that small changes in soil water content, in dry soil, can result in larger changes in soil matric potential and resistivity; therefore, measurements sensitive to matric potential would be best suited to detect changes in soil drying by roots at low soil water contents.
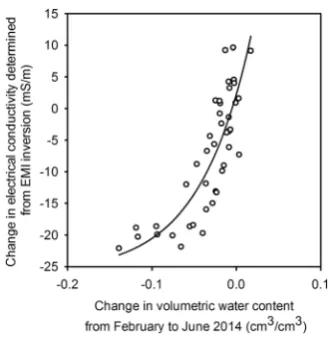
Figure 4 shows the change in electrical
conduc-tivity, from Broadmead field in 2014, at various depths, determined from inversion of the EMI data, plotted against the respective change in water con-tent determined with a neutron probe. This relation-ship is non-linear, but this is mainly due to a
relative small data set from the driest soil. This example illustrates that even in dry soil, EMI can detect changes in soil moisture content, but EMI measurements are most sensitive (the steeper sec-tion of the curve) in soils that have not dried extensively.
Soil drying
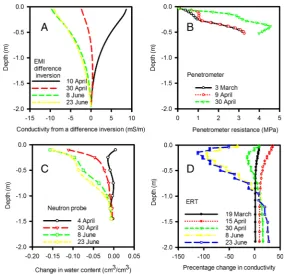
In all three seasons there was significant soil drying with depth and time, consistent with increased root activity as crop evapotranspiration increased from spring into sum-mer (Fig. S2). In Fig.5we show the progressive patterns of inferred soil drying over time for 2015 for each measurement technique. ERT, EMI and neutron probe measurements showed large changes in soil moisture during April, but relatively smaller changes through June. This could reflect rapid depletion of soil moisture by plants earlier in the season compared with later when soils were already relatively dry. Alternatively, as neg-ligible amounts of rainfall were received between 8 and 23 June 2015, that could have masked removal of soil water by roots, the results may indicate that it was more difficult to detect changes in soil moisture content in
soils of low moisture content at that time of year. If so, this implies that genotypic effects could be best exam-ined by comparing the relative shifts in patterns of soil characteristics over time between different genotypes rather than relying on the interpretation of differences at one time-point. Similar data were obtained in both 2013 and 2014, except that in 2015 we had a complete set of data from the neutron probe. The greatest differ-ence between 2014 and 2015 was the duration of net soil drying (Fig. S2), which was shorter in 2015 (3 months) than 2014 (5 months). These data are consistent with the differences in rainfall patterns between the two years.
Although the inversion models used to interpret ERT and EMI data provided data to a depth of 2 m, negligible soil drying was observed at depths greater than 1 m during any of the three seasons. In all three seasons we used the penetrometer when the soil was sufficiently weak. In 2015 the manual penetrometer measurements could not be made later than 30 April because as the soil dried it became too strong (Fig.5). During April 2015, differences in drying of upper soil layers was more apparent from penetrometer measurements than the neu-tron probe (Fig.5). The large increases in penetrometer resistance associated with relatively small amounts of soil drying is consistent with previously published data (Whalley et al.2006). However, becauseσs is
propor-tional to depth (Eq.3; Gao et al.2016b; Skempton1987) Fig. 3 Penetrometer resistance (A) and soil water content (B)
plotted against matric potential. Data are from laboratory measure-ments of soils collected from Woburn field. Symbols represent the mean ± se (n= 3)
increases in penetrometer resistance in the near surface layers (<10 cm) are small.
Differences between wheat lines
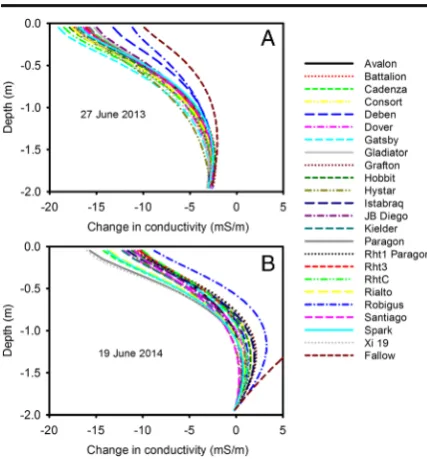
In 2013 and 2014, residual maximum likelihood (REML) analysis showed significant effects (P< 0.001) of soil drying on the six apparent conduc-tivities (corresponding to the three different coil spacing and two orientations), measured with EMI, between the different wheat lines (Fig. 6). However, in 2015 we found no significant effects of genotype on those appar-ent conductivities measured with EMI. This implied that in 2015 the soil water content profiles of all the wheats were similar, which was supported by neutron probe data (data not shown). Thus in 2013 and 2014 there were sufficient periods of soil drying that allowed dif-ferentiation of the genotypes using EMI (Fig. S2), and
these apparent conductivity data were inverted relative to a reference date (Fig.6). In 2013 there was a better separation of the wheat lines which was consistent with the much drier contions in the spring of 2013 (Fig. S2). The shape of the drying curves reflects the general distribution of root biomass in a soil profile, with most root activity occurring in the upper 50 cm (White et al.
2015). Most differences in absolute terms were small, indicating that the EMI method was able to discern relatively subtle genotypic differences in soil moisture extraction. This is important because within elite germ-plasm in breeding programmes, the genotypic differ-ences in root activity over depth are expected to be small, but potentially important for crop performance (Kirkegaard et al.2007).
Interestingly, the hybrid wheat line did not show noticeably different patterns of soil drying than most other lines, and in these experiments grain yield was Fig. 5 These data were collected in 2015 on Warren field. The
effect of temporal patterns in soil drying with depth on data determined from the inversion of ERT (D) and EMI (A) data, penetrometer measurements (B) and neutron probe (C) measure-ments is shown. EMI and ERT data are obtained from the inver-sion routine that provides a continuous distribution over depth. We only applied the EMI inversion routine to data sets when the six measured apparent conductivities were significantly different. In 2015 these data were not significantly different and EMI data
represent the inversion applied to the average apparent conductiv-ities, taken across all the wheat genotypes. Neutron probe data also showed that there was no significant difference in water profile between wheat genotypes and again the data plotted is the average for all wheats. The penetrometer data are replotted from Gao et al.
also similar to others (Fig. S1). The effect of different dwarfing alleles also did not result in any distinctive soil drying patterns as detected using EMI. The patterns in Fig. 6 show that soils in plots of Robigus were more conductive (i.e. a smaller reduction in conductivity com-pared with the reference date) than others, indicating smaller volumes of water extraction. In these experi-ments, this genotypic effect is probably explained large-ly by poor resistance of Robigus to yellow rust (Puccinia striiformis), as disease pressure was high in 2013 and 2014, and hence a smaller active canopy, rather than an effect of the 1-R/S wheat-rye translocation in Robigus, which has been studied previously in terms of root growth (Sharma et al.2009). Nevertheless, what-ever above-ground processes lead to changes in soil moisture extraction by root systems, any reliable meth-od for field phenotyping roots should be able to detect it. Figure7shows the penetrometer data for all three growth seasons. In 2014 the discrimination between the wheat lines was smaller than for either 2013 or 2015. This was because in 2014 the soil profile
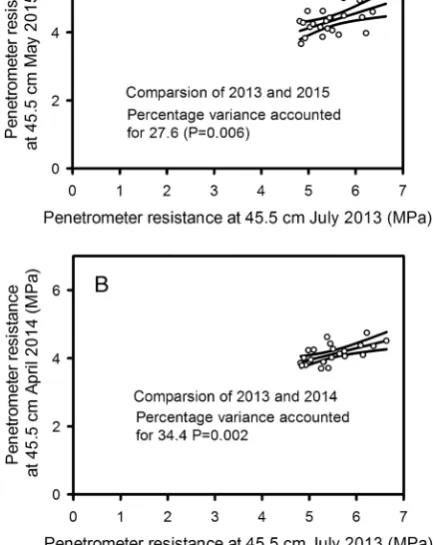
remained wet until early April when it dried over a relatively short period of time (Fig. S2), and then became too strong for the penetrometer to be used. Penetrometer data were analysed with REML and the interactions between depth and genotype shown in Fig. 7 are all significant at P < 0.001. The pen-etrometer data showed significant genotypic effects in all three years, implying that some wheat lines where more effective at drying soil than others. Furthermore, genotypic rankings for drying at 0.45 m depth were consistent between years (Fig. 8, Table S2). Penetrometer data confirmed the observation made from EMI measurements, that the hybrid wheat did not have a distinctive soil drying pattern. Furthermore, the effect of different dwarfing alleles did not seem to result in distinctive soil drying profiles.
In all three years the ERT resistivity data showed significant genotypic effects, but were lim-ited in power because we were able to make measurements in only two of the four blocks. A significant advantage of ERT measurements is that
they produce a 2-D map of soil drying (Fig. 9),
whereas all the other approaches we have consid-ered are 1-D. ERT is also amenable for use in dry soil, whereas the penetrometer is very sensitive to early soil drying by the roots, but becomes less effective when soils become too strong.
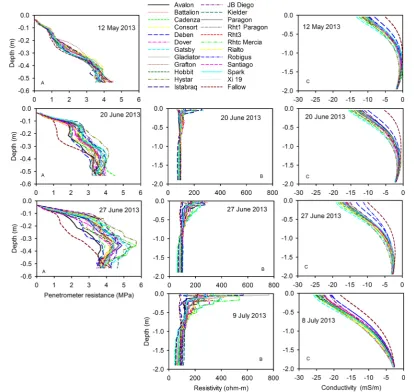
The soil profiles determined with ERT, EMI and penetrometer measurements were compared to look for consistency, and which method provided the best ability to discriminate genotypes (Fig.10). Data for 2013 are shown because this year had the longest set of compar-ative data that also showed significant genotype effects with all three methods.
The different sensitivities of ERT, EMI and the pen-etrometer measurements to soil water content make direct methodological comparisons difficult. Data from the 20 June 2013 (Fig.10) show penetrometer measure-ments have the greatest sensitivity to soil drying. On that date there was very little difference between in ERT or EMI data for the different wheat lines, while the pene-trometer detected large and significant genotypic differ-ences. On 27 June some wheat lines (Avalon, Battalion, Deben, Cadenza) did not show any detectable soil dry-ing at 50 cm, whereas other lines (Kielder, Xi19, RhtC) appeared to have dried the soil beyond that depth. On the 27 June, penetrometer data and ERT data at a depth of 32 cm gave a consistent genotypic ranking of soil Fig. 6 Change in electrical conductivity, determined from inversion
drying (Spearman’s rank correlation; P = 0.017). However, the choice of which depth to make the com-parison was somewhat arbitrary. At a depth of 50 cm penetrometer data did discriminate well between wheat lines, whereas ERT data did not, at this depth. EMI measurements were adjusted using ERT as a standard measurement (Shanahan et al.2015), so the agreement between these two methods is inevitably good. By 9 July it was no longer possible to push the penetrometer into the dry soil, which was confirmed by ERT data showing that the soil had dried further from 27 June. Comparison of the EMI and ERT data in July, 2013 (Fig.10) shows that ERT allowed greater discrimination between wheat lines (i.e. the range of resistivity values at a given depth is large) compared with EMI (where there is a small spread in conductivity data). Both ap-proaches (EMI and ERT) showed statistically significant differences between the wheat lines. The greater sensi-tivity of ERT (and penetrometer resistance) compared with EMI, was observed more acutely in 2015 where only ERT and penetrometer measurements could detect differences between the wheat lines.
Critique of the methods
Two basic descriptions of water in soils are the volumetric soil water content and matric potential, which are related to each other by the water
re-lease characteristic (Fig. 3). However, the water
release characteristic is highly non-linear: small changes in soil water content can correspond to large changes in matric potential. Measurements of matric potential may provide a more sensitive ap-proach to discriminating between the root activity of different wheat lines than measurements of soil water content. In 2015, we found no genotypic differences in soil water content profiles estimated with a neutron probe, nor with EMI-derived con-ductivity profiles; since concon-ductivity is linearly related to soil water content (Fig. 2). Both neutron probe and EMI measurements showed similar tem-poral patterns of soil drying with depth in 2015 (Fig. 5). In contrast, in 2015 we did find signifi-cant genotypic differences in penetrometer profiles (Fig. 7), which are more closely related to matric Fig. 7 Penetrometer profiles for
potential than water content (Fig. 3; Whalley et al.
2005; Gao et al. 2012, 2016b). The effects of soil
depth and soil drying both affect penetrometer resistance, thus the comparisons are simply quali-tative. However, the progression of soil drying with depth and over time is clearly visible in the penetrometer data (Fig. 5). The greater sensitivity of penetrometer (and ERT) measurements at dis-criminating between different wheat lines in 2015 is almost certainly because the soil had been dried to near a residual water content; where small dif-ferences in water content (detected by the neutron probe or EMI) correspond to large differences in matric potential, which can be resolved with either penetrometer or ERT measurements. An important finding is that penetrometer measurements revealed a consistent root phenotype across years of soil drying at depth (Fig. 8).
Electrical resistance tomography (ERT) over-comes important limitations of the penetrometer: namely the limited depth and time window before soils harden excessively, preventing measurements. The inversion of ERT data provides soil drying information, in our case, to a depth of 2 m. An advantage of ERT is that it provides a 2-D image of electrical resistivity, which can also be used in the form of a time-lapse image (Fig. 9). As in the case of the penetrometer the relationship between the measured variable in ERT (resistivity) is non-linear with water content (Fig.2), which makes them both sensitive in dry soils. A limitation of EMI is that it senses electrical conductors and thus is unable to differentiate between very dry (very resistive) and Fig. 8 A comparison of penetrometer resistance data at 45.5 cm
depth in 2013 with comparable data in 2015 (A) and 2014 (B). Symbols represent the mean for each genotype. The data is sup-plied as supplementary information
Fig. 9 Time lapse images created from inversion of ERT data collected in 2013 from one of the 30 m transects at Warren field. Date format is dd/mm/yyyy. The reference date for the inversion was 23rd April 2013 and the different colours indicate changes in
dry (resistive) soil states. Similarly, in dry soil, mea-surements of water content made with the neutron probes are not accurate enough to estimate the asso-ciated larger changes in matric potential (see Fig.3). Measurements of soil water that are sensitive to matric potential provided the greatest discrimination between the different wheat genotypes we studied. Indeed, this is entirely consistent with the well under-stood role of water potential gradients as the driver for root water uptake (Tinker and Nye2000). In this work we show that penetrometer resistance and ERT measure-ments are more effective than EMI or the neutron probe at detecting differences in matric potential and hence
genotypic differences in root activity. However, in early stages of soil drying when soil water content is relatively high, EMI is also effective in discriminating genotypic differences in root activity.
Conclusion
This study shows for the first time how EMI, nor-mally used to map soil conductivity over large areas, can be used effectively to quantify genotypic differ-ences in root activity. Our data suggest the indirect phenotyping of roots by measuring soil water Fig. 10 A comparison of depth profiles determined from (B) ERT
(resistivity), (C) EMI (conductivity) and (A) penetrometer mea-surements in 2013. The dates are indicated on the plots. In this panel B a resistivity of 100Ω-m indicates that there has been no
is likely to be more effective if the measurement method is related to the matric potential of soil water. Of the methods we have explored in this paper, ERT and penetrometer measurements satisfy this requirement. However, ERT is not amenable to high throughput, and penetrometer measurements are best used in less dry soils and for estimating root activity in upper soil layers. We present evi-dence that genotypic rankings based on root pheno-types determined from the measurement of soil dry-ing profiles are consistent across years.
Acknowledgements This study was funded by the BBSRC Crop Improvement Research Club as part of project BB/ J01950X/1 and BB/J019461/1. The authors would like to thank Stephen Goward and staff of Woburn Farm of Rothamsted Research. We thank Dr. Andrew Phillips for advice on the comparison of NILs used in this study. WRW, CWW, RWA, CPW and MJH are funded by the 20:20® Wheat project at Rothamsted Research. We further acknowl-edge the following companies for supplying seed for some of the wheat cultivars used: RAGT Ltd., Saaten-Union (UK) Ltd., Limagrain UK Ltd. and KWS UK Ltd. We thank Velcourt Ltd. and Professor Simon Bright for constructive advice throughout this project. WRW, AB, CWW, ICD, ESO and MJH planned and designed the research and wrote the paper, CWW, PS, CPW, RWA and WRW performed the experiments and conducted field work, AB analysed the geo-physical data, RPW performed the statistical analysis. We thank the anonymous reveiwers for constructive comments which improved this paper.
Appendix. Inversion of changes in EMI data
Measurements of apparent conductivity (σa) can be
made in vertical and horizontal coplanar mode, each of which has a different depth sensitivity function, as shown in eq. (1) and (2). The depth of investigation can be altered in each of the two modes by changing the coil spacing s. The CMD Mini-Explorer used in this work allows three coil spacings and thus a total of six measurements are possible at a given location. These data may be analysed using an inverse model to deter-mine a profile of electrical conductivity with depth that is consistent with the observed apparent conductivity. Given that we are interested in changes in conductivity (reflecting changes in soil water content), an approach was developed to invert the changes in apparent con-ductivity between two dates.
We represent the subsurface, at a given time as a one-dimension profile of electrical conductivity, discretised
into cells:σii = 1,2,…M, where M is the number of
cells. Adopting the cumulative sensitivity function (see eqs. (1) and (2), we can state:
σa¼ ∑ M
i¼1σi
CS zð i−1Þ−CS zð Þi
ð Þ ðA1Þ
where ziis the depth to the centre of cell i and z0= 0.
If we consider the change in apparent conductivity (Δσa) between two dates, for a given coil spacing and
coil orientation, we can write:
Δσa¼ ∑ M
i¼1
ΔσiðCS zði−1Þ−CS zð Þi Þ ðA2Þ
whereΔσiis the change in conductivity in cell i.
We wish to determine the profile of valuesΔσithat
minimises the difference between the six observed dif-ferences in apparent conductivity.
Simplifying notation for what follows, we can write our observed changes in apparent conductivity as di,
i= 1,2,..,6; the set of parameters (change in conductivity for each cell) that we wish to determine asmi,i= 1,2,…
M; and a forward model operator (eq. (A2)) as fi,
i= 1,2,..,6. We can then write an objective function to be minimised, in a weighted least squares sense, as:
Ψ¼ ∑6
i¼1
di−fið Þm
εi 0 @ 1 A 2
ðA3Þ
whereεiis error in observation i.
To avoid an undetermined inverse problem and to ensure a smooth profile of changes in conductivity (consistent with expected behaviour) we can revise our objective function to incorporate a spatial regularisation term:
Ψ¼ ∑6
i¼1
di−fið Þm
εi 0 @ 1 A 2
þαM∑−1
i¼1
miþ1−mi
ð Þ2 ð
A4Þ
where αis a scalar that weights the regularisation against the data misfit.
Minimising the objective function in eq. (A4) leads to the set of equations:
JTWTWJþαR
m¼JTðd−fÞ ðA5Þ
i= 1,2,…,6 andj= 1,2,…,M; Wi= (1/εi),Ris a roughness
matrix that is defined in such a way to represent the right had side of eq. (A4).
Using eq. (A2) we can write the jacobian terms in eq. (A5) as:
∂Δσa;i
∂Δσj ¼
CS zj−1
−CS zj ðA6Þ
where the cumulative sensitivity functionCS is se-lected to represent the appropriate coil separation and orientation for measurement i.
Open AccessThis article is distributed under the terms of the Creative Commons Attribution 4.0 International License (http:// creativecommons.org/licenses/by/4.0/), which permits unrestrict-ed use, distribution, and reproduction in any munrestrict-edium, providunrestrict-ed you give appropriate credit to the original author(s) and the source, provide a link to the Creative Commons license, and indicate if changes were made.
References
Bacon RK, Beyrouty CA (1987) Seedling root and shoot growth of a commercial wheat hybrid and its parents. Cereal Res Com 15:237–240
Bengough AG, Mullins CE (1991) Penetrometer resistance, root penetration resistance and root elongation rate in two sandy loam soils. Plant Soil 131:59–66
B i n l e y A ( 2 0 1 3 ) R 2 2 . 7 a , h t t p : / / w w w. e s . l a n c s . a c . uk/people/amb/Freeware/R2/R2.htm
Binley A (2015) Tools and techniques: electrical methods. In: Schubert G (ed) Treatise on geophysics, vol 11, 2nd edn. Elsevier, Oxford, pp 233–259
Binley A, Hubbard SS, Huisman JA, Revil A, Robinson DA, Singha K, Slater LD (201 5) The e mergence o f hydrogeophysics for improved understanding of subsurface processes over multiple scales. Water Resour Res 51:3837– 3866. doi:10.1002/2015WR017016
Callegary JB, Ferré TPA, Groom RW (2007) Vertical spatial sensitivity and exploration depth of low-induction-number electromagnetic-induction instruments. Vadose Zone J 6: 158–167. doi:10.2136/vzj2006.0120
Campbell DJ, O’Sullivan F (1991) The cone penetrometer in relation to trafficability, compaction and tillage. In: Smith KA, Mullins CE (eds) Soil analysis: physical mehtods. Marcel Dekker, New York, pp 399–429
Corwin DL, Lesch SM (2005) Apparent soil electrical conductiv-ity measurements in agriculture. Computers Electronics Agric 46:11–43. doi:10.1016/j.compag.2004.10.005
Farrell DA, Greacen EL (1966) Resistance to penetration of fine probes in compressible soil Aus. J Soil R4:1–17
Furman A, Arnon-Zur A, Assouline S (2013) Electrical resistivity tomography of the root zone. In: Anderson SH, Hopmans JW (eds) Soil–water–root processes: advances in tomography
and imaging. SSSA Special Publication, Madison, pp 221– 242. doi:10.2136/sssaspecpub61.c11
Gao W, Watts CW, Ren T, Whalley WR (2012) The effects of compaction and soil drying on penetrometer resistance. SoilTillage Res 125:14–22
Gao W, Hodgkinson L, Jin K, Watts CW, Ashton RW, Shen J, Ren T, Dodd IC, Binley A, Phillips AL, Hedden P, Hawkesford MJ, Whalley WR (2016a) Deep roots and soil structure. Plant Cell Environ 39:1662–1668
Gao W, Whalley WR, Tian Z, Liu J, Ren T (2016b) A simple model to predict soil penetrometer resistance as a function of density, drying and depth in the field. Soil Tillage Res 155: 190–198
Gardener CMK, Bell PP, Cooper JD, Dean TJ, Hodnett MG (1991) Soil water content. In: Smith KA, Mullins CE (eds) Soil analysis: physical mehtods. Marcel Dekker, New York, pp 1–73
Gregory AS, Bird NRA, Whalley WR, Matthews GP, Young IM (2010) Deformation and shrinkage effects on the soil water release characteristic. Soil Sci Soc Am J 74:1104–1112 Jarvis NJ, Leeds-Harrison PB (1987) Some problems associated
with the use of neutron probe in swelling shrinking clay soils. JSoil Sci 38:149–156
Kirkegaard JA, Lilley JM, Howe GN, Graham JM (2007) Impact of subsoil water use on wheat yield. Aus JAgr Res 58:303– 315
Lavoué F, van der Kruk J, Rings J, André F, Moghadas D, Huisman JA, Lambot S, Weihermüller L, Vanderborght J, Vereecken H (2010) Electromagnetic induction calibration using apparent electrical conductivity modelling based on electrical resistivity tomography. Near Surface GeoPhys 8: 553–561
Lopes MS, Reynolds MP (2010) Partitioning of assimilates to deeper roots is associated with cooler canopies and increased yield under drought in wheat. Functional Plant Biol 37:147– 156. doi:10.1071/FP09121
McNeill DJ (1980) Electromagnetic terrain conductivity measure-ment at low induction numbers. Technical Note TN-6, Geonics Ltd., Ontario
Meister R, Rajani MS, Ruzicka D, Schachtman DP (2014) Challenges of modifying root traits in crops for agriculture. Trends Plant Sci 19:779–788
Mester A, van der Kruk J, Zimmermann E, Vereecken H (2011) Quantitative two-layer conductivity inversion of multi-configuration electromagnetic induction measurements. Vadose Zone J 10:1319. doi:10.2136/vzj2011.0035
Michot D, Benderitter Y, Dorigny A, Nicoullaud B, King D, Tabbagh A (2003) Spatial and temporal monitoring of soil water content with an irrigated corn crop cover using surface electrical resistivity tomography. Water Resour Res 39:1138– 1157. doi:10.1029/2002wr001581
Miralles DJ, Slafer GA, Lynch JV (1997) Rooting patterns in near-isogenic lines of spring wheat for dwarfism. Plant Soil 197: 79–86
Ober ES, Werner P, Flatman E, Angus WJ, Jack P, Dimth-Reeve L, Tapsell C (2015) Genotypic differences in deep water extrac-tion associated with drought tolerance in wheat. Funcextrac-tional Plant Biol 41:1078–1086
Rebetzke GJ, Kirkegaard JA, Christopher J, Richards RA, Watt M (2014) Soil coring at multiple field environments can directly quantify variation in deep root traits to select wheat geno-types for breeding. JExp Bot 65:6231–6249
Shanahan P, Binley A, Whalley WR, Watts CW (2015) The use of electromagnetic induction (EMI) to monitor changes in soil moisture profiles beneath different wheat cultivars. Soil Sci SocAm J 79:459–466
Sharma S, Bhat P, Ehdaie B, Close T, Lukaszewski A, Waines J (2009) Integrated genetic map and genetic analysis of a region associated with root traits on the short arm of rye chromosome 1 in bread wheat. TAG Theor Appl Genetics 119:783–793
Skempton AW (1987) (standard) penetration test procedures and the effects in sands of overburden pressure, relative density, particle size, aging and overconsolidation. Geotechnique 37: 411–412
Srayeddin I, Doussan C (2009) Estimation of the spatial variability of root water uptake of maize and sorghum at the field scale by electrical resistivity tomography. Plant Soil 319:185–207. doi:10.1007/s11104-008-9860-5
Tinker PB, Nye PH (2000) Solute movement in the rhizosphere. Oxford University Press, New York
To J, Kay BD (2005) Variation in penetrometer resistance with soil properties: the contribution of effective stress and implica-tions for pedotransfer funcimplica-tions. Geoderma 126:161–276 Trachsel S, Kaeppler SM, Brown KM, Lynch JM (2011)
Shovelomics: high throughput phenotyping of maize (Zea maysL.) root architecture in the field. Plant Soil 341:75–87 Vereecken H, Huisman JA, Pachepsky Y, Montzka C, van der Kruk J, Bogena H, Weihermüller L, Herbst M, Martinez G, Vanderborght J (2014) On the spatio-temporal dynamics of soil moisture at the field scale. J Hydrol 516:76–96. doi:10.1016/j.jhydrol.2013.11.061
von Hebel C, Rudolph S, Mester A, Huisman JA, Kumbhar P, Vereecken H, van der Kruk J (2014) Three-dimensional imaging of subsurface structural patterns using quantitative large-scale multiconfiguration electromagnetic induction da-ta. Water Resour Res 50:2732–2748. doi:10.1002/2013 wr014864
Wang Z, Ni Z, Wu H, Nie X, Sun Q (2006) Heterosis in root development and differential gene expression between hy-brids and their parental inbreds in wheat (Triticum aestivum
L.). TAG Theor Appl Genetics 113:1283–1294
Wasson AP, Rebetzke GJ, Kirkegaard JA, Christopher J, Richards RA, Watt M (2014) Soil coring at multiple field environ-ments can directly quantify variation in deep root traits to select wheat genotypes for breeding. JExp Bot 65:6231– 6249
Whalley WR, Cope RE, Nicholl CJ, Whitmore AP (2004) In-field calibration of a dielectric soil moisture meter designed for use in an access tube. Soil Use Manag 20:203–206
Whalley WR, Leeds-Harrison PB, Clark LJ, Gowing DJG (2005) The use of effective stress to predict the penetrometer resis-tance of unsaturated agricultural soils. Soil Tillage Res 84: 18–27
Whalley WR, Clark LJ, Gowing DJG, Cope RE, Lodge RJ, Leeds-Harrison PB (2006) Does soil strength play a role in wheat yield losses caused by soil drying? Plant Soil 280:279–290 Whalley WR, Watts CW, Gregory AS, Mooney SJ, Clark LJ,
Whitmore AP (2008) The effect of soil strength on the yield of wheat. Plant Soil 306:237–247
White CA, Sylvester-Bradley R, Berry PM (2015) Root length densities of UK wheat and oilseed rape crops with implica-tion for water capture and yield. JExp Bot. doi:10.1093 /jxb/erv077