www.ijper.org DOI: 10.5530/ijper.53.3s.109
Correspondence:
Mr. Rajesh Kumar Chawla,
K. L. College of Pharmacy, K. L. University, Vaddeswaram, Guntur-522502, Andhra Pradesh, INDIA. Phone: +91 8074836561 E-mail: rbchawla07@gmail. com
Submission Date: 15-12-2018;
Revision Date: 06-02-2019;
Accepted Date: 27-03-2019
ABSTRACT
Objective: A simple, accurate and economical method has been developed by Reverse Phase High Performance Liquid Chromatography (RP-HPLC) using indirect UV (Ultra Violet) method. The Principle behind the indirect UV method was applied; the copper sulfate pentahydrate with UV absorption in the mobile phase was replaced with calcium ions without UV absorption, resulting in a reduction in UV absorption of the mobile phase. Materials and Methods: Method development was carried out on strong cation exchanger column (Zorbax 300-SCX, 4.6 mm i.d. x 150 mm, particle size 5 μm). The mobile phase consists of 4 mM copper sulfate pentahydrate solution at a flow rate of 2.0 mL per min. Indirect UV detection was performed at 230.0 nm. Results: Retention time for calcium was found about 7.1 min. The developed method was validated in terms of specificity, linearity, accuracy, precision, range, limit of detection, limit of quantification and robustness. Calibration plot was linear over the concentration range of 19 to 1125 μg/mL. System suitability parameters were found 0.8 % RSD, tailing factor 1.1 and more than 8000 theoretical plates. Limit of detection and limit of quantification were found 6.3 μg/mL and 19.0 μg/mL respectively. Conclusion: The high recovery and low relative standard deviation confirm the suitability of the method for determination of calcium acetate in calcium acetate capsules.
Key words: Calcium Acetate, RP-HPLC, Indirect UV method, Chromophore, Validation.
Method Development and Validation for Quantitative
Estimation of Calcium Acetate in Calcium Acetate
Capsules by RP-HPLC using Indirect UV Method
Rajesh Kumar Chawla*, Subhranshu Panda, Kulandaivelu Umasankar, Siva Prasad Panda, Dalu Damayanthi
K. L. College of Pharmacy, K. L. University, Vaddeswaram, Guntur, Andhra Pradesh, INDIA.
INTRODUCTION
Calcium acetate (Figure 1) is a calcium salt of acetic acid. Its standard name is calcium acetate and calcium ethanolate is the sys-tematic name. Its anhydrous form is hygro-scopic in nature.1 Calcium acetate is used
to prevent high blood phosphate levels (called hyperphosphatemia) in patients who are on dialysis due to severe kidney disease. Dialysis removes some phosphate from the blood, but it is difficult to remove enough to keep the phosphate levels bal-anced. Decreasing blood phosphate levels can help keep the bones strong, prevent unsafe buildup of minerals in the body and possibly decrease the risk of heart disease and strokes that can result from high phosphate levels. Calcium acetate is a
natural mineral that works by holding onto phosphate from the diet so that it can pass out of the body.2
Calcium acetate structure does not have any chro-mophore, hence it does not shows any absorbance in UV-Visible range. The literature survey revealed that calcium acetate assay in active pharmaceutical ingredi-ent and tablets has been reported by titrimetry in United State Pharmacopoeia.4 The atomic absorption
spectros-copy method has been reported in United States Phar-macopoeia for dissolution of calcium acetate tablets.5
European pharmacopoeia also reported assay of cal-cium acetate by complexometric titration of calcal-cium.6
Few methods are reported for determination of calcium in serum by atomic absorption spectroscopy.7,8 Calcium
determination by flame photometry is also reported.9,10
Some methods are reported estimation of calcium by Inductively coupled plasma-mass spectroscopy (ICP-MS).11,12 It was observed that there is no method
avail-able for quantitative estimation of calcium acetate in calcium acetate capsules by RP-HPLC using UV detec-tor, hence the present work was undertaken to develop and validate a simple, accurate and economical method by RP-HPLC using UV detector which can be used for routine analysis in quality control and research labora-tory for assay of calcium acetate in capsules.
MATERIA LS
Copper sulfate pentahydrate (ACS grade, EC No. 231-847-6) was procured from Merck Millipore, India. Cal-cium acetate working standard (secondary standard traceable to USP) was procured from Sigma-Aldrich (Catalog No. PHR1362). HPLC grade water was used from Milli-Q water purifier system. The marketed cal-cium acetate capsule formulation (Calcal-cium Acetate Gelcaps 667mg, Make: Fresenius Medical Care, North America) was used for analysis of drug product.
METHODS
The method was developed and validated on Agilent’s 1260 Infinity II series automated HPLC system with UV detector using EZChrome Elite software, version 3.3.2 SP2. The method used to estimate calcium is indi-rect UV method.13 The chromatographic parameters
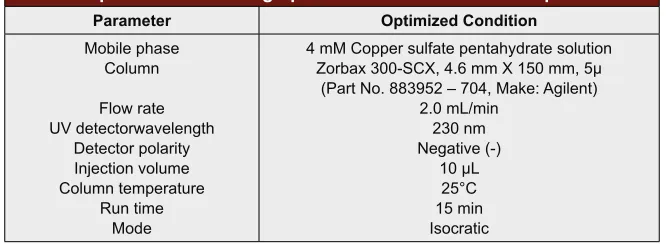
were optimized and optimized chromatographic condi-tions are shown in Table 1.
Mobile phase (4 mM Copper sulfate pentahydrate solution)
Dissolved 1000 mg of copper sulfate pentahydrate in 1000 mL of HPLC grade water and filtered through 0.45µm, nylon 6,6 membrane filter and degassed under sonication for 10 min.
Diluent and blank
Used HPLC grade water as diluent and blank.
Standard preparation (about 750 µg/mL)
Weighed accurately and transferred 75.0 mg of calcium acetate working standard in to a 100 mL volumetric flask. Added 70 mL of diluent, sonicated to dissolve and made volume up to mark with diluent. Filtered the solu-tion through 0.45 µm Polyvinylidene Fluoride (PVDF) syringe filter by discarding about first 3 mL of filtrate.
Check standard preparation (about 750 µg/mL)
Weighed accurately and transferred 75 mg of calcium acetate working standard in to a 100 mL volumetric flask. Added 70 mL of diluent, sonicated to dissolve and made volume up to mark with diluent. Filtered the solu-tion through 0.45 µm Polyvinylidene Fluoride (PVDF) syringe filter by discarding about first 3 mL of filtrate.
Test sample preparation (about 750 µg/mL)
Crushed 20 capsules content in fine powder. Weighed accurately and transferred capsule powder equivalent to 150 mg of calcium acetate in to a 200 mL volumetric flask. Added 170 mL of diluent, sonicated for 20 min with intermittent shaking and made volume up to mark with diluent. Filtered the solution through 0.45 µm Poly-vinylidene Fluoride (PVDF) syringe filter by discarding about first 3 mL of filtrate.
Method validation
The developed method was validated as per Interna-tional Conference on Harmonization (ICH) Q2 (R1)14
guidelines and United States Pharmacopoeia general chapter <1225>.15
System suitability
System suitability was checked in accordance with United States Pharmacopoeia general chapter <621>.16
% relative standard deviation for six replicate standard, similarity factor for check standard, tailing factor and theoretical plate count of calcium peak were evaluated.
Specificity
The developed method was validated for specificity by injecting blank and placebo solution in triplicate. The chromatograms were evaluated for any interference at the retention time of calcium peak.
Precision
calcium acetate. Intermediate precision of the method was also evaluated using different analyst, different HPLC system and different column by injecting six test sample prepared as same for precision. The acceptance criteria for individual precision % RSD was not more than 2.0 and for 12 assay results was not more than 3.0. The mean assay difference of individual precision was not more than 2.0%.
Accuracy (Recovery)
Recovery study was performed to evaluate the accuracy of the method by spiking method.Recovery study was done by spiking calcium acetate standard in to placebo in the concentration of 50%, 100% and 150% level of the proposed concentration. The test samples were prepared in triplicate at each level and injected in the proposed chromatographic conditions. % recovery of calcium acetate was calculated for all the levels. The acceptance criterion for recovery of calcium acetate was 98.0 to 102.0% and % RSD for nine recovery results was not more than 2.0.
Limit of Detection (LOD) and Limit of Quantitation (LOQ)
LOD and LOQ were determined by standard deviation of the response and slope method. The linearity was performed from 5 to 100% of the proposed concentra-tion by diluting standard soluconcentra-tion. LOD and LOQ were determined by using following formulae:
LOD = 3.3×(σ/S) LOQ = 10×(σ/S)
Where σ = standard deviation of response and S = slope determined from calibration curve of linear plot.
Linearity
Linearity of the method was established for calcium acetate from LOQ to 150% of the proposed concentra-tion using nine calibraconcentra-tion levels (LOQ, 5, 10, 25, 50, 75, 100, 125 and 150%) from the range LOQ to 1125 µg/ mL. The working standard was used to prepare calibra-tion levels. The calibracalibra-tion curve was plotted for each
level as concentration of level verses peak response. The result of linearity was evaluated by regression analysis.
Robustness
For robustness study, three chromatographic parame-ters were considered such as (i) concentration of mobile phase ±10% (3.6 and 4.4 mM copper sulfate pentahy-drate solution), (ii) flow rate ±10% (1.8 and 2.2 mL/ min) and (iii) column temperature ±5°C (20°C and 30°C). Robustness of the method was evaluated by sys-tem suitability and assay of formulation.
Solution stability
Solution stability was established for standard and test sample preparations. Bench-top (ambient temperature) stability was established by injecting standard and test sample at regular interval for seven days. Solution sta-bility was established by calculating similarity factor for standard against fresh standard and % assay difference for test sample from initial assay.
RESULTS AND DISCUSSION
Method development
The Principle behind the indirect UV method was applied; the copper sulfate pentahydrate with UV absorption in the mobile phase was replaced with cal-cium ions without UV absorption, resulting in a reduc-tion in UV absorpreduc-tion of the mobile phase.13 Several
trials were taken to optimize the concentration of cop-per sulfate pentahydrate, flow rate and injection volume to achieve good peak shape and better retention of cal-cium peak. It was observed that the concentration of copper sulfate pentahydrate is indirectly proportional to retention of calcium peak. The most optimized chro-matographic conditions are summarized in Table 1.
System suitability
System suitability of the method was evaluated by means of % relative standard deviation for six replicate stan-dard, similarity factor for check stanstan-dard, tailing factor
Table 1: Optimized Chromatographic Conditions of the Developed Method.
Parameter Optimized Condition
Mobile phase Column Flow rate UV detectorwavelength
Detector polarity Injection volume Column temperature
Run time Mode
4 mM Copper sulfate pentahydrate solution Zorbax 300-SCX, 4.6 mm X 150 mm, 5µ
(Part No. 883952 – 704, Make: Agilent) 2.0 mL/min
230 nm Negative (-)
and theoretical plate count of calcium peak and found within the acceptance criteria. The results are presented in Table 2.
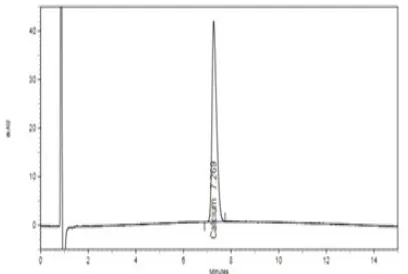
Specificity
The specificity was performed to check blank and pla-cebo interference. The chromatograms show (Figures 2-5) no interference at the retention time of calcium peak due to blank and placebo.
Precision
Precision of the method was evaluated by injecting six test sample preparations from a homogenous fine cap-sule powder and % RSD of assay (n=6) was found to be 0.6, whereas for intermediate precision it was found to be 0.5. % RSD of precision and intermediate precision (n=12) was found to be 0.6. The mean % assay difference was found to be 0.4 between precision and intermediate precision. The results were found within acceptance cri-teria for precision of the developed method. The results of precision are compiled in Table 3.
Accuracy (Recovery)
The accuracy was evaluated by calculating the recoveries at 50%, 100% and 150% level of the proposed concen-tration and the mean % recoveries (n=3) were found to be 98.0, 99.0 and 100.0 respectively. The mean %
recov-Figure 1: Structure of Calcium acetate.
Figure 2: Chromatogram of blank. Figure 5: Chromatogram of test sample.
Figure 4: Chromatogram of standard.
ery of all levels (n=9) was found to be 100.0 with 0.5 % RSD. The recoveries were found within the acceptance criteria and method found to be accurate. The results of accuracy are presented in Table 4.
LOD and LOQ
LOD and LOQ were determined by standard deviation of the response and slope method. The LOD and LOQ of the method were found to be 6.3 µg/mL and 19.0 µg/mL respectively.
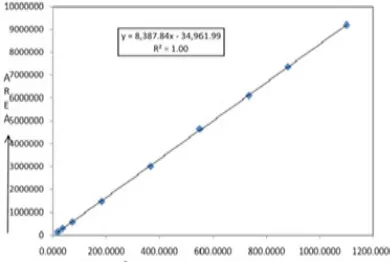
Linearity
The developed method was found to be linear from LOQ to 150% of the proposed concentration over
Figure 6: Linearity graph of calcium acetate.
Figure 7: Chromatogram at LOQ level.
Table 5: Robustness Results. Chromatographic Parameters Retention time
(min) % RSD of standard Tailing factor Theoretical plates % Assay
As such method
3.6 mM Copper Sulfate Pentahydrate 4.4 mM Copper Sulafte Pentahydrate
Flow rate 1.8 mL/min Flow rate 2.2 mL/min Column temp. 20°C Column temp. 30°C
7.1 7.4 6.9 7.7 6.5 7.4 6.9 0.7 0.5 0.7 0.8 0.8 0.6 0.5 1.1 1.1 1.2 1.2 1.1 1.2 1.1 8156 8594 7634 8310 7826 8130 7893 99.9 99.3 99.6 100.2 99.7 99.5 99.8
Table 2: System Suitability Results.
Parameter Result
Retention time (min) % RSD of six replicate standard Check standard (similarity factor)
Tailing factor Theoretical plates 7.1 0.8 1.00 1.1 8123
Table 3: Precision Results.
Test sample No. Precision (%
assay) Intermediate precision (% assay)
01 02 03 04 05 06 Mean (n=6) % RSD (n=6) Mean (n=12) % RSD (n=12) Mean % difference
99.1 98.6 100.1 99.2 99.8 99.9 99.5 0.6 100.6 99.3 100.2 00.8 99.6 99.8 99.9 0.5 99.7 0.5 0.4
Table 4: Accuracy Results. Recovery
level Test No. Recovery (%) Mean (%) % RSD
50 % 50 % 50 % 100 % 100 % 100 % 150 % 150 % 150 % 1 2 3 1 2 3 1 2 3 99.6 99.7 100.3 100.4 100.0 100.7 100.4 99.4 100.2 99.0 100.4 100.0 0.4 0.3 0.5 % mean recovery of all levels (n=9) 100.1 0.4
nine calibration levels ranging from 19 µg/mL (LOQ) to 1125 µg/mL. The value of correlation coefficient (r2) was found to be 1.000. Linearity graph of calcium
acetate is shown in Figure 6. Chromatograms at LOQ and 150 % are shown in Figure 7-8.
Robustness
The robustness of method was evaluated by changing critical chromatographic parameters like concentration of mobile phase, flow rate and column temperature. Robustness results were found within the acceptance criteria and presented in Table 5.
Solution stability
REFERENCES
1. https://en.wikipedia.org/wiki/Calcium_acetate
2. https://www.webmd.com/drugs/2/drug-10696/calcium-acetate-oral/details 3. Sharma BK. Spectroscopy, 2007; 20th edition, GOEL Publication House.
2007;S125. S-125.https://books.google.co.in/books/about/Spectroscopy. html?id=qYEw OKqNCwC.
4. United States Pharmacopoeia 41- NF36, The U.S. Pharmacopoeial Convention 2018; Official Monographs. Calcium Acetate and Calcium Acetate Tablets:627-630.
5. United States Pharmacopoeia 41- NF36, The U.S. Pharmacopoeial Convention 2018; Official Monographs.Calcium Acetate Tablets: 2017;1910-11.
6. European Pharmacopoeia 9.0, Council of Europe 2017; Monographs, Calcium Acetate:1910-1911.
7. Sudhakar K, Sujatha M, Ramesh BS, Padmavathi P, Reddy PP. Serum calcium levels in patients with essential hypertension and their first degree relatives. Indian J of Clin Biochemistry. 2004;19(1):21-3. https://www.ncbi. nlm.nih.gov/pmc/articles/PMC3453899/.
8. Maqueda C, Morillo E. Determination of calcium by atomic absorption spectrometry in samples dissolved by acid mixtures. J of Anal Chem.1990;338(3):253-4. https://link.springer.com/article/10.1007/ BF00323018.
9. Baker RWR. The determination of calcium in serum by flame photometry. Biochem J. 1995;59(4):566-71.. https://www.ncbi.nlm.nih.gov/pmc/articles/ PMC1215619/.
10. The simple Flame Photometric determination of Calcium, Bibby Scientific, Protocol: P05-011A http://www.jenway.com/adminimages/P05_011A_
Determination_of_Calcium.pdf.
11. Chen Z, Griffin IJ, Kriseman Y, Liang LK, Abrams SA. Inductively Coupled Plasma Mass Spectrometric analysis of Calcium Isotopes in Human Serum: A low-sample-volume Acid-Equilibration Method. Clinical Chemistry. 2003;49(12):2050-5. https://www.ncbi.nlm.nih.gov/pubmed/14633877 12. Lee A, Yang V, Hsu J, Wu E, Shih R. Ultratrace measurement of calcium in
ultrapure water using the agilent 8800 Triple quadrapole ICP-MS. Aplication
note, Agilent Technologies, Tokyo, Japan. https://www.agilent.com/cs/
library/applications/5991-1693EN_AppNote_ICP-MS_8800_semicon_Ca_ ultrapure_water.pdf.
13. Shintani H. Improvement of ion chromatography with ultraviolet photometric detection and comparison with conductivity detection for the determination of serum cations. J of Chrom. B: Biomedical Sci and Appl. 1985;341:53-63. https://www.sciencedirect.com/science/article/pii/S0378434700840098 14. International Conference on Harmonisation, Harmonized Triplicate Guideline
2005, Validation of analytical procedures: text and methodology: Q2(R1). http://www.ich.org/fileadmin/Public_Web_Site/ICH_Products/Guidelines/ Quality/Q2_R1/Step4/Q2_R1 Guideline.pdf Accessed October 20, 2018. 15. United States of Pharmacopoeia 41- NF36, United States Pharmacopeial
Convention 2018, General chapter <1225>, Validation of Compendial Procedures.
16. United States of Pharmacopoeia 41- NF36, United States Pharmacopeial Convention 2018, General Chapter <621>, Chromatography.
Figure 8: Chromatogram at 150 % level.
CONCLUSION
The developed method was validated as per ICH and USP guidelines for specificity, precision, accuracy, lin-earity and robustness over the range of 325 to 1125 µg/ mL and found meeting the acceptance criteria for all parameters. The proposed method is innovative, simple, accurate, robust and economical method for quantita-tive estimation (assay) of calcium acetate in calcium acetate capsules by RP-HPLC using UV detector can be used for routine analysis in quality control and research laboratory as an economical and easy alternative to the more sophisticated and expensive to run instruments.
ACKNOWLEDGEMENT
The authors express their thanks to Suven Life Sciences Limited, Hyderabad for support and providing the research facility to carrying out the work.
CONFLICT OF INTEREST
The authors declare no conflict of interest.
ABBREVIATIONS
RP-HPLC: Reverse Phase High Performance Liquid Chromatography; UV: Ultra Violet; ICH: International Conference on Harmonization; USP: United States Pharmacopoeia; LOQ: Limit of Quantitation; LOD:
Limit of Detection; RSD: Relative Standard Deviation;
mM: Millimolar; n=6: Number of test samples = 6;
n=12: Number of test samples = 12; n=9: Number of test samples = 9.
PICTORIAL ABSTRACT
• The present study describes the use of indirect UV method for those molecules which are not having chro mophore in the structure.
• The Principle behind the indirect UV method was applied; the copper sulfate pentahydrate with UV absorp tion in the mobile phase was replaced with calcium ions without UV absorption, resulting in a reduction in UV absorption of the mobile phase. • Method was developed on strong cation exchanger
column. The mobile phase consists of 4 mM cop-per sul fate pentahydrate solution at a flow rate of 2.0 mL per min. Indirect UV detection was per-formed at 230.0 nm. Retention time for calcium was found about 7.1 min.
• The developed method was validated as per ICH Q2 (R1) guidelines and USP general chapter <1225>.
• The developed method is innovative, simple, accu-rate, robust and economical and can be used for routine analysis in quality control and research laboratory.
About Authors
Dr. Subhranshu Panda is Professor and Principal at K. L. College of Phar-macy, K. L. University, Vaddeswaram, Guntur, Andhra Pradesh, India.
Mr. Rajesh Kumar Chawla is work-ing with Suven Life Sciences Limited, Hyderabad as Manager in Analytical R&D (Formulations) and pursuing Ph.D. from K. L. College of Pharmacy, K.L. University, Vaddeswaram, Guntur, Andhra Pradesh, India.
Dr. Siva Prasad Panda is an Associate Professor at K. L. College of Pharmacy, K. L. University, Vaddeswaram, Guntur, Andhra Pradesh, India.
Dr. K. Umasankar is Professor at K. L. College of Pharmacy, K. L. Univer-sity, Vaddeswaram, Guntur, Andhra Pradesh, India.
Dr. Dalu Damayanthi is an Associate Professor at K. L. College of Pharmacy, K. L. University, Vaddeswaram, Guntur, Andhra Pradesh, India.