https://doi.org/10.3926/jiem.2654
Material Management without Forecasting:
From MRP to Demand Driven MRP
Alaitz Kortabarria , Unai Apaolaza , Aitor Lizarralde , Itxaso Amorrortu Dpto. de Mecánica y Producción Industrial, Mondragon Unibertsitatea (Spain)
[email protected], [email protected], [email protected], [email protected]
Received: May 2018 Accepted: July 2018
Abstract:
Purpose: Efficient Operations and Supply Chain Management is key to building sustainable competitive edge for companies. However, the achievement of this goal is becoming challenging in the present dynamic production environment, as traditional Manufacturing Planning and Control systems were not developed to work in this context. The Demand-Driven Material Requirement Planning (DDMRP) methodology was developed with the aim of addressing this need and deal efficiently with material management. The present work therefore, analyzes the implemented changes and the subsequent qualitative and quantitative results of a company after converting from MRP to DDMRP.
Design/methodology/approach: To achieve an in depth understanding of the case study a qualitative approach was taken. Data was collected from semi-structured interviews, documents and archival records enabling triangulation. The results from before and after the implementation of DDMRP were compared, and the evolution of the performance of the company was evaluated.
Findings: The results clearly show that using DDMRP the company increased visibility in the supply chain. In addition, the inventory level was reduced by 52.53% while material consumption was increased by 8.7%. These results were achieved while maintaining the high service level.
Originality/value: DDMRP is a relatively new methodology and for this reason there is little published data in this field. In addition the few studies found in the literature analyze the performance of DDMRP in simulated environments. The present work aims to go one step further and analyzes the implementation of DDMRP in a real company.
Keywords: DDMRP, inventory level, visibility, MRP, forecast, uncertainty
To cite this article:
1. Introduction
In the 1960s, the primary competitive thrust for companies was cost, therefore manufacturing strategy was based on high-volume production, cost minimization, and stable economic conditions. However, the market changed between 1960 and 1980, with quality becoming a primary element of competitivity (Rondeau & Litteral, 2001). What mattered in the 1980s was the ability of suppliers to create or adapt new products and services on a timely basis to meet specific customer needs (McKenna, 1990).
This new reality required a dynamic production environment where products, processes and production schedule could change frequently (Rondeau & Litteral, 2001). Thus, companies were under pressure to lower total costs in the entire supply chain, shorten throughput times, drastically reduce inventories, expand product choice, provide more reliable delivery dates and better customer service and improve quality to achieve competitive advantage (Shankarnarayanan, 2000; Umble, Haft, & Umble, 2003; Cox & Schleier, 2010).
Barney and Clark (2007) defined competitive advantage as economic net value gained; either greater profits were obtained at the same cost in comparison to competitors, or profits were the same as those of the competitors but produced at lower cost. Many authors have analyzed competitive advantage: Jones and Riley (1985) asserted that to reduce the inventory level keeping or improving customer service level led a positive differentiation against competitors. Mabin and Balderstone (2003) defined throughput, inventory and operating expense as operational measures that directly are related to the Return on Investment performance measure of a company. Bower and Hout (1988), Christopher (2012) and Amirjabbari and Bhuiyan (2014) suggested that a reduction in the order cycle led to a major source of competitive advantage, as it directly influenced the customer satisfaction level.
According to Lutz, Löedding, and Wiendahl (2003), customer satisfaction depends increasingly on the achievement of logistical success factors such as Lead Time (LT), service level and delivery due-date reliability. They also asserted that the thorough management of inventories is essential in the achievement of these goals.
Visibility is another concept that many authors link to competitive advantage. Mora-Monge et al. (2010) measured it in terms of accuracy and speed of information flow. They stated that visibility was key in supply chain management because it improved operational efficiency, preventing the effect of stock-out and increasing resource productivity. Furthermore, visibility improved the effectiveness of the planning process, reducing inventory levels and increasing delivery performance. Hoyt and Huq (2000) and Barratt and Oke (2007) pointed out that visibility was required in a supply chain linkage to achieve sustained competitive advantage.
In the context of the abovementioned factors, the choice of the Manufacturing Planning and Control (MPC) system is considered to be crucial (Abuhilal, Rabadi, & Sousa-Poza, 2015). In the last century, many MPCs were developed, the most widespread being Material Requirements Planning (MRP), Just in Time (JIT) and Theory of Constraints (TOC).
Ptak and Smith (2011) analyzed these MPCs and concluded that they did not perform sufficiently in a dynamic production environment, since:
• MRP was constructed under a “push and promote” mentality where the market was more tolerant of longer LT and shortages.
• JIT defines inventory as a waste. Companies that implement a JIT system, reduce their inventory level considerably, making the supply chain too brittle and less agile when the demand and supply are volatile. • TOC does not consider the Bill of Material (BOM) explosion, hence it has difficulties dealing with
complex BOM structures greater than two levels.
Many authors agree that DDMRP manages material efficiently (Lee & Jang, 2013, 2014; Rim, Jiang, & Lee, 2014; Ihme, 2015; Ihme & Stratton, 2015; Miclo, Fontanili, Lauras, Lamothe, & Milian, 2015; Miclo, 2016; Shofa & Widyarto, 2017; Miclo, Lauras, Fontanili, Lamothe, & Melnyk, 2018). Nevertheless, there were no studies found in the literature that analyzed the implementation of DDMRP in a company under real production conditions. The present work therefore seeks to fill this gap and contributes a case study that analyzes a real world DDMRP implementation to determine the impact of DDMRP on material management.
2. Overview of Main MPC Systems
2.1. MRP
APICS (2016: pp. 110) defines MRP as “a set of techniques that uses BOM data, inventory data, and the Master Production Schedule (MPS) to calculate requirements for materials. It makes recommendations to release replenishment orders for material”.
During the mid-1960s, many firms converted from Reorder Point system to MRP, thereby reducing inventory holding cost, improving customer service and streamlining operations with less need for shipments (Rondeau & Litteral, 2001). Nonetheless, many authors have analyzed MRP and have concluded that it is not the best MPC system to deal with a volatile and variable world. Huq and Huq (1994) stated that MRP was only created for planning material requirements and lacked visibility in execution. In addition, MRP is fed by the forecast of the demand for the end-product, causing uncertainty and system nervousness. This leads to unacceptable inventory performance and service level, high shipping-related expenses and waste, and lack of visibility causing a bullwhip effect (Brennan & Gupta, 1993; Chen, Drezner, Ryan, & Simchi-Levi, 2000; Cox & Schleier, 2010; Ptak & Smith, 2011). In order to cope with these misalignments Safety Stock (SS) is usually used.
Since its development, MRP has evolved into MRP II and after that, into Enterprise Resource Planning (ERP) acquiring new features. In spite of the fact that the technology has evolved and market requirements have changed however, the basic engine used to drive information systems in ERP is still the traditional MRP system, which was developed in the 60s (Guide Jr & Srivastava, 2000; Hwa-Chung & Snyder, 2000; Ptak & Smith, 2011; Wang & Liu, 2013).
2.2. JIT
JIT is “a philosophy of manufacturing based on planned elimination of all waste and on continuous improvement of productivity” (APICS, 2016: pp. 97). JIT eliminates wastes, reduces the batch size, shortens the setup time, eliminates process inventory and standardizes jobs (Sugimori, Kusunoki, Cho, & Uchikawa, 1977; Monden, 1984; Berggren, 1993; Jina, Bhattacharya, & Walton, 1997).
At first glance, the JIT system appears to be an efficient MPC. Nevertheless, according to many authors, a JIT production system is sensitive and susceptible to variation in demand because it operates without buffers (Sarker & Fitzsimmons, 1989; Steele, Berry, & Chapman, 1995; Benton & Shin, 1998). This causes the supply chain to become brittle and less agile when the demand and supply are volatile (Ptak & Smith, 2011). For that reason JIT also requires the main features of conventional MPC systems such as Production Planning, MPS and MRP to be effective and cope with variability (Krajewski, King, Ritzman, & Wong, 1987; Vollmann, Berry, & Whybark, 1997).
2.3. TOC
TOC is a holistic management philosophy based on the principle that complex systems exhibit inherent simplicity. Every system has at least one constraint that limits the ability to generate more of the goal of the system (APICS, 2016: pp. 187).
As a replenishment method for solving the distribution and supply chain problem TOC proposes a six-step solution, known as Theory of Constraints Supply Chain Replenishment System (TOC-SCRS) (Cox & Schleier, 2010). This solution provides a reduction of the inventory level, LT and transportation costs and an increase in forecast accuracy and customer service levels. Nevertheless the definition of the replenishment frequency can be a difficult task (Wu, Lee, & Tsai, 2014). In addition, as it does not incorporate BOM explosion it can have difficulties managing greater than two levels of BOM structures (Ptak & Smith, 2011).
2.4. DDMRP
Considering the present highly volatile and variable manufacturing environment where planning scenarios are more complex than ever, a demand-driven manufacturing strategy is necessary. The goal of this strategy is to compress LT and align efforts to market demands. This includes careful synchronization of planning, scheduling and execution with material consumption. Such a strategy encourages companies to centralize the demand instead of the inventory. Thus they are able to sense and adapt to market changes, becoming more agile (Ptak & Smith, 2011).
MRP, JIT and TOC lack functionalities to carry out a demand-driven manufacturing strategy. The traditional push approach MRP appears to have shortcomings when dealing with environments with unpredictable demands. At the same time, the limited set of materials planning and inventory control tools in pull-based philosophies such as TOC and JIT are also inadequate to implement a demand-driven manufacturing strategy (Ptak & Smith, 2011).
Using a traditional MPC system, the inventory level of a company presents a BI-MODAL distribution which flip-flops back and forth between too much and too little inventory entailing high cost and low service level (Figure 1) (Ptak & Smith, 2016).
Taking into account this dilemma and the need for an MPC that address a demand-driven manufacturing strategy, the DDMRP methodology was developed. DDMRP is a formal multi-echelon planning and execution method to protect and promote the flow of relevant information and materials through the establishment and management of strategically placed decoupling points (Ptak & Smith, 2016).
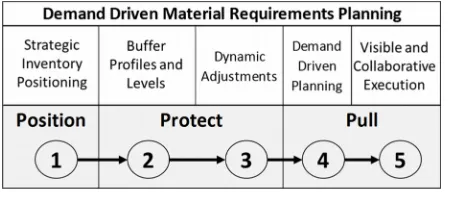
DDMRP is composed of five phases (Figure 2). The first three phases define the initial and evolving configuration of the DDMRP model. The fourth and fifth define the operational aspects of the DDMRP system, which are planning and execution.
Figure 1. BI-MODAL distribution of inventory (Ptak & Smith, 2016)
Figure 2. The five phases of DDMRP (Ptak & Smith, 2016)
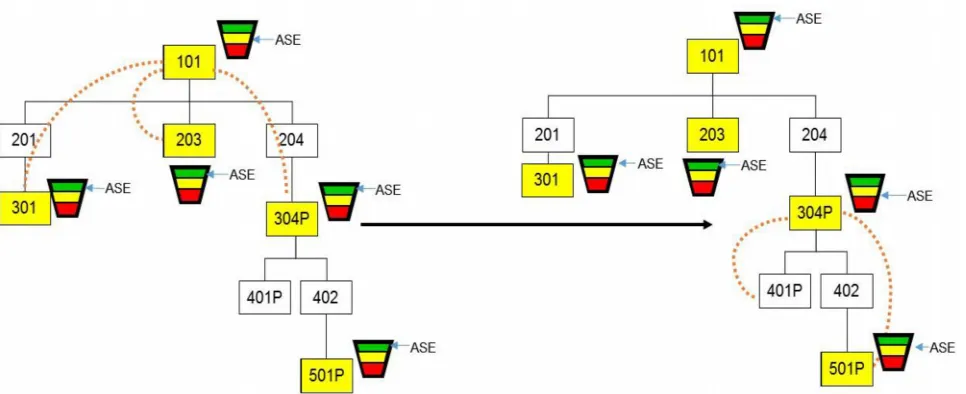
BOM to become a breaking wall that breaks the wave of variability and compresses LT. DDMRP proposes six positioning factors to position the inventory also known as decoupling points (Ptak & Smith, 2016). The allocation of decoupling points in the BOM creates a new LT named Decoupled Lead Time (DLT) which is defined as “the longest cumulative coupled lead time chain in the product structure of a manufactured item” (Ptak & Smith, 2016: page 69).
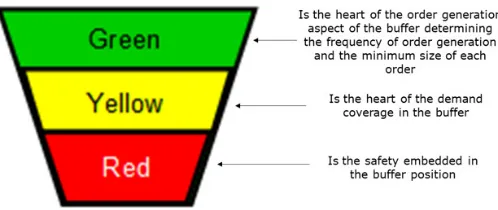
• Buffer Profiles and Levels: The second step of DDMRP is to determine the amount of protection at the decoupling points. Too much inventory involves excess cash, capacity, materials and extra space to store this inventory. In addition obsolescence risks are higher. On the other hand, when a company has too little inventory, frequent shortages prevail that can trigger missed sales opportunities and costly rush orders (Ptak & Smith, 2016).
DDMRP defined color-coded buffers composed of 3 zones where each zone has a specific function as set out in Figure 3. To size each zone factors such as DLT, Average Daily Use (ADU) and Minimum Order Quantity (MOQ) are considered.
Figure 3. Zones of the buffer (Ptak & Smith, 2016)
• Dynamic Adjustments: Supply chains must be ready to adapt to volatile markets and provide the best service to the customer. This requires the use of dynamic buffers to be able to adjust to new requirements. For this purpose, DDMRP provides dynamic adjustments that define buffer level fluctuations based on operating parameters, market changes, and planned or known future events (Ptak & Smith, 2016).
• Demand-Driven Planning: This is the process by which supply orders (purchase orders, manufacturing orders, and stock transfer orders) are generated (Ptak & Smith, 2016). DDMRP proposes a Net Flow Equation that provides the supply order generation recommendation signal (timing and quantity) for buffer replenishment. This equation provides the Net Flow Position (NFP) of each buffer and should be performed daily at all decoupled points.
DDMRP generates a supply order based on NFP. Therefore, when the NFP is positioned in the replenishment zone (yellow zone of the color-coded buffer), a supply order is recommended for a quantity that is the difference between the NFP and the Top of Green zone of the color-coded buffer.
Figure 4. Decoupling explosion of the BOM (Ptak & Smith, 2011)
• Visible and Collaborative Execution: DDMRP distinguishes between planning and execution. Planning is the process of generating supply order requirements using NFP, and ends once the recommendations are approved and become open supply orders. As for execution, this is the management of these open supply orders in order to protect and promote flow. To this end DDMRP incorporates different color-coded alerts to provide visibility to prioritize orders which makes it easier to realize when a part is in a critical situation and requires attention. The company is thus able to give correct priority to the orders based on the on-hand buffer status instead of relying solely on the due date (Ptak & Smith, 2016).
3. Objective of this Research Study
A number of studies have been found in the literature which indicate that DDMRP manages material efficiently (Lee & Jang, 2013, 2014; Rim et al., 2014; Ihme, 2015; Ihme & Stratton, 2015; Miclo et al., 2015; Miclo, 2016; Shofa & Widyarto, 2017; Miclo et al., 2018). However Ihme (2015) and Shofa and Widyarto (2017) stated that few studies have scientifically proven the performance of DDMRP. Miclo et al. (2018) also pointed out the need for further research to uncover more aspects of DDMRP in terms of its value to manufacturing organizations. In addition, Lee and Jang (2014) highlighted the lack of studies of a real implementation of DDMRP in a company, to demonstrate that it achieves the theoretical results. The main contribution of this research work therefore, is an analysis of a real-world implementation of DDMRP and the results achieved. To this end the present paper analyzes in detail the changes that a company underwent after the implementation of DDMRP in terms of the planning and execution of purchasing orders. In the analysis, special emphasis was placed on the visibility that the planning manager requires to perform these tasks efficiently. A quantitative analysis of the evolution of the inventory vs. material consumption and the coverage stock was also carried out.
4. Methodology
5. Case Study
In this section the company where DDMRP was implemented is introduced, and the reasons for implementation are explained. Then, critical points that prevented material and information flow are set out. After that, the DDMRP implementation is summarized and finally the qualitative and quantitative results are presented.
5.1. Introduction
This case study is based on a company that was established in 1948. They started business as a padlock manufacturer and the growing reputation of the brand, encouraged the company to widen its product range. Today, this company is leader in the Spanish locksmith market and provides sales coverage throughout Spain and more than 50 countries worldwide. Approximately 85% of total sales are national customers while the rest are international. To preserve the anonymity of the company, in this research work it is called CS1.
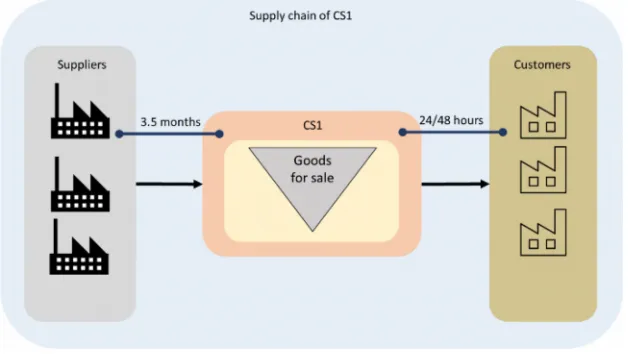
Most suppliers of CS1 were located in China. Materials were transported in containers by boat due to the heavy weight of the goods, the low market price of the end products and the high cost of transportation. This resulted in considerable purchase LT, on average 3.5 months.
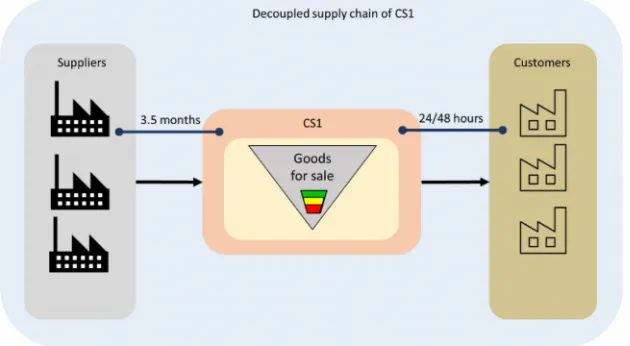
To observe the fluctuation of the on-hand goods inventory after DDMRP implementation, 579 references between June 2016 and April 2017 were analyzed. It is important to note that the purchase LT of all these goods was on average 3.5 months, and that CS1 had to serve the orders between 24 and 48 hours to their customers as set out in Figure 5.
Figure 5. Supply chain of CS1
5.2. Critical Points that Reduced the Flow of Materials and Information in the Supply Chain
When consultants in collaboration with Mondragon Unibertsitatea began analyzing data to implement DDMRP in the company they found operational situations that were directly affecting the flow of materials and information. These situations are set out below.
5.2.1. High On-hand Inventory Level
CS1 could not launch rush orders as their suppliers did not have the capacity to meet them in the short-term. On the rare occasion suppliers could satisfy rush orders, the high cost of transportation by plane made supply financially unviable. Hence high SS was the only way the company could manage demand uncertainty.
All these factors resulted in a high on-hand inventory level, skewing the BI-MODAL distribution to the right and thus raising the inventory holding cost.
5.2.2. Planning Purchase Orders Once per Month
Prior to DDMRP, CS1 planned material purchases once a month for a period of one month. Thus, with an average purchasing LT of 3.5 months, the PPM planned the material requirements of a month, 3.5 months in advance. The company planned once a month due to the work involved. To identify material requirements, the PPM had to feed a manually programmed spreadsheet through the ERP. Then he had to interpret the data obtained to finally be able to launch the purchase orders. This consumed a lot of time and effort and it was therefore considered unfeasible to increase the frequency of this task.
Monthly planning greatly reduced the visibility of the status of goods of CS1 as it would not be reviewed until the following month. In the same way, unforeseen references were also not identified until the next time the material planning task was carried out, losing reaction capacity.
This lack of visibility had the potential to lead to stock-outs, an outcome the company covered by holding a high SS, once again resulting in a skewed BI-MODAL distribution.
5.2.3. Lack of Visibility to Manage the References of the Same Family
CS1 purchased goods from many suppliers with certain providers supplying more than one type of good. These suppliers defined a common MOQ that had to be filled by the total amount of references belonging to the same family. In other words, the purchased quantity of different references of the same family needed to be greater than the common MOQ.
The ERP used by the company did not have the capacity to identify and visualize material status by families and therefore could not determine the optimal joint purchase order for the established common MOQ of a family. CS1 had no choice but to set this MOQ to each reference individually, thereby buying more units than required, significantly increasing the on-hand inventory level and consequently diverting the inventory level towards the right side of the BI-MODAL distribution.
5.2.4. Fully Dependent Purchasing Process
Only one person was dedicated to the task of planning material requirements, the PPM, and only this person had required information to carry out this task. The rest of the staff of the company had no knowledge of the process, the criteria to plan orders or the status of the on-order materials, since this information was not easily available in the ERP.
CS1 therefore, depended entirely on one individual to plan the purchase orders. If at any time this person was absent from work, the company was unable to perform this task.
5.3. DDMRP Implementation in CS1
The implementation of the 5 steps of DDMRP in CS1 is set out below.
5.3.1. Strategic Inventory Positioning
Figure 6. Decoupled supply chain of CS1
5.3.2. Buffer Profiles and Level Determination
To define buffer size the DLT, the ADU and the MOQ of the references to be stored were identified, analyzed and validated. After that, the buffers were sized. To this end, new fields were developed in the ERP of the company to record the new attributes such as ADU, red, yellow and green levels of the buffers of each reference.
In this step the family code to which each reference belonged was also defined. In this way, references belonging to the same family could be filtered out and thus made visible when a joint purchase was carried out.
5.3.3. Dynamic Buffers
In this step the recalculated adjustment was scheduled, so that the buffers were adjusted based on changes to individual part attributes.
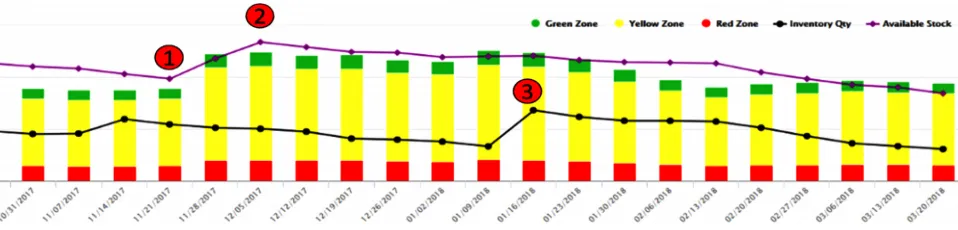
As most suppliers were from China, planned adjustments were also configured to manage Chinese New Year which is celebrated at the beginning of February and the majority of Chinese companies close during this period. This fact affected the supply of materials to CS1, as from February to late March they did not receive material from these suppliers. To continue serving customer orders over this period, CS1 had to bring forward to January the purchase orders to be consumed between February and March.
For that purpose, the company planned an adjustment considering factors such as material consumption between February and March, the LT of the references whose supply would be interrupted and the time that Chinese suppliers would not serve the orders. With this data an adjustment factor was calculated and the buffers resized. This adjustment resulted in an increase of the purchase orders so that in November they received 20% extra material, in December 40% and in January 75%. Thus, the extra inventory enabled the company to serve customer orders between February and March in spite of the fact that Chinese suppliers did not supply material until the end of March.
Once this festive period ended and the Chinese suppliers resumed normal business hours, the supply returned to normal, and buffers were adjusted to the new environment.
Figure 7. Real buffer evolution implementing a planned adjustment.
5.3.4. Demand Driven Planning
After configuring the supply chain in a DDMRP environment, CS1 began planning using new methodology. The information required to plan supply orders such as the demand of each reference within a LT, the ADU, the LT, the MOQ, the on-hand inventory, open supply orders, and the red, yellow and green zones of each references was exported daily from the ERP into software that managed DDMRP (R+).
R+, calculated the NFP of each reference and showed it using a color coded alert. References in red were in a critical situation and needed be analyzed carefully to understand what had happened. Moreover a supply order had to be launched in order to avoid stock-outs. The references that were in yellow, were in the replenishment zone, and hence also needed to be ordered. Finally the references that were in green did not require any action.
Due to the family code defined for each reference, the PPM was able to filter these references. Thus, CS1 was able to check the status of the rest of the references belonging to the same family, launching purchase orders of those references whose NFP was closest to the replenishment zone, and filling the common MOQ defined by the supplier. This approach allowed the optimization of purchase batches, avoiding the purchase of large and unnecessary batches of the same reference.
5.3.5. Highly Visible and Collaborative Execution
This step manages the tracking of the orders launched in the previous step to ensure supply within the expected dates and avoid stock-outs due to unexpected delays.
When a launched order was delayed and did not meet the due date an execution alert was triggered. Hence, the PPM could contact the supplier of that particular reference and take the necessary measures to avoid a future possible stock-out.
5.4. Results Achieved after DDMRP Implementation
The implementation of DDMRP in CS1 involved a change in material management. These changes delivered qualitative and quantitative results that are explained below.
5.4.1. Qualitative Results
Prior to DDMRP implementation, CS1 relied on forecasts to launch purchase orders. However, forecast demand and real demand did not match and the company used SS to cover this mismatch, and thus maintain a high service level. Using DDMRP criteria to manage inventory and plan material requirements brought about changes. The most important of which was that CS1 planned material requirement based on real consumption instead of forecast. Therefore, the uncertainty generated by forecast reduced considerably. The inventory allocated in Goods also absorbed supply variability. These factors enabled the company to maintain the same service level but with a lower on-hand inventory level (quantitative results are set out the next section).
References were classified into families. In the case that the NFP of a reference was placed in the replenishment zone, the PPM was able to check the NFP of the rest of the references belonging to the same family. Thus a purchase of the references that belonged to the same family and were in the replenishment zone was launched. If the purchased amount did not exceed the common MOQ, the NFP of the rest of the references were checked and launched a strategic purchase order of the references that had the NFP in the green zone but were close to the replenishment zone. This approach provided visibility to make joint purchases of references belonging to the same family, optimizing the purchase batch of each reference and respecting the common MOQ established by the suppliers.
Before DDMRP implementation, CS1 was unable to visualize the status of family references. Therefore, when a reference needed to be replenished, the company was forced to purchase the minimum amount of the common MOQ although the real need was considerably lower. This resulted in a significant increase in the on-hand inventory and reduced the turnover performance.
The dynamic adjustments allowed serving orders to customers during Chinese New Year without suffering stock-outs. The buffers were resized by the adjustment factor so that enough material could be purchased to fill customer orders during supplier downtime. When suppliers resumed normal trading, the buffers adjusted accordingly.
One further result was that DDMRP provided a robust and agile methodology to carry out material planning and execution. The status of materials and purchase orders was up to date, and easily accessible providing high visibility. Identification of the references requiring attention was made simpler and shortages and stock-outs were prevented.
With this enhanced agility, CS1 increased planning frequency from once per month to once per week. This change increased the visibility and control of the status of materials and purchase orders as the alerts were checked and managed weekly. Thus references that were in the replenishment zone were purchased and open orders that were deviated from the initial plan were correctly managed, assigning the correct priority. This was a considerable improvement on the previously implemented MRP system, as the collection of data to visualize the status of the references and plan the required purchase orders was an arduous task that consumed excessive time and resources, and thus was carried out only once per month.
In addition material planning and execution was no longer dependent on one individual. Using the color coded alerts, anyone that was involved in material management tasks was able to check reference status and make appropriate and timely decisions.
5.4.2. Quantitative Results
In this Section, a global analysis of 579 references belonging to the Goods cluster was carried out. This involved studying the evolution of the total consumption, total on-hand inventory and total coverage stock. Considering the long LT of the references, the analysis was conducted over a period of 11 months, which allowed us to see several inventory turnover performances.
With the aim of doing a more in-depth study, the most consumed family was independently analyzed. This family was composed of 23 references. First a general analysis of the whole family was done, where the total ADU, total on-hand inventory and total coverage stock was studied. Then, to see the evolution of the references in detail, the most consumed three references were individually examined. The amount of three references was considered enough to carry out this analysis, as it allowed us to see if the global pattern was repeated in the references with the highest consumption.
Global analysis:
Figure 8. Evolution of the total ADU of 579 references belonging to the Goods cluster
Figure 9. Evolution of the total on-hand inventory of 579 references belonging to the Goods cluster
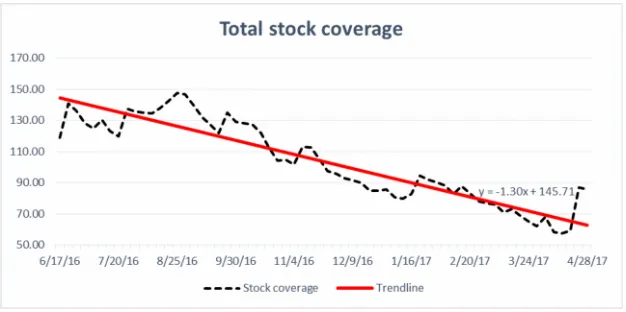
Figure 10. Evolution of the total stock coverage of 579 references belonging to the Goods cluster
Analysis of the references belonging to the most consumed family:
Figure 11 depicts the total ADU, total on-hand and total stock coverage evolution of the analyzed family for a period of 11 months after DDMRP implementation. The total ADU on average increased by 13.49% while the total on-hand inventory decreased by 81.63%. The total coverage stock therefore showed the same pattern as the on-hand inventory, decreasing by 84.92%.
Figure 11. (a) the ADU, (b) on-hand inventory and (c) stock coverage of the analyzed family
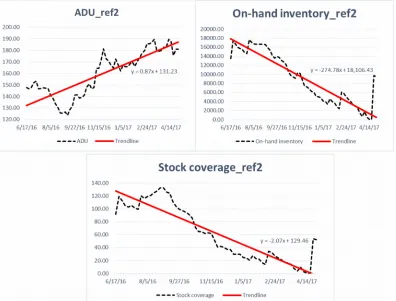
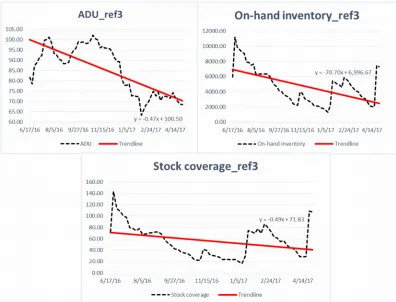
The individual analysis of the most consumed three references is summarized in Table 1 and set out in Figure 12, Figure 13 and Figure 14. Ref1 and Ref2 had the same evolution as in the analyzed period the ADU increased while both the on-hand inventory and the coverage stock decreased significantly. The ADU of Ref3 decreased during the period of analysis. Moreover, the on-hand inventory and the coverage stock also decreased by a much higher percentage.
In summary, after DDMRP implementation a significant decrease was observed in the on-hand inventory, while the ADU increased, which resulted in an increase of the inventory turnover. In addition to these benefits, the company also maintained their high service level during this period.
Ref1 Ref2 Ref3
ADU 32.32% 41.49% -29.6%
ON-HAND -98.91% -97.08% -64.31%
STOCK COVERAGE -102.65% -102.37% -43.27%
Figure 12. (a) the ADU, (b) on-hand inventory and (c) stock coverage of Ref1 of the analyzed family
Figure 14. (a) the ADU, (b) on-hand inventory and (c) coverage stock of Ref3 of the analyzed family
6. Discussion
The main conclusion of this study is that as a result of the implementation of DDMRP, CS1 improved its operational measures resulting in competitive edge improvement.
DDMRP reduced the uncertainty and increased material and information flow through the supply chain enhancing the visibility of CS1. The following points show how the company increased its visibility.
• Following DDMRP criteria to manage material decoupled CS1 from supply and demand variability. Uncertainty was therefore considerably reduced and CS1 was able to adjust its inventory to the real demand without the need for high levels of SS. CS1 had inventory placed in the Goods cluster before DDMRP implementation, however it was managed according to MRP criteria making it unfeasible to adjust inventory level to real consumption while maintaining the service level.
• CS1 increased planning frequency from monthly to weekly. Thus, the status of the references were controlled more frequently and the company noticed earlier when a reference required an action. Weekly planning prior to DDMRP was unattainable due to the considerable investment of resources required. • Grouping and visualizing references in families allowed CS1 to carry out strategic purchase orders filling
the common MOQ established by the suppliers. This resulted in purchase optimization, preventing the purchase of large amounts of inventory that were not required.
• The planned adjustments allowed CS1 to continue serving customer orders during the downtime of the suppliers. These adjustments resized the buffers preventing the purchase of excess material as well as stock-outs. In addition, once the suppliers resumed normal working hours, the buffers were again resized to that situation.
was also observed in the three most consumed references of the most consumed family. These findings clearly indicate that the company was overbuying material prior to DDMRP implementation.
7. Conclusions
Efficient Operations and supply chain management is key to achieving a sustainable competitive edge, and over the years many systems have been developed to manage this process. One such system is MRP which predicts and guesses consumption to plan material requirements. The present dynamic production environment however poses significant challenges to this approach as it was not designed to work in this context. Therefore, a new alternative approach is required.
In 2011 DDMRP was developed to improve on the shortcomings of the existing MPC systems by protecting the supply chain from variability and dealing efficiently with the material management issue. This study analyzes a real implementation of DDMRP in a company that previously was using MRP. It contributes to the gap in the literature identified by a number of authors who cite the necessity for real world case studies.
The outcomes of the case study clearly show that using DDMRP the company changed material management, resulting in higher visibility in the supply chain. Furthermore, the inventory level saw a significant reduction while material consumption increased. This was achieved without any reduction in the high service level of the company. Miclo et al. (2018) concluded that “there is something noticeable and worthwhile in DDMRP”. The results achieved in this work support this statement and are in line with the theoretical studies about DDMRP cited in the present paper.
More work will be needed to increase awareness of DDMRP. To this end it would be interesting to analyze more implementations in different sectors, as it would verify to what extent DDMRP improves logistical factors of companies while providing a competitive advantage.
Declaration of Conflicting Interests
The authors declared no potential conflicts of interest with respect to the research, authorship, and/or publication of this article.
Funding
The authors received no financial support for the research, authorship, and/or publication of this article.
References
Abuhilal, L., Rabadi, G., & Sousa-Poza, A. (2015). Supply chain inventory control: A comparison among JIT, MRP, and MRP with information sharing using simulation. Engineering Management Journal-Rolla-, 18(2), 51-57. https://doi.org/10.1080/10429247.2006.11431694
Amirjabbari, B., & Bhuiyan, N. (2014). Determining supply chain safety stock level and location. Journal of Industrial Engineering and Management, 7(1), 42-71. https://doi.org/10.3926/jiem.543
APICS (Ed.) (2016). APICS dictionary. The essential supply reference (15th ed.). Chicago, IL :APICS.
Barney, J.B., & Clark, D.N. (2007). Resource-based theory: Creating and sustaining competitive advantage. Oxford, New York: Oxford University Press.
Barratt, M., & Oke, A. (2007). Antecedents of supply chain visibility in retail supply chains: a resource-based theory perspective. Journal of Operations Management, 25(6), 1217-1233. https://doi.org/10.1016/j.jom.2007.01.003
Benton, W., & Shin, H. (1998). Manufacturing planning and control: The evolution of MRP and JIT integration. European Journal of Operational Research, 110(3), 411-440. https://doi.org/10.1016/S0377-2217(98)00080-0
Bower, J.L., & Hout, T.M. (1988). Fast-cycle capability for competitive power. Harvard Business Review, 66(6), 110-118.
Brennan, L., & Gupta, S. (1993). A structured analysis of material requirements planning systems under combined demand and supply uncertainty. The International Journal of Production Research, 31(7), 1689-1707.
https://doi.org/10.1080/00207549308956817
Cook, D.P. (1994). A simulation comparison of traditional, JIT, and TOC manufacturing systems in a flow shop with bottlenecks. Production and Inventory Management Journal, 35, 73-78.
Cox, J., & Schleier, J. (2010). Theory of constraints handbook. McGraw Hill Professional.
Chen, F., Drezner, Z., Ryan, J.K., & Simchi-Levi, D. (2000). Quantifying the bullwhip effect in a simple supply chain: the impact of forecasting, lead times, and information. Management Science, 46(3), 436-443.
https://doi.org/10.1287/mnsc.46.3.436.12069
Christopher, M. (2012). Logistics and supply chain management. Pearson UK.
De Massis, A., & Kotlar, J. (2014). The case study method in family business research: Guidelines for qualitative scholarship. Journal of Family Business Strategy, 5(1), 15-29. https://doi.org/10.1016/j.jfbs.2014.01.007
Eisenhardt, K.M. (1989). Building theories from case study research. Academy of management review, 14(4), 532-550. https://doi.org/10.5465/amr.1989.4308385
Guide Jr., V., & Srivastava, R. (2000). A review of techniques for buffering against uncertainty with MRP systems. Production Planning & Control, 11(3), 223-233. https://doi.org/10.1080/095372800232199
Hirschman, E.C. (1986). Humanistic inquiry in marketing research: philosophy, method, and criteria. Journal of marketing Research, 23, 237-249. https://doi.org/10.2307/3151482
Hoyt, J., & Huq, F. (2000). From arms-length to collaborative relationships in the supply chain: An evolutionary process. International Journal of Physical Distribution & Logistics Management, 30(9), 750-764.
https://doi.org/10.1108/09600030010351453
Huq, Z., & Huq, F. (1994). Embedding JIT in MRP: The case of job shops. Journal of Manufacturing Systems, 13(3), 153-164. https://doi.org/10.1016/0278-6125(94)90001-9
Hwa-Chung, S., & Snyder, C.A. (2000). ERP adoption: a technological evolution approach. International Journal of Agile Management Systems, 2(1), 24-32. https://doi.org/10.1108/14654650010312570
Ihme, M. (2015). Interpreting and applying demand driven MRP: a case study. (PhD thesis), Nottingham Trent University. Available at: http://irep.ntu.ac.uk/id/eprint/27704
Ihme, M., & Stratton, R. (2015). Evaluating demand driven MRP: a case based simulated study. Paper presented at the International Conference of the European Operations Management Association, Neuchatel, Switzerland. Available at: http://irep.ntu.ac.uk/id/eprint/26668
Jina, J., Bhattacharya, A.K., & Walton, A.D. (1997). Applying lean principles for high product variety and low volumes: Some issues and propositions. Logistics Information Management, 10(1), 5-13.
https://doi.org/10.1108/09576059710159655
Johnston, W.J., Leach, M.P., & Liu, A.H. (1999). Theory Testing Using Case Studies in Business-to-Business Research. Industrial Marketing Management, 28(3), 201-213. https://doi.org/10.1016/S0019-8501(98)00040-6
Jones, T.C., & Riley, D.W. (1985). Using inventory for competitive advantage through supply chain management. International Journal of Physical Distribution & Materials Management, 15(5), 16-26. https://doi.org/10.1108/eb014615 Krajewski, L.J., King, B.E., Ritzman, L.P., & Wong, D.S. (1987). Kanban, MRP, and shaping the manufacturing
environment. Management Science, 33(1), 39-57. https://doi.org/10.1287/mnsc.33.1.39
Lee, J.S., & Jang, S.Y. (2014). A system dynamics model to evaluate the performances of MRP and demand driven MRP. Journal of the Korean Society of Supply Chain Management, 14(2), 125-136.
Lutz, S., Löedding, H., & Wiendahl, H.-P. (2003). Logistics-oriented inventory analysis. International Journal of Production Economics, 85(2), 217-231. https://doi.org/10.1016/S0925-5273(03)00111-7
Mabin, V.J., & Balderstone, S.J. (2003). The performance of the theory of constraints methodology: analysis and discussion of successful TOC applications. International Journal of Operations & Production Management, 23(6), 568-595. https://doi.org/10.1108/01443570310476636
McKenna, R. (1990). Marketing is everything. Harvard Business Review, 69(1), 65-79.
Miclo, R. (2016). Challenging the “Demand Driven MRP” Promises: a Discrete Event Simulation Approach. (PhD thesis), Ecole Nationale des Mines d'Albi-Carmaux. Available at: http://tel.archives-ouvertes.fr/tel-01673811/document Miclo, R., Fontanili, F., Lauras, M., Lamothe, J., & Milian, B. (2015). MRP vs. demand-driven MRP: Towards an
objective comparison. Paper presented at the Industrial Engineering and Systems Management (IESM), 2015 International Conference Seville. Spain. https://doi.org/10.1109/IESM.2015.7380288
Miclo, R., Lauras, M., Fontanili, F., Lamothe, J., & Melnyk, S. A. (2018). Demand Driven MRP: assessment of a new approach to materials management. International Journal of Production Research, 1-16.
https://doi.org/10.1080/00207543.2018.1464230
Mohammadi, A., & Eneyo, E.S. (2012). Application of Drum-Buffer-Rope Methodology in Scheduling of Healthcare System. Paper presented at the POMS 23rd Annual Conference. Chicago, Illinois, U.S.A. https://www.pomsmeetings.org/confpapers/025/025-0592.pdf
Monden, Y. (1984). A simulation analysis of the japanese just in time technique (with kanbans) for a multiline, multistage production system: a comment. Decision Sciences, 15(3), 445-447. https://doi.org/10.1111/j.1540-5915.1984.tb01229.x
Mora-Monge, C.A., Caridi, M., Crippa, L., Perego, A., Sianesi, A., & Tumino, A. (2010). Measuring visibility to improve supply chain performance: a quantitative approach. Benchmarking: An International Journal, 17(4), 593-615. https://doi.org/10.1108/14635771011060602
Patton, M.Q. (1990). Qualitative evaluation and research methods. SAGE Publications.
Ptak, C., & Smith, C. (2011). Orlicky’s Material Requirements Planning (third ed.). McGraw Hill Professional. Ptak, C., & Smith, C. (2016). Demand Driven Material Requirements Planning (DDMRP). Industrial Press.
Rim, S.-C., Jiang, J., & Lee, C. (2014). Strategic Inventory Positioning for MTO Manufacturing Using ASR Lead Time. In Golinska, P. (Ed.), Logistics Operations, Supply Chain Management and Sustainability (441-456). Springer International Publishing. https://doi.org/10.1007/978-3-319-07287-6_31
Robson, C. (2002). Real world research: A resource for social scientists and practitioner-researchers (2). Blackwell Oxford. Rondeau, P., & Litteral, L.A. (2001). The evolution of manufacturing planning and control systems: From reorder
point to enterprise resource planning. Production and Inventory Management Journal, Second Quarter, 1-7.
Sarker, B.R., & Fitzsimmons, J.A. (1989). The performance of push and pull systems: a simulation and comparative study†. The International Journal of Production Research, 27(10), 1715-1731.
https://doi.org/10.1080/00207548908942650
Shankarnarayanan, S. (2000). ERP systems––using IT to gain a competitive advantage. Expressindia. Available at: http://www.expressinida.com/newads/bsl/advant.htm (Accessed: December 2015)
Shofa, M.J., & Widyarto, W.O. (2017). Effective production control in an automotive industry: MRP vs. demand-driven MRP. Paper presented at the AIP Conference Proceedings.https://doi.org/10.1063/1.4985449
Sugimori, Y., Kusunoki, K., Cho, F., & Uchikawa, S. (1977). Toyota production system and kanban system materialization of just-in-time and respect-for-human system. The International Journal Of Production Research 15(6), 553-564. https://doi.org/10.1080/00207547708943149
Umble, E.J., Haft, R.R., & Umble, M.M. (2003). Enterprise resource planning: Implementation procedures and critical success factors. European Journal of Operational Research, 146(2), 241-257. https://doi.org/10.1016/S0377-2217(02)00547-7
Vollmann, T.E., Berry, W.L., & Whybark, D.C. (1997). Manufacturing planning and control systems (4).
Wang, C., & Liu, X.-B. (2013). Integrated production planning and control: A multi-objective optimization model. Journal of Industrial Engineering and Management, 6(4), 815. https://doi.org/10.3926/jiem.771
Watson, K.J., Blackstone, J.H., & Gardiner, S.C. (2007). The evolution of a management philosophy: The theory of constraints. Journal of Operations Management, 25(2), 387-402. https://doi.org/10.1016/j.jom.2006.04.004
Wu, H.-H., Lee, A.H., & Tsai, T.-P. (2014). A two-level replenishment frequency model for TOC supply chain replenishment systems under capacity constraint. Computers & Industrial Engineering, 72, 152-159. https://doi.org/10.1016/j.cie.2014.03.006
Yin, R.K. (2009). Case study research: Design and methods (5). Sage.
Journal of Industrial Engineering and Management, 2018 (www.jiem.org)
Article’s contents are provided on an Attribution-Non Commercial 4.0 Creative commons International License. Readers are allowed to copy, distribute and communicate article’s contents, provided the author’s and Journal of Industrial Engineering and