22
Developing and Evaluating a Survey for
Representational Fluency in Science
Matthew Hilla, Manjula Sharmaa, John O’Byrnea, John Aireyb,c
Corresponding Author: [email protected]
aSchool of Physics, University of Sydney, Sydney, Camperdown NSW 2006, Australia b
Department of Languages, Linneaus University, Kalmar, Sweden
cDepartment of Physics and Astronomy, Uppsala University, Uppsala, Sweden
Keywords: multiple representations, communication, fluency, physics education, diagnostic
test
International Journal of Innovation in Science and Mathematics Education, 22(5), 22-42, 2014.
Abstract
Various representations, used for communication and problem solving in science, are an unspoken prerequisite for learning, understanding, and participating in scientific communities. Work has been done highlighting the importance of competence in particular multiple representations in science learning, the specific representational practices for the different disciplines, and to translating between representations. However, limited attention has been paid to obtaining a threshold level of ability in, not only one, but some combination of representations for a discipline. This notion leads to generic fluency with various representational forms used in science, with discipline specific expertise – representational fluency nuanced for a particular discipline. The aim of this study is to examine representational fluency nuanced for physics. This is achieved through the development of a survey instrument, the Representational Fluency Survey (RFS), consisting of representationally rich multiple choice items obtained predominantly from various validated sources. The survey was implemented with 334 students from first year to postgraduate at an Australian university to capture a cross-sectional snapshot of representational fluency nuanced for the specialization of physics. Reliability and validity were determined through standard statistical analysis and through consultation with experts. The results show that representation fluency develops across the years, and that there is a threshold associated with fluency. However, our study does not comment on causality. We demonstrate that in coalescing existing research on multiple representation while paying attention to disciplinary differences is a potentially fruitful pursuit. The RFS test of representational fluency in science is tailored to be used with university physics students but illustrates that adaption for other specializations may be possible.
Introduction
23
thus, this threshold ability to engage with the combination of science representations as one progresses within one disciplinary discourse.
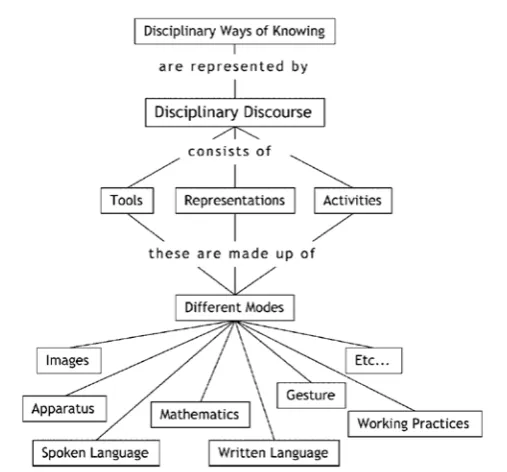
Figure 1: The different representational modes required for participation in a disciplinary discourse. These include images, spoken and written language, mathematics, gestures and working practices. Students must develop fluency in a ‘critical constellation’ of these modes to be a part of the community of discourse (Airey & Linder, 2009).
Within sciences, therefore, the multiple representations that make up disciplinary discourse are critical for understanding content, communicating, and for practices including modelling, problem solving and prediction to applications (Schwarz, Reiser, Davis, Kenyon, Acher, Fortus, Schwartz, Hug, & Krajcik, 2009).
24
question, using the representation. Of course the survey is for specialization in physics so there are more physics questions and there are subtleties associated with the interplay between the physics and the representation utilized. Our focus in providing all the content information is an attempt to keep content, including conceptual knowledge, somewhat independent of the multiple representational fluency that we are interested in.
This paper describes the development of the survey and its subsequent evaluation when used to investigate a group of undergraduate physics students’ fluency with representations.
The specific aims are to
• create a survey to measure scientific representational fluency amongst university physics students;
• evaluate the survey using relevant statistical analysis.
This study uses a mixed methods approach - quantitative data to statistically analyze the survey and qualitative data considering how students approach the questions.
Background
Multiple representations
This refers to the many ways that information can be presented. Examples of representations include the spoken or written word, symbols, equations and images (graphs, photographs, diagrams, maps, plans, charts, tables and statistics). Using appropriate representations can be helpful because they can be memorable (Aldrich & Sheppard, 2000), overcome cognitive load limitations (Ainsworth, 2006), and portray relationships where they are not obvious (Bowen, Roth, & McGuinn, 1999; Goldman, 2003). In addition, the construction of representations has also been linked with successes in learning science (Prain & Tytler, 2012). The more abstract representations can be seen as short-hand, condensed notation employed by a discipline in its discourse such that fluency with these is central to successfully entering the discipline (Vygotsky, 1978). Hence, due to the co-dependence of representational fluency and disciplinary learning, physics experts are more fluent than novices with physics multiple representations. However, to our knowledge, no attempt has been made to examine generic representational fluency and its interplay with subject specialization.
25
Dufresne et al. (2004) developed a teaching strategy to illustrate that the representations students choose to use are not always the ideal ones and to help students consider using non-algebraic representations when solving problems. University physics students were given problems and asked to solve them multiple times using strobe diagrams (a time-lapse representational format), algebra and graphs. The students commented that particular representations made solving the problem easier even though they wouldn’t have used that representation if they had the choice. This suggests that not only do students require a threshold level of ability in particular representations, but the ability to choose the most appropriate representation to generate a solution, that is to recognize the disciplinary affordances of the different representations (Airey & Linder, 2009; Fredlund et al., 2012), what we term representational fluency.
Representational Fluency
Aspects of representational fluency appear in the literature through three related perspectives. If visualization is defined as the process of making meaning out of representations,
metavisualisation is someone fluent in visualization, or able to “acquire, monitor, integrate, and extend, learning from representations” (Gilbert, 2008, p5-6). This perspective of representational fluency focuses on particular criteria including understanding of all
representations across three dimensions (1D such as equations, 2D such as most graphs, 3D such as physical objects) and three levels (macro, sub-micro and symbolic).
Metarepresentational competence (MRC) is another perspective of representational fluency. The primary focus of MRC is a metacognitive approach to representations where individuals are able to understand the rationale and design strategies of creating particular representations. Displays of MRC include the ability to create or invent new representations, to understand, explain and critique representations for adequacy of use and learning new representations quickly (diSessa, 2004). Representational Competence (Kohl & Finkelstein, 2005; Kohl & Finkelstein, 2006) looks more closely at the domain specific constellation of representations, working exclusively in physics, chemistry or biology. The term is also is used of ability in particular representations as opposed to cross-representational competence. However, multi-representational instruction and simulations have been identified as methods of developing representational competence (Stieff, 2011).
Representational fluency, as described in this paper, is an integration of these perspectives. There are elements of each perspective, such as the importance of translating between representations and making meaning in metavisualization, the metacognitive skills required for metarepresentational competence, and a recognition of domain specific representational competence. What is unique about representational fluency is that it is a cross-disciplinary threshold level of ability that incorporates a level of comfort (hence fluency) with using a variety of representations for a given purpose within a discipline of specialisation.
Diagnosing representational fluency
26
spectrum’ is observational data, including viewing student work and watching interviews which undoubtedly provides benefit and illumination, but does not allow for large scale quantitative comparisons of representational use and/or understanding across institutions and student groups (Fredlund et al., 2012; Rosengrant et al., 2006; Sia, Treagust, & Chandrasegaran, 2012). To date, there is no investigation into the development of representational use (and/or understandings) with incremental increases in disciplinary expertise, but there are studies that compare experts with novices. This paper attempts to fill this void by providing a cross sectional snapshot of representational fluency.
In contrast to small scale (often qualitative) studies such as those described above, diagnostic tests for large classes offer a different way of examining student competencies. Concept inventories have gained in popularity since the 1990s with the formation and extensive use of the Force Concept Inventory (FCI) (Hestenes et al., 1992). There have been extensive conceptual tests developed in a wide variety of disciplines. Concept inventories in physics and engineering may be the most varied and popular (Beichner, 1994; Ding, Chabay, Sherwood, & Beichner, 2006; Muller, Bewes, Sharma, & Reimann, 2008; Streveler et al., 2011; Tongchai, Sharma, Johnston, Arayathanitkul, & Soankwan, 2009).
One particular type of diagnostic test, using two-tiered multiple choice questions, examines not only student selections from multiple choices but also obtains their reasons for choosing their answer. These have been used to gain insight into student thinking on topics such as thermodynamics (Rollnick & Mahooana, 1999), biology (Haslam & Treagust, 1987), and logical thinking (Tobin & Capie, 1981). Three-tiered multiple choice surveys can also be found in the literature, typically adding student confidence as a further factor (Caleon & Subramaniam, 2010). Multi-tiered surveys have been shown to be a valid method of diagnosing student conceptual knowledge, specific misconceptions, and variables of student thinking (Tamir, 1989).
There are also a series of surveys focused on a single type of representational use, often in a particular context. Beichner’s survey on kinematic graphs investigates graphs but in a highly contextualized situation of interpreting kinematic questions (TUGK) (Beichner, 1994). Another recognized representation-based survey is the Purdue Spatial Visualization of Rotation (PSVT:R) test (Bodner, 1997) investigating spatial ability for introductory chemistry. These, along with the qualitative papers on representational reasoning with regards to individual questions (Fredlund et al., 2012), are all related to specific representations and not directly about the threshold level of ability in one or more representations necessary to access disciplinary discourse.
Therefore, the Representational Fluency Survey (RFS) presented in this paper is designed to be the first diagnostic test of the threshold level of ability in a range of representations necessary to access disciplinary discourse for the domain of university physics.
Iterative Development of the Survey
Philosophy of the Survey
27
subjects, the discourse within that discipline specializes too, such that a biology student is accustomed to a nuanced discourse within the sciences. In this study we focus on science multiple representations nuanced for a physics specialization. The problem questions on the survey are from across the sciences but have been selected for the physics specialization (see Appendix 1). Each problem contains all the explicit content including conceptual knowledge information necessary to answer the problem. This, combined with the choice of problems from different sciences, facilitates a level of decoupling of the multiple representations from explicit content including conceptual knowledge. The primary goal of the survey was therefore to examine physics students’ fluency with different representations somewhat decoupled from testing how well they know physics concepts.
This posed two key challenges. Firstly, which representations should be included and secondly, how will representational fluency be examined. “Representational fluency” is the threshold level of ability in, not only one, but a combination of representations, such as graphs, words, equations and diagrams, to effectively solve problems. This could involve solving problems (i) presented in a particular representational format, (ii) requiring a particular representational response, or (iii) allowing for alternative representations to help elucidate the information presented in a problem.
The representational reasoning selected from within the science discourse as providing affordances for the physics specialization are:
• Graph-based – A symbolic/visual representation
• Word-based – A linguistic representation
• Equation-based – A symbolic representation focused on arithmetical and algebraic equations
• Diagram-based – A visual representation
Problems were presented with different combinations of either graph-based and/or word-based representations but were designed so that all four sets of representations (and potentially others not listed) may be helpful for students to use during the process of solving the problem.
28
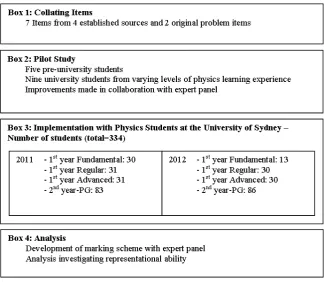
Figure 2: Flow chart summarizing the development and use of the survey. Collating items
Collating Items
The criteria for problem items (hereafter referred to as “items”) was for them to utilize representations from the science discourse with affordances for physics specialization. Furthermore, the items had to contain all the information necessary and require minimal extra content, including conceptual knowledge, such that every student doing the survey (covering all levels of physics student at university) would be able to answer correctly, provided that they could use the representations fluently. The items were to be typically multiple choice and allow for various pathways for students to get to the answer utilizing multiple representations.
It was initially decided not to generate items but to choose from those available and to scrutinize the existing data for those questions. The existing data included an item’s difficulty and discrimination from published and unpublished results, including local data (the known difficulty for some questions is presented in Table 1). After an extensive search through a range of question sets and surveys, four sources were used to generate a short list of nine possible items that met the required criteria. With permission, items were selected from the Rio Tinto Big Science Competition1 senior paper 2007, and The Australasian Schools Science Competition2
1
The Big Science Competition is run in many Australian, New Zealand and Singaporean high schools by Australian Science Innovations, a not for profit organization committed to providing high quality science extension programs for students and teachers. Further information on Australian Science Innovations can be found on their website:
2003 and 2004 papers. These papers are produced by established
29
academic organizations which undertake thorough testing with high school students validating the questions’ difficulty and discrimination. Three items were drawn from well established surveys in published literature. Two were selected from the Force and Motion Concept Survey (FMCS) (Thornton & Sokoloff, 1997), along with one item used by Beichner (1994) on testing student understanding of kinematic graphs (another established survey). Finally, two items were specially created, designed to allow for varied representational choices for how students gave an explanation in their answer.
The representations in the survey were in the format of three graph-based items (problems based around interpretations of graphs with some supporting words), three word-based items, two items involving both word and graph-based representations, and one item requiring the construction of a graph. Each had the capacity for students to include at least three different types of representations in their explanations of how they attained their answer (See Table 1). The items were compiled into an initial survey which was put through an iterative process of two pilot studies, and cross-checked by a panel of experts.
Pilot Study
To investigate whether the items were sufficiently decoupled from physics content including conceptual knowledge, the initial survey was administered to a group of students undertaking a preparatory program prior to studying science at University (Box 2 in Figure 2). They had limited background experience in physics or other science subjects. Based on the student responses, the suitability of each item was assessed by a panel of ten experts in the field of physics education research, five of whom have over thirty years of physics education experience. The assessment was based on the criteria that when students answered a question incorrectly, their explanations revealed that their misunderstandings were due to misreading the graphs or verbal information, or mistakes while working with various representations rather than their limited background in physics or science. This analysis of the pilot study supported the premise that the survey was successful in appropriately decoupling physics content, including conceptual knowledge from fluency with representations.
To further confirm that the questions had a sufficient difficulty and level of discrimination for undergraduate physics students, the survey was then deployed to 9 randomly selected university students covering various levels of undergraduate physics learning experience. Again, the expert panel was engaged in this process. On average, students answered 7.8 of the 9 questions correctly, which was higher than expected. There was a trend where students from higher levels of physics learning experience scored better than novice students. As a result, two items which had both a very high success rate, and where most students used the same representations in their explanation, were removed. This increased the sensitivity of the instrument and resulted in the seven items of the final survey. Once students’ explanations were taken into account, the difficulty and discrimination of the survey was deemed appropriate to be run with all levels of undergraduate physics students at the university.
Final survey
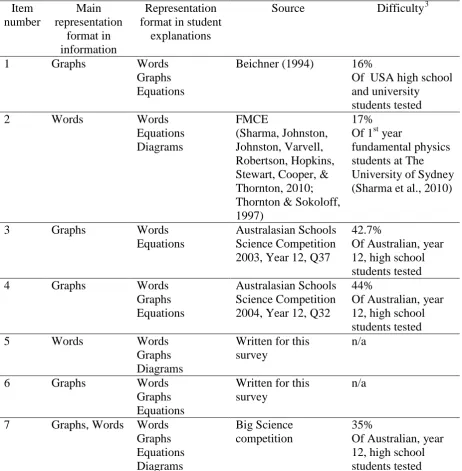
The link to the full survey can be found in Appendix 1 but it is summarized in Table 1, which describes the main representations which constitute the item, the most common representations utilized in student explanations, the original source, and difficulty from previous studies (Table 1). Each item is two-tiered (Haslam & Treagust, 1987) and a
30
tiered scoring scheme, as described below, has been utilised (a variation of (Caleon & Subramaniam, 2010).
Table 1: Summary of each item in the RFS
Item number Main representation format in information Representation format in student
explanations
Source Difficulty3
1 Graphs Words Graphs Equations
Beichner (1994) 16%
Of USA high school and university students tested
2 Words Words
Equations Diagrams FMCE (Sharma, Johnston, Johnston, Varvell, Robertson, Hopkins, Stewart, Cooper, & Thornton, 2010; Thornton & Sokoloff, 1997)
17% Of 1st year
fundamental physics students at The University of Sydney (Sharma et al., 2010)
3 Graphs Words Equations
Australasian Schools Science Competition 2003, Year 12, Q37
42.7%
Of Australian, year 12, high school students tested 4 Graphs Words
Graphs Equations
Australasian Schools Science Competition 2004, Year 12, Q32
44%
Of Australian, year 12, high school students tested
5 Words Words
Graphs Diagrams
Written for this survey
n/a
6 Graphs Words Graphs Equations
Written for this survey
n/a
7 Graphs, Words Words Graphs Equations Diagrams Big Science competition 35%
Of Australian, year 12, high school students tested
Analysing student responses: marking and coding
For each item, up to three marks were awarded corresponding to the three tiers. The criteria for success of each tier is:
1.1 Selecting the correct answer to the representationally rich multiple choice question (referred to as the student’s “answer”)
1.2 A scientifically congruent explanation (using any representation), relevant to the question and leading to the answer. It may not always end up producing the answer chosen by the student. (referred to as the student’s “explanation”)
3
31
1.3 Consistency between the chosen “answer” and the “explanation” in that the explanation leads to the selected multiple choice answer, further demonstrating representational fluency. (referred to as a “consistent/inconsistent explanation”)
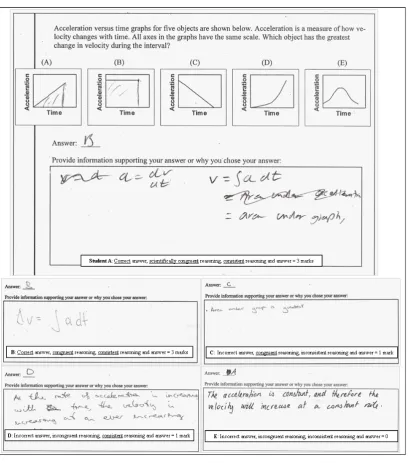
The items were presented one per page and, for each item, the page involved space where students were invited to “Provide information supporting your answer or why you chose your answer” (Figure 3). The exceptions were questions 4 and 6 (see appendix), although each had space where extra explanation was required.
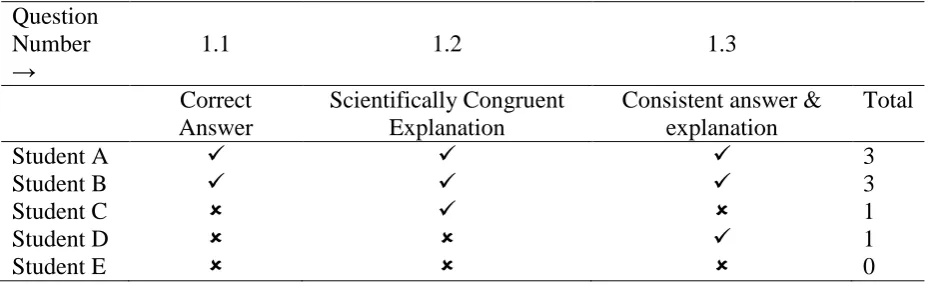
This multifaceted marking scheme allowed for examining the threshold level of ability in, not only one, but some combination of representations, that is a broad scale of representational fluency. A selection of five student responses for question 1 is presented and coded in Figure 3.
32
Table 2. Demonstration of the three-tier marking system. To be read with Figure 3.
Question Number
→ 1.1 1.2 1.3
Correct Answer
Scientifically Congruent Explanation
Consistent answer & explanation
Total
Student A 3
Student B 3
Student C 1
Student D 1
Student E 0
For this question, students who chose the correct multiple choice answer “B” demonstrated an ability to interpret the words of the question and the graphs presented for the possible answers (Student A and Student B). Those students who were also able to give a scientifically congruent explanation in any representations, consistent with their answer, would attain a full three marks for that item. In Figure 3, Student A uses correct equations and graphical representations (describing that they are looking at the “area under the graph”) and by filling in the area under graphs and Student B also uses a correct equation.
Student C did not choose the correct answer (chose “C”) but did offer a scientifically congruent explanation, “Area under graph is greatest”. Therefore Student C will attain one mark for the explanation, but neither marks for the answer or the consistency.
Similarly, Student D will receive only one mark. This student’s answer “D” was consistent with the explanation: “As the rate of acceleration is increasing with time, the velocity is increasing at an ever increasing rate”. But the answer was incorrect, and the explanation, while a true statement in the same context area as the question, was not in any way leading to the answer and therefore the second-tier mark could not be awarded.
Finally, Student E did not achieve a mark on any tier. The answer was incorrect, the explanation was not scientifically congruent, and there was no consistency between the explanation and the chosen answer.
From here on, it will be considered that the seven item survey had a total of 21 “questions” referred to as questions 1.1, 1.2, 1.3, 2.4, 2.5... 7.20, 7.21 etc, where the number before the point indicates the item and the second number indicates the question. This resulted in the survey being worth a maximum of 21 marks.
Implementation
The instrument was used with physics students from different levels of physics learning experience within undergraduate physics at The University of Sydney. The phrase “levels of physics learning experience” refers to the six different groups of students grouped according to the level of physics course being undertaken at university. The groups include 1st year fundamental, regular and advanced, 2nd year, 3rd year, and a postgraduate level masters equivalent cohort (PG).
33
anecdotal evidence, many students did not stay for the whole time for various reasons unrelated to the activity. Students in 1st and 2nd year completed the survey during a supervised laboratory session at the end of semester 1. The 3rd year students completed it in a supervised laboratory session at the start of the following semester. The postgraduate students were offered the survey in a controlled environment during the four week break between semesters. This process was repeated in 2011 and 2012 at the university.
On average, the response rate was 50%. Surveys which had more than one answer missing (that is, did not choose a final answer for more than one item) or surveys with more than two (2) explanations left uncompleted, did not meet the minimum criteria. These strict criteria ensured the validity of the implementation by focusing on only the students who were engaged at the same level. This allowed for the diversity of responses across the various levels of learning experience to be adequately compared. As a result, approximately 25% of the manuscripts conformed to the criteria and were used for analysis.
Z-tests to compare the final physics examination marks of students who completed the RFS manuscripts, according to the criteria above, with the full cohort showed that there was a low probability (P<0.15) that there was a self-selection bias amongst the students resulting in an uncharacteristic sample from the student groups.
Evaluation of the Survey
In this section, the validity and reliability of the RFS will be examined.
Validity
Validity is a process which will need to be continually assessed (Streveler et al., 2011) through the various future uses of the RFS to determine its suitability for various groups of students. Here the focus will be on content validity and face validity, as indicated by the development process, results of the survey, and interview data.
Content validity – The breadth of the questions covers the breadth of representational ability
As discussed earlier, there is considerable difficulty measuring a broad range of representational ability, with many researchers choosing to focus on individual representations, such as a particular form of graphs (e.g. Beichner (1994)). With the constraint of a 30 minute test, the maximum of 7 items limited the breadth of the items. Items were chosen such that various visual and verbal representations could be used to reach the answer. In particular, the graphs in items 1, 3, 4 and 7 are very different – using a kinematic graph, a column graph, a nomogram, and multiple two variable line graphs needing to be combined. This diversity, combined with the varied integration of words, from sparse (items 1 and 3), even (item 7), to only words (items 2 and 5), allows the measurement of a broad range of representational fluency.
34
Face validity –The questions appear to differentiate between students on the basis of some measure of their representational ability
Face validity was determined using three mechanisms: the criteria for item selection, comparisons to results from conceptual surveys, and interviews.
Firstly, the items were chosen to have low conceptual knowledge requirements to minimise the effect on the survey’s validity for assessing representational fluency. Some items had been selected from other tests already verified as examining a particular facet of representational ability. Finally, the explicit process of selecting representation-rich items was carried out in regular collaboration with the expert panel (including multiple individuals with over 30 years physics education experience).
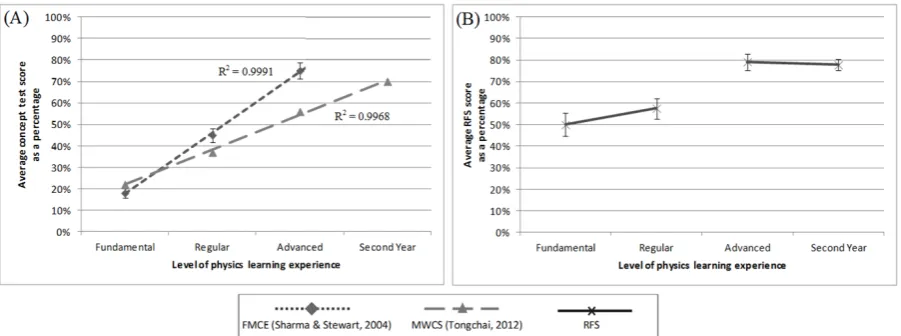
Secondly, RFS results were compared with results of surveys testing conceptual knowledge. The University of Sydney has been implementing the structure of separating the 1st year cohort into fundamental, regular and advanced students for 20 years. Research has shown that the groups performance on valid conceptual surveys (Tongchai, Sharma, Johnston, Arayathanitkul, & Soankwan, 2011) shows a linear trend, see Figure 4a.
Figure 4: (A) The average student mark from conceptual surveys. (B) The average student mark for the representational survey (RFS). Error bars, where available, depict
95% Confidence Intervals. The R2 values indicate the linear increase of conceptual
understanding across the four levels of physics learning experience rather than indicating a correlation between continuous data as normally used. The linearity of the concept test results across the four levels is not reflected in the RFS scores. Rather, we see two groups represented by the joining lines in figure (B).
35
Lastly, interviews were conducted with eleven 1st year regular students in 2013 at The University of Sydney. Students who had already completed the RFS under test conditions were given blank copies and asked to explain why particular questions were difficult. None of the students indicated that they did not have the appropriate content, including conceptual knowledge to solve any problem. The quotes below indicate that students’ difficulties were associated with interpretation and use of representations.
Student F referring to item 4: “(I) have never done this before, and never seen this graph before”
Student F referring to why item 7 was difficult: “The stimulus, with the written part describing the different types of dwellers and the graphs... I probably couldn’t put them together and synthesise that information”
Student G referring to item 5: “I tend to have struggle (sic) with problems where there is a whole bunch of stuff you have to integrate [interpret] that are presented in words... translating this text (to vectors) takes a lot more time”.
The interview results, together with the design and comparative analysis of results, support the thesis that the RFS has high face validity.
Reliability
The consistency, potential for repeatability and discrimination power of the survey were evaluated using four statistical tests (Tongchai et al., 2009): the difficulty index, discrimination index, point bisereal coefficient, and Chronbach’s alpha reliability index. The formulas and statistical methods for each index can be found in other publications of Ding et al. (2006; 2009) and Wuttiprom, Sharma, Johnston, Chitaree, & Soankwan (2009).
Difficulty index (P)
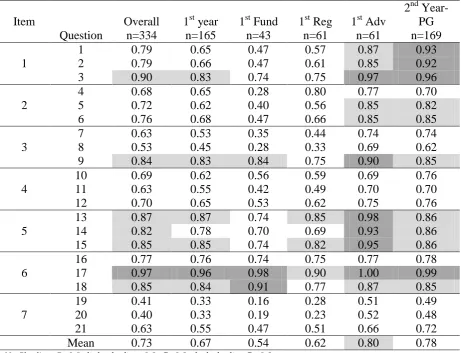
To function as a reliable diagnostic survey each question of the test, and the test as a whole, should not be too easy or too hard. The difficulty index is the fraction of the number of students in each group who answered the question correctly divided by the number of students who attempted the question. The lower the difficulty index (P) the more difficult the question. Typically, an acceptable difficulty index will be between 0.2 and 0.8 (Kubiszyn & Borich, 2003), though some argue that even questions with a difficulty of up to 0.9 are acceptable (Ding et al., 2006). See Table 3 for the difficulty index of each question of the RFS.
36
Table 3: Difficulty indices of each question separated for student groups
Item
Question
Overall n=334
1st year n=165
1st Fund n=43
1st Reg n=61
1st Adv n=61
2nd Year-PG n=169
1
1 0.79 0.65 0.47 0.57 0.87 0.93 2 0.79 0.66 0.47 0.61 0.85 0.92 3 0.90 0.83 0.74 0.75 0.97 0.96
2
4 0.68 0.65 0.28 0.80 0.77 0.70 5 0.72 0.62 0.40 0.56 0.85 0.82 6 0.76 0.68 0.47 0.66 0.85 0.85
3
7 0.63 0.53 0.35 0.44 0.74 0.74 8 0.53 0.45 0.28 0.33 0.69 0.62 9 0.84 0.83 0.84 0.75 0.90 0.85 10 0.69 0.62 0.56 0.59 0.69 0.76
4 11 0.63 0.55 0.42 0.49 0.70 0.70
12 0.70 0.65 0.53 0.62 0.75 0.76 13 0.87 0.87 0.74 0.85 0.98 0.86
5 14 0.82 0.78 0.70 0.69 0.93 0.86
15 0.85 0.85 0.74 0.82 0.95 0.86 16 0.77 0.76 0.74 0.75 0.77 0.78
6 17 0.97 0.96 0.98 0.90 1.00 0.99
18 0.85 0.84 0.91 0.77 0.87 0.85 19 0.41 0.33 0.16 0.28 0.51 0.49
7 20 0.40 0.33 0.19 0.23 0.52 0.48
21 0.63 0.55 0.47 0.51 0.66 0.72 Mean 0.73 0.67 0.54 0.62 0.80 0.78
No Shading, P≤0.8; light shading, 0.8<P≤0.9, dark shading P>0.9
Discrimination index (D)
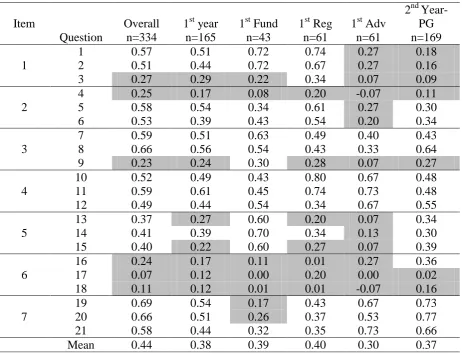
Discrimination is important for diagnostic surveys as it allows the students who have a representational fluency to be clearly distinguished from the students who do not. It is measured by subtracting the difficulty index individual questions for the students within each group who scored in the top 25% and bottom 25% on the overall RFS. Questions with little or no discrimination (D<0.3) are deemed unhelpful in contributing to a meaningful total score. Table 4 presents the discrimination indices for each question.
37
Table 4: Discrimination indices of each question separated for student groups
Item
Question
Overall n=334
1st year n=165
1st Fund n=43
1st Reg n=61
1st Adv n=61
2nd Year-PG n=169
1
1 0.57 0.51 0.72 0.74 0.27 0.18 2 0.51 0.44 0.72 0.67 0.27 0.16 3 0.27 0.29 0.22 0.34 0.07 0.09
2
4 0.25 0.17 0.08 0.20 -0.07 0.11 5 0.58 0.54 0.34 0.61 0.27 0.30 6 0.53 0.39 0.43 0.54 0.20 0.34
3
7 0.59 0.51 0.63 0.49 0.40 0.43 8 0.66 0.56 0.54 0.43 0.33 0.64 9 0.23 0.24 0.30 0.28 0.07 0.27 10 0.52 0.49 0.43 0.80 0.67 0.48
4 11 0.59 0.61 0.45 0.74 0.73 0.48
12 0.49 0.44 0.54 0.34 0.67 0.55 13 0.37 0.27 0.60 0.20 0.07 0.34
5 14 0.41 0.39 0.70 0.34 0.13 0.30
15 0.40 0.22 0.60 0.27 0.07 0.39 16 0.24 0.17 0.11 0.01 0.27 0.36
6 17 0.07 0.12 0.00 0.20 0.00 0.02
18 0.11 0.12 0.01 0.01 -0.07 0.16 19 0.69 0.54 0.17 0.43 0.67 0.73
7 20 0.66 0.51 0.26 0.37 0.53 0.77
21 0.58 0.44 0.32 0.35 0.73 0.66 Mean 0.44 0.38 0.39 0.40 0.30 0.37
No Shading, D≥0.3; Shading, D<0.3
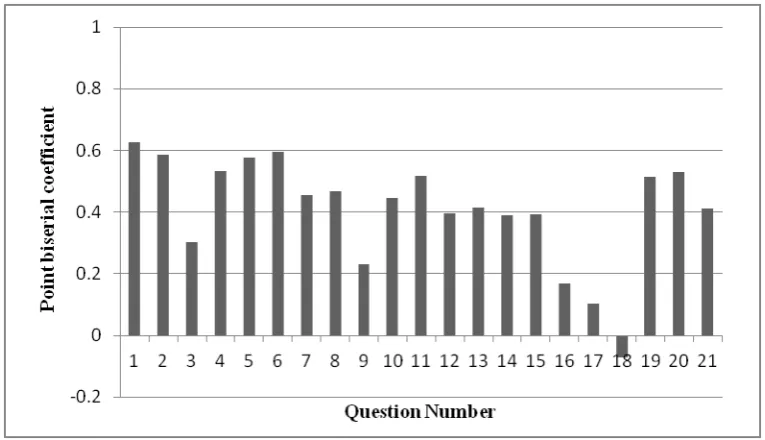
Point biserial coefficient (rpbs)
The point biserial coefficient indicates the consistency of results between individual questions and the survey as a whole. A high value of rpbs for a particular question indicates
that a student who gets a high score on the survey is likely to get that question correct. Criteria of rpbs≥0.2 is generally considered adequate. Figure 5 shows the point biserial
coefficients for each question.
The three questions which have rpbs<0.2 are all from the same item, questions 6.16, 6.17 and
6.18. Item 6 has also returned non-ideal results for each of the previous statistical tests. All other questions are above the threshold of 0.2. Excluding question 6, the average is rpbs=0.47
38
Figure 5. Point biserial coefficients for each question
Chronbach’s alpha reliability index
Another measure of internal consistency, Chronbach’s alpha takes into account multiple questions when correlating with the total score. An alpha ≥0.7 is generally considered adequate. The values of alpha for the survey are presented in Table 5. Item 6 was excluded from this analysis due to low discrimination and point biserial coefficient. For each student group, the value of Chronbach’s alpha is high and the overall value of 0.78 indicates a high level of internal consistency on the survey.
Table 5: Chronbach's alpha reliability indices separated for student groups
Overall n=334
1st Fund n=43
1st Reg n=61
1st Adv n=61
2nd Year-PG n=169
0.78 0.67 0.69 0.64 0.71
Discussion
We have described the formation and evaluation of the RFS designed to test the fluency of physics students in science representations. The survey was verified through consultation with experts and also through the observations by students when reflecting on what made the survey difficult. Student observations were that items 4 and 7 were the most difficult, consistent with the numerical results, and that the reason for the difficulty was often due to not understanding representations along the lines of not having a threshold level of ability to engage with the necessary combination of representations. The questions associated with these items also had high discrimination indices along with all other questions, except those associated with item 6.
39
questions. It is therefore recommended that item 6 be removed from analysis as it does not meet the required criteria for a reliable item in the RFS.
While item 6 is not reliable for the RFS, its use may still provide benefit in other areas. Many research projects have involved cataloguing and recording student representational use and drawing and interpreting graphs is just one example of where this is possible. Observation of student manuscripts for item 6 highlighted various interesting trends, including differing reactions among students to dealing with outliers in data. Dealing with real data is often unusual for new students who are used to the conforming data often presented in high school (particularly mathematics) (Bowen & Roth, 2005). Therefore, depending on the objectives, a researcher may decide to retain item 6 for alternative analysis.
Another consideration for a researcher or educator is whether the difficulty and discrimination suits the intended cohort, as a particular threshold level of ability is necessary to access disciplinary discourse for different cohorts. This paper has shown the RFS is optimized for first year university students. There is still clear and helpful information for more senior years of university physics but care will need to be taken.
The results presented in figure 4 reveal that the level of representational fluency across different levels of physics learning experience at The University of Sydney does not correlate with scores on conceptual surveys. Most notably is the distinct difference in RFS scores between the lower and upper two groups. The 1st year Regular students have a similar representational ability to the 1st year Fundamental students who have studied two years less of high school physics. Furthermore, the 1st year advanced students and 2nd year students have no difference in scores. This supports the existence of a critical constellation of representational modes required for participation in the discipline (Airey & Linder, 2009) and affirms the premise of the RFS.
Further Research
There are multiple other ways to analyze student answers to the RFS. These include coding for which a particular representation is used, and creating novel ways to present trends in representational use across various questions and groups of students. Preliminary analysis indicates that these further support the notion that the RFS is truly a test of representational fluency. In addition to this, the results of the RFS, particularly the way that expert students chose to use representations in completing the items, have been used to inform research and practice at The University of Sydney, including the creation of online teaching supplements designed to target and improve student representational use. In 2013, the authors have used the RFS as a set of tests (pre and post) to measure first year student gains in representational fluency across a semester of university physics. This highlights the diversity of use of the survey in influencing practice and measuring the effectiveness of teaching activities.
40
suggest that there are elements in the survey that may be generalizable to other scientific domains and that the survey has the potential to be adapted to suit the needs of research and teaching further afield as the requirement of representational fluency is not unique to physics. We do, however, recommend that care is taken, and the motivation and processes presented in this paper are considered.
Conclusion
In this study, we developed a robust survey to measure representational fluency in science for university physics students. The design was optimised to combine elements of representational fluency in order to compare representational use amongst individuals or groups. The survey has been tested with students of various levels of physics learning experience, undergraduates to postgraduates. Through pilot studies, and standard statistical analysis of the main implementation, the final survey is a valid and reliable measure of scientific representational fluency and can therefore be used by instructors to measure the development of representational skills of students at different stages of their time at university, or to evaluate the effectiveness of teaching strategies to improve representational fluency.
References
Ainsworth, S. (2006). DeFT: A conceptual framework for considering learning with multiple representations.
Learning and Instruction, 16(3), 183-198. doi: 10.1016/j.learninstruc.2006.03.001
Airey, J. (2009). Science, Language and Literacy. Case Studies of Learning in Swedish University Physics. Acta Universitatis Upsaliensis. Uppsala Dissertations from the Facutly of Science and Technology 81. Uppsala Retrieved 2009-04-27, from http://publications.uu.se/theses/abstract.xsql?dbid=9547
Airey, J., & Linder, C. (2009). A Disciplinary Discourse Perspective on University Science Learning: Achieving Fluency in a Critical Constellation of Modes. Journal of Research in Science Teaching, 46(1), 27-49. doi: 10.1002/tea.20265
Aldrich, F., & Sheppard, L. (2000). 'Graphicacy': the fourth 'R'? Primary Science Review, 64, 8-11.
Beichner, R. J. (1994). Testing student interpretation of kinematic graphs. American Journal of Physics, 62(8), 750-762. doi: 10.1119/1.17449
Bodner, G. M., & Guay, R. B. (1997). The Perdue Visualization of Rotations Test. Chemichal Educator, 2(4), 1-17. doi: 10.1007/s00897970138a
Bowen, G. M., Roth, W., & McGuinn, M. K. (1999). Interpretations of graphs by university biology students and practicing scientists: Toward a social practice view of scientific representation practices. Journal of Research in Science Teaching, 36(9), 1020-1043. doi:
10.1002/(SICI)1098-2736(199911)36:9<1020::AID-TEA4>3.0.CO;2-#
Bowen, G. M., & Roth, W. M. (2005). Data and graph interpretation practices among preservice science teachers. Journal of Research in Science Teaching, 42(10), 1063-1088. doi: 10.1002/tea.20086
Caleon, I., & Subramaniam, R. (2010). Development and Application of a Three-Tier Diagnostic Test to Assess Secondary Students' Understanding of Waves. International Journal of Science Education, 32(7), 939-961. doi: 10.1080/09500690902890130
Chi, M. T., Feltovich, P. J., & Glaser, R. (1981). Categorization and representation of physics problems by experts and novices. Cognitive Science, 5, 32.
De Jong, R., & Ferguson-Hessler, M. (1986). Cognitive structures of good and poor novice problem-solvers in physics. Journal of Educational Psychology, 78(4), 10. doi. 10.1037//0022-0663.78.4.279
De Jong, R., & Ferguson-Hessler, M. (1991). Knowledge of problem situations in physics: a comparison of good and poor novice problem-solvers. Learning and Instruction, 1(4), 14.
Ding, L., Chabay, R., Sherwood, B., & Beichner, R. (2006). Evaluating an electricity and magnetism assessment tool: Brief electricity and magnetism assessment. Physical Review Special Topics-Physics Education Research, 2(1). doi: 10.1103/PhysRevSTPER.2.010105
41
Driver, R., Asoko, H., Leach, J., Mortimer, E., Scott, P. (1994). Constructing Scientific Knowledge in the Classroom. Educational Researcher, 23(7), 5-12. doi. 10.3102/0013189X023007005
Dufresne, R. J., Gerace, W. J., & Leonard, W. J. (2004). Solving Physics Problems with Multiple
Representations. Department of Physics & Astronomy and Scientific Reasoning Research Institute. University of Massachusetts.
Fredlund, T., Airey, J., & Linder, C. (2012). Exploring the role of physics representations: an illustrative example from students sharing knowledge about refraction. European Journal of Physics, 33(3), 657-666. doi: 10.1088/0143-0807/33/3/657
Gilbert, J. K. (2008). Visualization: An Emergent Field of Practice and Enquiry in Science Education. In J. K. Gilbert, R. Miriam & M. Nakhleh (Eds.), Visualization: Theory and Practice in Science Education (pp. 3-24): Springer.
Goldman, S. R. (2003). Learning in complex domains: when and why do multiple representations help?
Learning and Instruction, 13(2), 239-244. doi: 10.1016/s0959-4752(02)00023-3
Haslam, F., & Treagust, D. F. (1987). Diagnosing Secondary Students Misconceptions of Photosynthesis and Respiration in Plants using a 2-Tier Multiple-Choice Instrument. Journal of Biological Education, 21(3), 203-211. doi: 10.1080/00219266.1987.9654897
Hestenes, D., Wells, M., Swackhamer, G. (1992). Force Concept Inventory. The Physics Teacher, 30, 141-158. doi: 10.1119/1.2343497
Kohl, P., & Finkelstein, N. (2005). Student representational competence and self-assessment when solving phyiscs problems. Physical Review Special Topics-Physics Education Research, 1(1), doi: 10.1103/PhysRevSTPER.1.010104
Kohl, P., & Finkelstein, N. (2006). Student representational competence and the role of instructional environment in introductory physics. In P. Heron, L. McCullough & J. Marx (Eds.), 2005 Physics Education Research Conference (Vol. 818, pp. 93-96). doi. 10.1063/1.2177031
Kohl, P., & Finkelstein, N. D. (2008). Patterns of multiple representation use by experts and novices during physics problem solving. Physical Review Special Topics-Physics Education Research, 4(1). doi: 10.1103/PhysRevSTPER.4.010111
Kozma, R. (2003). The material features of multiple representations and their cognitive and social affordances for science understanding. Learning and Instruction, 13(2), 205-226. doi:
10.1016/s0959-4752(02)00021-x
Kubiszyn, T., & Borich, G. D. (2003). Educational testing and measurement: Classroom application and practice (7th ed.). Wiley
Larkin, J., McDermott, J., Simon, D. P., & Simon, H. A. (1980). Expert and Novice Performance In Solving Physics Problems. Science, 208(4450), 1335-1342. 10.1126/science.208.4450.1335
Larkin, J. H., McDermott, J., Simon, D. P., & Simon, H. A. (1980). Models of Competence in Solving Physics Problems. Cognitive Science, 4(4), 317-345. doi: 10.1016/s0364-0213(80)80008-5
Meltzer, D. E. (2005). Relation between students' problem-solving performance and representational format.
American Journal of Physics, 73(5), 463-478. doi: 10.1119/1.1862636
Muller, A., Bewes, J., Sharma, M. D., & Reimann, P. (2008). Saying the wrong thing: improving learning with multimedia by including misconceptions. Journal of Computer Assisted Learning, 24(2), 144-155. doi: 10.1111/j.1365-2729.2007.00248.x
Prain, V., & Tytler, R. (2012). Learning Through Constructing Representations in Science: A framework of representational construction affordances. International Journal of Science Education, 34(17), 2751-2773. doi: 10.1080/09500693.2011.626462
Rollnick, M., & Mahooana, P. P. (1999). A quick and effective way of diagnosing student difficulties: two tier from simple multiple choice questions. South African Journal of Chemistry-Suid-Afrikaanse Tydskrif Vir Chemie, 52(4), 161-164. http://journals.sabinet.co.za/ej/ejour_chem.html
Rosengrant, D., Van Heuvelen, A., & Etkina, E. (2006). Case study: Students' use of multiple representations in problem solving. 2005 Physics Education Research Conference, 818, 49-52. doi. 10.1063/1.2177020 Schwarz, C. V., Reiser, B. J., Davis, E. A., Kenyon, L., Acher, A., Fortus, D., Shwartz, Y., Hug, B., & Krajcik,
J. (2009). Developing a Learning Progression for Scientific Modeling: Making Scientific Modeling Accessible and Meaningful for Learners. Journal of Research in Science Teaching, 46(6), 632-654. doi: 10.1002/tea.20311
Sharma, M., & Stewart, C. (2004). Exploring the differences between students trained under the old and new HSC syllabuses. Paper presented at the 11th Biennial Science Teachers' Workshop, Sydney. Unpublished Manuscript
42
Sia, D. T., Treagust, D. F., & Chandrasegaran, A. L. (2012). High School Students' Proficiency and Confidence Levels in Displaying Their Understanding of Basic Electrolysis Concepts. International Journal of Science and Mathematics Education, 10(6), 1325-1345. doi: 10.1007/s10763-012-9338-z
Stieff, M., Hegarty, M., Deslongchamps, G. (2011). Identifying Representational Competence With Multi-Representational Displays, Cognition and Instruction, 29(1), 123-145. doi:
10.1080/07370008.2010.507318
Streveler, R. A., Miller, R. L., Santiago-Roman, A. I., Nelson, M. A., Geist, M. R., & Olds, B. M. (2011). Rigorous Methodology for Concept Inventory Development: Using the 'Assessment Triangle' to Develop and Test the Thermal and Transport Science Concept Inventory (TTCI). International Journal of Engineering Education, 27(5), 968-984.
Tamir, P. (1989). Some Issues Related to the Use of Justifications to Multiple-Choice Answers. Journal of Biological Education, 23(4), 285-292. doi: 10.1080/00219266.1989.9655083
Thornton, R. K., & Sokoloff, D. R. (1997). Assessing student learning of Newton’s laws: The Force and Motion Conceptual Evaluation and the Evaluation of Active Learning Laboratory and Lecture Curricula.
American Journal of Physics, 66(4), 338-352. doi. 10.1119/1.18863
Tobin, K. G., & Capie, W. (1981). The Development and Validation of a Group Test of Logical Thinking.
Educational and Psychological Measurement, 41(2), 413-423. doi: 10.1177/001316448104100220 Tongchai, A., Sharma, M. D., Johnston, I. D., Arayathanitkul, K., & Soankwan, C. (2009). Developing,
Evaluating and Demonstrating the Use of a Conceptual Survey in Mechanical Waves. International Journal of Science Education, 31(18), 2437-2457. doi: 10.1080/09500690802389605
Tongchai, A., Sharma, M. D., Johnston, I. D., Arayathanitkul, K., & Soankwan, C. (2011). Consistency of students' conceptions of wave propagation: Findings from a conceptual survey in mechanical waves.
Physical Review Special Topics-Physics Education Research, 7(2). doi: 10.1103/PhysRevSTPER.7.020101
Vygotsky, L. (1978). Interaction between Learning and Development (pp. 79-91). In Mind in Society. (Trans. M. Cole). Cambridge, MA: Harvard University Press.
Woolnough, J. (2000). How do Students Learn to Apply Their Mathematical Knowledge to Interpret Graphs in Physics? Research in Science Education, 30(3), 259-267. doi. 10.1007/BF02461633
Wuttiprom, S., Sharma, M. D., Johnston, I. D., Chitaree, R., & Soankwan, C. (2009). Development and Use of a Conceptual Survey in Introductory Quantum Physics. International Journal of Science Education, 31(5), 631-654. doi: 10.1080/09500690701747226