Strategic Mass Killings
Joan Esteban
y, Massimo Morelli
zand Dominic Rohner
xFebruary 7, 2014
Abstract
We provide a model of con‡ict and mass killing decisions, to identify
the key variables and situations that make mass killings more likely to
occur. We predict that mass killings are most likely in countries with large
amounts of natural resource rents, polarization, institutional constraints
regarding rent sharing, and low productivity of labor. The role of resources
like oil, gas and diamonds and other key determinants of mass killings is
con…rmed by our empirical results based on country level as well as ethnic
group level analysis.
JEL codes: C73, D74, F51, O12, Q34.
Keywords: Mass Killings, Civil War, Natural Resources, Rent Sharing,
Power.
This draft: February 2014; …rst draft: June 2010.
We wish to thank Carmen Beviá, Paola Conconi, Alex Debbs, Oeindrila Dube, Jon Eguia, Mark Harrison, Macartan Humphreys, Johannes Horner, Navin Kartik, Leandro Magalhaes, Kalle Moene, Costantino Pischedda, Carlo Prato, Debraj Ray, Ken Sheeve, Jonah Schulhofer-Wohl, Tomas Sjöström, Mathias Thoenig, Nils Weidmann, Alexander Wolitzky, Pierre Yared, Fabrizio Zilibotti, three anonymous referees and especially Canice Prendergast for very useful comments. We would also like to thank workshop and seminar participants at EUI, Columbia, NYU, Yale, Princeton, Oslo, LSE, Warwick, ECARES, IMT, Dehli, Barcelona, Madrid, Zurich and Lausanne for stimulating questions, and David Schönholzer, Borek Vasicek, and Peter Van der Windt for excellent research assistance. The usual disclaimer applies.
Joan Esteban gratefully acknowledges …nancial support from the AXA Research Fund and from the Spanish Government CICYT project n. SEJ2006-00369. Massimo Morelli gratefully acknowledges …nancial support by the Program for Economic Research at Columbia Univer-sity. Dominic Rohner is grateful for the …nancial support from the Swiss National Science Foundation (SNF grant no. 100014-122636).
yInstitut d’Analisis Economica, CSIC and Barcelona GSE. Email: [email protected]. zColumbia University, Department of Political Science and Department of Economics. Email: [email protected].
1
Introduction
Mass killings of civilians are obviously a serious problem.1 Since World War II
some 50 episodes of mass killings have led to between 12 and 25 million civilian casualties (Political Instability Task Force 2010)2 and by 2008 have induced the
displacement of 42 million people (UNHCR, 2009).
Surprisingly, while there is an increasing number of formal models of civil and interstate wars,3 the issues of mass killings and forced displacements of
civilians have so far been largely neglected as far as formal rational explana-tions are concerned. Mass killings may have di¤erent causes, motivaexplana-tions and implications with respect to other forms of violent confrontation, and may well be regarded as the manifestation of the worst of the human being. Even though hatred and uncontrolled passion can certainly play a big role, in Mann’s (2005: 9, 31) words, “to understand ethnic cleansing we need a sociology of power more than a special psychology of perpetrators as disturbed or psychotic people — though some may be. (...) All cases of cleansing involve material interests. Usually, members of an ethnic group come to believe they have a collective economic interest against an out-group.” Also Chirot and McCauley (2006: 5) argue "that most political massacres are quite deliberate, are directed by or at least approved by the authorities, and that they have a goal (...)." These authors "take the position that mass killing is neither irrational nor in any sense ’crazy’" (2006: 7). Like the explanation of wars, the explanation of some mass killing episodes requires reference to history, ideological clashes, religious cleavages and alike but the presence of such cleavage-related motivations alone cannot explain why in their presence there are cases in which mass killings take place and other cases in which they do not. A rationalist explanation of mass killing decisions can be crucial for this type of positive analysis even when material incentives are not the sole motivations. One of the points of this paper is to also show that indeed the quantitative signi…cance of material interests (mostly related to natural resource rents, as we will see) can predict mass killing events. We examine whether decisions to exterminate the opponents can be explained as the result of strategic, rational calculation, independently of how these decisions
1We adopt the de…nition in Charny (1999: 7) and Easterly, Gatti and Kurlat (2006: 132):
“Mass killings are the killings of substantial numbers of human beings, when not in the course of military action against the military forces of an avowed enemy, under the conditions of the essential defenselessness and helplessness of the victims”. In the literature this class of phenomena is referred to sometimes as genocide, democide or politicide, but each of these words takes a more speci…c meaning, and we have opted for the more encompassing term mass killing.
2The estimates of how many civilian fatalities have fallen in this category vary a lot because
of the di¢ culties in identifying degrees of intentionality and targeting, but they are substantial by any standard. In contrast with the estimate by the “Political Instability Task Force”, Bae and Ott (2008) use even larger numbers: The con‡ict-related deaths in the 20th century were as large as 109.7 millions, corresponding to 4.35 percent of the world population. Of these, 60 percent were civilian non-combatants.
3See Blattman and Miguel (2010) for a survey on civil war, while the classic article by
had been framed.
The recent case of mass killings in Sudan’s Darfur region that started in 2003 illustrates the key features we wish to capture. Two features are essential: 1)
Identi…able groups: The primary perpetrators of the killings and expulsions in Darfur are government-backed “Arab” militias. The main civilian victims are black “Africans” (Straus, 2005: 123). 2)Resource wealth and low productivity in other sectors: The early 21st century was characterized by natural resource shocks (Sudan becomes an increasingly important oil producer). At the same time productivity and state capacity of Sudan remained very low. These two factors4 led to an explosive blend that made the mass killings in Darfur possible.
The estimates of the death toll vary between 70,000 and 400,000 fatalities, with an estimated 1.8 million people displaced (Straus, 2005, 2006; Waal, 2007). This corresponds to a signi…cant fraction of the total population in this region, which was about 6.5 million before the outbreak of the crisis. The killings were clearly strategic, “directed by the state, targeted at a particular ethnic population, and intended to destroy that ethnic population in substantial part” (Straus, 2006: 43). We are going to stress the importance of ethnic group size and natural resources in general for this type of extreme strategic mass killings, both theoretically and empirically.
Reducing the population size of the opponent group – by extermination and/or exile5 – allows the perpetrator to obtain a larger share in the future
distribution of surplus. This incentive is particularly relevant within countries with well de…ned ethnic groups and where the government is basically controlled by one of them.
Given the above motivation, we introduce a formal model with the following characteristics: the population is divided in two identi…able groups6 and one
of them initially controls the government. In every period of the game the two groups decide whether to go to war with each other or not, and peace obviously prevails if and only if both groups choose to maintain peace. Whoever is in power at the end of a period, power conquered or kept, decides unilaterally the distribution of the surplus of that period’s production as well as whether or not
4Among the other factors, an unfortunately crucial one is that it became increasingly
clear that the international community would be hesitant to rapidly and forcefully intervene (Straus, 2005; 2006; Waal, 2007).
5Mass killings have the multiplier e¤ect of triggering massive refugee ‡ows. Hence, while
the focus of our paper is on the incentives and logic behind mass killings, the possibility of a larger multiplier e¤ect, caused for example by the vicinity of a country expected to keep open borders, could constitute an incentive ampli…cation factor, to be considered in future work about the dynamics of forced migration. However, if a government tries to displace minority groups without killings, the underlying logic is somewhat di¤erent (as clari…ed below), because killings are irreversible, while displaced populations are often looking for opportunities to return or retaliate.
6These groups could be identi…ed by any of the dividing lines in society, ethnicity, religion,
to commit mass killings. In other words, each period’s key stages are a war-peace decision and the subsequent exercise of power by the group that either conquered or kept power, with or without war. We will analyze …rst the unlim-ited power benchmark, where the only limits to exploitation and elimination of opponents are endogenous ones, determined by an explicit consideration of the continuation game. The analysis will then be generalized to include the possi-bility ofexogenous bounds to the exercise of power, both in terms of restrictions in revenue sharing, and in terms of mass killing consequences and feasibility.
The decision about how to share the current surplus is constrained by the rebellion outside option (the endogenous constraint),7 and at the same time
there may be international, normative, or institutional constraints against unfair surplus sharing. The fact that mass killings is one possible exercise of power creates an additional reason to rebel, in the “shadow of mass killings”. The fear of exploitation or mass killings play di¤erent roles in di¤erent contexts, and our goal is to characterize the precise conditions on regime, population size, group polarization, and economic structure that could induce even the best possible equilibrium to include con‡ict and violence against civilians.
We characterize the best Subgame Perfect Equilibrium of the in…nite horizon game between the two groups for every set of parameters, and we obtain the robust prediction that the likelihood of mass killings is increasing in natural resource abundance and decreasing in labor productivity and destruction costs of war. Moreover, we …nd that group polarization increases the likelihood of mass killings, whereas an increase in population size (keeping polarization constant) reduces the probability of such events. Finally, we …nd that a tightening of institutional constraints to distributive power increases the probability of mass killings whenever the constraint binds, whereas the e¤ects of a tightening of the constraints on the power to kill are ambiguous.
The main trade-o¤ for a group holding power when deciding about the pros and cons of using the power to kill is as follows. The elimination of minority members in the present reduces the future constraints on future surplus sharing, but on the other hand reduces future production in labor intensive sectors, hence the trade-o¤ is intuitively a¤ected by the relative preponderance of natural resources.
Starting from a situation in which the institutional constraints to unfairness in surplus sharing are limited (for example starting from an e¤ective dictator-ship), an increase in the institutional lower bound to unfairness (for example caused by greater checks and balances typical of a democratization process) can have ambiguous e¤ects on violence: on the one hand, an exogenous increase in institutional constraints to unfairness obviously reduces the motivations to rebel; on the other hand, such a change in the institutional constraints a¤ects
7Like in Powell (1996), unfair treatment can cause war if combined with the expectation
the calculations in the trade-o¤ mentioned above in the direction of making mass killings more likely.
Inspired by our theoretical model and by its predictions, we present an em-pirical analysis of mass killings, studying the e¤ects of natural resource rents and all the other key variables of the theory, at the country and ethnic group levels. To the best of our knowledge, there has not been a comprehensive study in the literature before ours of the impact of natural resources on mass killings at the country level, and we are also the …rst ones to study massacres with an ethnic group panel.
As suggested by the theory, our empirical analysis con…rms that natural resource rents are a robust and very signi…cant predictor of mass killings,8 while
a high labor productivity is found to discourage massacres. Mass killings are also signi…cantly more likely in small,9 ethnically polarized countries.
Further, we …nd that –when controlling for the country characteristics–eth-nic groups are signi…cantly more likely to be massacred if they are relatively small and resource-rich, which is in line with our theory. In contrast, these …ndings are not easy to reconcile with alternative mechanisms suggesting for example that oil may fuel mass killings by making oil-rich groups more power-ful. If this alternative explanation were driving the correlation between oil and mass killings, we should expect oil-poor groups to be the main targets, which contradicts our empirical results.
The paper is organized as follows: In section 2 we discuss the main elements that need to be considered in the analysis of mass killings and we relate our predictions and …ndings to the existing literature; in section 3 we introduce our model; in sections 4 and 5 we present all our theoretical …ndings and predictions. Section 6 contains the empirical analysis, and section 7 concludes. As usual, technical and supplemental materials are relegated to the appendix.
2
Important Patterns of Mass Killings and
Re-lation to Literature
Before diving into the analysis, it is useful to highlight the main patterns of mass killings and discuss some of the predictions and …ndings in the literature. The …rst fact to highlight is that almost all mass killing episodes in his-tory were perpetrated by governments or dominant groups (see Har¤, 2003; Valentino, Huth and Balch-Lindsay, 2004; Eck and Hultman, 2007). In order to be able to carry out mass killings, evidently a group needs to handle power and control the military.10 A quote from Krain (2000: 43) illustrates this well:
8See also Querido (2009) for an early …nding of this, limited to Africa.
9It is interesting that we …nd population size to have a negative e¤ect on mass killings,
both theoretically and empirically, while for civil wars as dependent variable several empirical studies have found a positive e¤ect of population (e.g. Fearon and Laitin, 2003; Collier and Hoe- er, 2004; Montalvo and Reynal-Querol, 2005; Collier and Rohner, 2008; Collier, Hoe- er and Rohner, 2009; Esteban, Mayoral, and Ray, 2012).
"Military victories by de…nition enable the winner to set the terms of the post-internal war period. This may include the decision to punish the losing side by eradicating them, thereby eliminating the problem of having to live side by side with the enemy in the post-internal war state. This was the solution chosen by the Congolese rebels who took control of what would become Zaire in the mid-1960s". Or in the words of Chirot and McCauley (2006: 2), "con‡ict can become genocidal when powerful groups think that the most e¢ cient means to get what they want is to eliminate those in the way."
Rummel (1994, 1995) points out that "power kills, absolute power kills absolutely" (1994: 1), and gives a strong quantitative idea of the preponder-ance of government decided killings, when he states that "political regimes — governments— have probably murdered nearly 170,000,000 of their own citizens and foreigners in this century — about four times the number killed in all in-ternational and domestic wars and revolutions." (Rummel, 1995: 3). Most of the time mass killings are present towards the end or after many guerrilla wars (Krain, 2000; Valentino, Huth and Balch-Lindsay, 2004),11.
A second stylized fact to keep in mind is that not all forms of war are equally likely to be accompanied by mass killings. A substantial fraction of civil wars entail deliberate mass killings of civil non-combatants on a large scale perpetrated by the dominant group, while there is almost no record of mass killings of this sort in post-WWII interstate wars. Between 1960 and 2000 roughly a third of all civil wars (50 out of 152) featured mass killings, while in none of the interstate wars (23) were there mass killings.12 In interstate disputes
there is no supranational government budget to …ght for in terms of entitlements or alike, and hence interstate wars typically take the form of territorial wars.13
One distinctive feature of mass killings that clearly separates this deadly option from other forms of weakening the opposition group (e.g. imprisonments, internments, expropriations and disenfranchisements) is that mass killings are designed to reduce the size of the opponent groups, either directly or by causing refugee out‡ows and displacements (multiplier e¤ect). Or in Krain’s (2000: 41) words: "The goal of state-sponsored mass murder is to eliminate the opposition from existence".14
killings of civilians, and they are more likely to engage in killings if they are militarily strong relative to the government (Hultman, 2009) and after having won a military battle (Schnei-der, Bussmann, and Ruhe, 2012). Usually killings by rebels take the form and ob jectives of terrorism, which is beyond the scope of this paper (for this separate literature, see e.g. Azam and Hoe- er, 2002; and Bueno de Mesquita, 2010).
1 1The usual sequence of events is indeed that there is …rst a civil war and mass killings only
take place after victory. To put it in Krain’s (2000: 46) words, "internal wars are lethal twice over–in the actual bloody con‡ict, and in the enhanced potential for state-sponsored mass murder subsequently".
1 2To compute this, we took data on mass killings in wars from Valentino, Huth and
Balch-Lindsay (2004), civil wars data from Collier, Hoe- er and Rohner (2009), and data on interstate wars from Gleditsch and Ward (2007). According to Valentino, Huth and Balch-Lindsay (2004) the only mass killings during interstate war in recent decades took place during the Korean War, 1950-53 (which shared many features with civil wars).
1 3Caselli, Morelli and Rohner (2013) display theoretically and empirically the territorial
nature of interstate resource wars.
im-At the theoretical level, the logic behind mass killings is very di¤erent from the logic behind government appropriation or expropriation strategies, since they have opposite dynamic incentive e¤ects: appropriation, expropriation and imprisonment are reversible and create extra motivation for future revenge, while killings are irreversible. Softer forms of weakening opposition groups, like disenfranchisement strategies, would induce higher relative incentives to rebel, whereas the logic of mass killings is precisely the reduction of future threats. Acemoglu and Robinson (2001) give a perspective of enfranchisement as commit-ment to fair surplus sharing in the future in order to avoid the risk of rebellion, and this can be captured in our model by an increase in the institutional lower bound on the unfair treatment of minority groups. What we show is precisely that while such a lower bound certainly reduces the probability of unfairness related motivations to rebel for minority groups, it may increase the dominant groups’incentives to decimate them. By the same token, if the government con-trolling group is looking for strategies to weaken the future claims on resources by minority groups, disenfranchisement could work only conditional on being sure that no rebellion could ensue, while eliminated players cannot …ght in the future. An extreme form of disenfranchisement is slavery and forced labor (see e.g. Domar, 1970; Lagerlöf, 2009; Acemoglu and Wolitzky, 2011). As we show in the paper (see lemma 4 and the subsequent discussion) it is possible even in our model that the group in power may prefer distributive exploitation (concep-tually similar to slavery) over the option of mass killings, butonly when natural resource rents are not larger than the destruction costs of war and when there are binding limits to the exercise of power. At the time of the Peloponnesian war (see e.g. Thucydides, 1956), the Sparta rulers chose to repress the Hilots rather than killing them because (1) the Hilots were the majority and were pro-viding most of the productive work and (2) the technology of control through the strong military was simply less costly than the alternatives. The importance of Hilots for production and the absence of crucial natural resources are already two factors that our model would deem su¢ cient to explain the ruler’s lack of interest in the option of mass killings.
Our empirical results con…rm that democratization can have ambiguous ef-fects, as suggested by the theory. In the literature non-democratic regimes are found to be more likely to commit mass killings than democracies, especially when the autocrats are powerful (Rummel, 1994, 1995; Har¤, 2003; Valentino, Huth and Balch-Lindsay, 2004; Easterly, Gatti and Kurlat, 2006; Eck and Hult-man, 2007; Colaresi and Carey, 2008). We …nd in section 6 that autocracy does not remain a signi…cant explanatory variable for mass killings when one addresses the autocorrelation of the dependent variable, reduces the omitted variable bias and accounts for unobserved heterogeneity. Unfortunately, the
existing quantitative literature focuses almost exclusively on thelevel of democ-racy rather than theprocess of democratization. However, there is ample case study evidence available. Based on extensive historical examples, Mann (2005) argues that “regimes newly embarked upon democratization are more likely to commit murderous ethnic cleansing than are stable authoritarian regimes.”15
Among the other papers in the empirical literature studying mass killings, Krain (1997), Heger and Salehyan (2007), Bae and Ott (2008) and Querido (2009) …nd that large levels of ethnic fractionalization reduce the risk of mass killings, while Montalvo and Reynal-Querol (2008) show that ethnic polarization increases the risk of mass killings; richer countries tend to display less mass killings (Scully, 1997; Bae and Ott, 2008);16inequality (especially human capital
inequality) tends to increase the risk of mass killings (Besançon, 2005), while trade openness reduces the risk of mass killings (Har¤, 2003).17
We shall also brie‡y discuss the factors that have been found to increase the risk offorced displacements. Refugee ‡ows are larger in conjunction with mass killings, in wars, under dissident repression, in non-democracies and in coun-tries with low agricultural productivity per worker (Schmeidl, 1997; Azam and Hoe- er, 2002; Davenport, Moore and Poe, 2003; Moore and Shellman, 2004).
1 5Mann (2005) sees the process of democratization as the main cause of ethnic cleansing:
“Stably institutionalized democracies are less likely than either democratizing or authoritarian regimes to commit murderous cleansing. (...) But their past was not so virtuous. Most of them committed su¢ cient ethnic cleansing to produce an essentially mono-ethnic citizen body in the present. In their past, cleansing and democratization proceeded hand in hand.” (p. 4) Looming democratization has also been noted to have critical e¤ects on the risks of civil-ian massacres by Mans…eld and Snyder (2005): “The 1993 elections in Burundi–even though internationally mandated, free, and fair–intensi…ed ethnic polarization between the Hutu and Tutsi ethnic groups, resulting in some 200,000 deaths” (2005: 5). Further, Mans…eld and Sny-der refer to “power sharing and pluralism as precursors to the Rwandan genocide. In Rwanda, as in Burundi, the pressures to democratize applied by the international donors that were the source of 60 percent of the Rwandan government’s revenue played a central role in triggering ethnic slaughter” (2005: 255). Further, “in East Timor, a favorable vote on independence from Indonesia in an internationally mandated 1999 referendum spurred Indonesian-backed Timorese militias to unleash large-scale backlash violence, creating an international refugee crisis” (2005: 6). Regarding the case of Darfur discussed in Section 1, peace agreements in other parts of Sudan brought the expectation of “looming elections” and democratization (Straus, 2005), and this may have played a role in the decision to eliminate the minority group.
Also in ex-Yugoslavia at the beginning of the 1990s the prospects of democratization and rent-sharing according to group sizes played a role in the slaughtering. “Less than six months after the …rst democratic elections were held in former Yugoslav republics, the country was at war” (Woodward, 1995: 17), and soon thereafter there were the biggest massacres of civilians in recent European history. “The basis of this policy of ethnic cleansing lay not with primordial hatreds or local jealousies, but with political goals. (. . . ) Their ob jective (was) to consolidate ethnically pure territories that would vote correctly in a referendum on sovereignty and in future elections and to justify government administration by their national group.” (Woodward, 1995: 242).
1 6Easterly, Gatti and Kurlat (2006) …nd that mass killings are most likely for countries with
intermediate income levels.
1 7We focus on large-scale one-sided mass killings episodes, hence the literature
Davenport, Moore and Poe (2003) …nd that when regimes start democratizing, this can lead to more refugee ‡ows.
Finally, we should mention the literature about the desirability of inter-vention in order to tighten the constraints to the exercise of power: Since the end of the Cold War, the question of whether to intervene to stop states from committing atrocities, especially mass killings, has become central (Ho¤man et al. (1996), Holzgrefe and Keohane (2003), Rotberg (2010), Teson (1997), Weiss (2007), and Wheeler (2002)). In our analysis this issue is only brie‡y dis-cussed when evaluating the e¤ects of changing the single parameter capturing the bound on the power to kill, while an interesting theoretical analysis of third party strategies can be found in Kydd and Straus (2013). There is also evidence of ambiguous e¤ects of such tightening of the power to kill: Hultman (2010) …nds that UN interventions mandated to protect civilians do reduce civilian deaths, but other UN interventions increase rebel targeting of civilians.
3
Model
There are two groups,iandj, with initial population sizesNi; Nj. Without loss
of generality, let j be the group in power in the initial period in the analysis. There are two sources of wealth to be shared in each period: a constant per-period amount R comes from the exploitation of a natural resource; the other source of income is output produced by labor, for which we assume a rigid labor supply, so that the output of production at timet is Nt= (Nt
i +Njt). We
can think of >0 as individual productivity determined by education as well as by technology.18 Hence, the surplus to be shared in the …rst period is
S= (Ni+Nj) +R:
In the following periods in the in…nite horizon game the only potential alteration of such a per period surplus can come via changes in the population size.19
We assume that if a period displays con‡ict, the winner seizes the entire surplus of that period, minus a lossdcaused by the con‡ict. We also assume that the probability of victory in war at timetfor grouph; h=i; j;is equal to the relative population size in that period, Nht
Nt.20
The common discount factor is denoted as usual by 2[0;1]. The last piece of notation is the fairness level th chosen byhwhen in power at timet: ifhis in power and o¤ers a sharexof the surplus to group k6=h, such a share xis decomposed as a fairness parameter thtimes the relative group size of groupk at the time of surplus sharing. Thus, th2[0; Nt=Nt
k].
1 8The results of this paper extend to the case in which heterogeneous s are allowed. Since
this generalization does not add any non-trivial insights, we opted to leave it out.
1 9A natural extension to a world with stochastic productivity and/or stochastic resource
rents is left for future research.
2 0In a previous version of the paper the model allowed for endogenous probabilities of
Whoever is in power at the beginning of time t, h =i; j, the time line in periodt is as follows:
1. Production takes place, the surplus is collected and the group in power announces a distribution of this surplus between the two groups.
2. Peace or Con‡ict: The two groups decide simultaneously whether to have con‡ict or peace, where peace prevails only if both choose peace. In case of con‡ict an amountd of the surplus is destroyed. Grouphremains in power in case of peace and in case it wins the war, whereas groupk6=h obtains power only by winning the civil war.
3. Exercise of power. This has two dimensions. First, the group in power keeps all the surplus in case of victory or carries out the announced dis-tribution in case of peace.21 Second, the ruler may decide to eliminate members of the other group, without surpassing a total over time upper boundM.
4. Consumption: Consumption takes place.
The exercise of power stage of each period is where institutions, regimes, and perhaps third parties, can enter the picture: in theunlimited powerbenchmark, the group in power has full discretion to choose the division of the surplus of that period and the number of killings to perpetrate. However, power is usually limited or constrained, by institutions or social norms, and we will capture these limits to the exercise of power by means of two parameters: andM.
The …rst of these two constraints can be interpreted as a constraint to the exploitation of the powerless group: saying that in peace the share of the sur-plus going to group k cannot be lower than Nkt
Nt implies that the democratic
institutions, checks and balances, or general tolerance of unequal treatment in society, do not permit a degree of exploitation represented by any < , and hence implies that if the group in power violates that constraint the standing institutions are violated.
For the upper bound on allowable mass killings M to be binding, it has to be lower than the minimum betweenNi andNj, whereas otherwise the full
extermination of a minority group is possible.
We organize the analysis as follows: …rst, in the coming section, we study the benchmarkunlimited power case, whereM and are not binding, i.e., when the degree of exploitation of the powerless group …nds its binding constraint in the need to make sure that such a group does not rebel, rather than in exogenous institutions or social norms. Then, in section 5, we will characterize the best Subgame Perfect Equilibrium (SPE henceforth) even for the more complex case in which and M can be binding, emphasizing the di¤erences in terms of predictions with respect to the unlimited power benchmark.
2 1During a civil war the normal time institutions and social norms are abandoned, and
4
Equilibrium Analysis with Unlimited Power
In this section we characterize the best SPE in the unlimited power case. In order to do so, we …rst need to characterize the worst SPE, which can then be used as punishment phase in the construction of the best SPE.
We shall start with a series of claims that will be used for constructing the lemma characterizing the worst SPE.
Claim 1 Because of the simultaneous move war declaration stage, there always exist equilibria with war at the very start of the game. The punishment phase of a grim trigger pro…le always starts with a war.
However:
Claim 2 In the unlimited power case, war forever can never be sustained as SPE.
Proof. In the unlimited power case, the winner of the …rst war can choose the level of mass killingsM and without constraints. Let us show that choosing M = 0in anticipation of more periods of war and no mass killings cannot be rational.
Suppose …rst that groupiwould never want to do mass killings. Consider a subgame after a war that ended with a victory ofj, at a history with no prior mass killing. Groupj’s trade-o¤ at that node is as follows: When exterminating the opponent it obtains:
S d+
1 (S Ni);
when renouncing to do mass killings, continuing the war path, it obtains22
1 + 1
Nj
N (S d):
It is easy to see that mass killings are always preferred to continued con‡ict in the punishment phase. A fortiori, if groupiallowed itself to do mass killings, groupj would have an even larger relative gain from mass killings at the node of exercise of power after victory in a civil war. The same logic applies ifiis in power after the …rst war of the punishment phase.
2 2To see this, consider the value forjto be in power when entering a new period, denoting
it byVjj:
Vjj=Nj
N
h
(S d) + Vjji+Ni
N V
i j; whereVi
j is the value forjafter giving up power toi. Under permanent con‡ict, the value of being in opposition is identical to that of being in power because power doesn’t give any strategic advantage, so thatVjj=Vi
j =Vj. Hence,Vj= Nj
N S d
Claim 3 In the case of unlimited power, there exists a SPE strategy pro…le in which (1) both groups always choose war in any period where they both exist, and (2) there is full extermination of the opponent by whoever is in power at the …rst occasion.
Proof. Deviating by not selecting war is not a worthwhile deviation, as war will occur as long as at least one of the players selects it. The only one-period deviation to be evaluated is the decision by a winning grouphto chooseM < Nk, k 6= h. After such a one-period deviation from full extermination, in the
following period a new war takes place, followed by extermination by the winner. When doing full extermination, grouphobtains:
S d+
1 (S Nk):
In contrast, when doing M < Nk group h obtains after reformulation the
ex-pected payo¤
S d+ Nh
N M S M d+1 (S Nk) ;
which is always smaller than the payo¤ from doing full mass killings right away. Hence, there cannot be a worthwhile deviation, and the strategy pro…le with full extermination by whoever is in power at the …rst occasion must be an equilibrium.
The above three claims allow us to state the following lemma:
Lemma 1 In the unlimited power benchmark, is the worst SPE of the game, consisting of strategies by the two players with immediate war followed by full mass killings by the winner.
We are now ready to characterize the best SPE, obtained by reverting to after any deviation.
Consider a candidate stationary SPE path in which j remains in power forever, there is never war nor mass killings, and the fairness level is j every
period, whereas after any deviation from this path the two players enter the punishment phase, constituted by the worst SPE continuation characterized above.
Conditional on having had peace before, the value for groupifrom continuing on path is
1
1 j
Ni
NS;
while when rebelling (hence switching to the worst path) it obtains
Ni
Thus,iprefers the stationary peaceful path as long as
1
1 jS > S d+1 (S Nj);
that is
j j
S d(1 ) Nj
S : (1)
Note that j is increasing in R, meaning that the more natural resource rents there are, the more di¢ cult it is to keep the minority group peaceful.23 Further,
j is decreasing ind, which is due to the fact that high destruction costs of war
deter rebellion.
Now that we have computed the j that, if chosen every period, eliminates the incentives to deviate for groupi, we need to check the incentives to deviate by groupj.
Groupj’s payo¤ of buying peace in all periods is
1 Ni
N j S
1
= 1 Ni
N
S d(1 ) Nj
S
S
1
= Nj
NS+
Ni
N(d(1 ) + Nj)
1 :
Two types of deviations are possible: mass killings or exploitation, where by the latter we mean the decision by groupj to give j = 0 in the deviation
period. With the mass killings deviation, groupj obtains
S+
1 (S Ni): (2)
With the exploitation deviation, on the other hand, groupj obtains
S+ Nj
N S d+1 (S Ni) : (3)
It is immediate that the payo¤ from mass killings is always larger than the payo¤ of exploitation alone. Hence, the most pro…table deviation to consider is mass killings.
Peace is preferred byj to mass killings i¤
Nj
N S+
Ni
N(d(1 ) + Nj)
1 > S+1 (S Ni):
After some manipulations, the condition can be written as follows:
2 3Note also that ifd >(<) N
R < Rj (d N)(1 ) + Nj: (4)
This is the "No-MK IC" condition. Similarly, the No-MK IC condition wheni is in power isR < Ri (d N)(1 ) + Ni.
All the above analysis leads to the following lemma:
Lemma 2 (I) If R < Rj (d N)(1 ) + Nj, the best SPE in the
unlimited power case is a peaceful steady state with fairness level j, which is increasing inR.
(II) If R > Rj (d N)(1 ) + Nj, the best SPE in the unlimited
power case involves war, and extermination at the …rst occasion, perpetrated by whoever is in power at the end of the war.
We remark that there are no parameter values under which the best SPE involves exploitation:
Remark 4 In the unlimited power benchmark there are no parameter values under which the best SPE can display exploitation ( j= 0) without mass killings.
To see this, note that the immediate e¤ects of exploitation and mass killings in terms of distributive consequences are the same, as far as the payo¤s for the governing group in that period are concerned. Further, we know that in both casesj would trigger a punishment phase with war and mass killings, wherej would risk to be the one killed. This is always dominated by killing right away, as follows from equations (2)-(3).24
Proposition 1 below displays the comparative statics from the equilibrium characterization obtained above.
Proposition 1: Assuming the groups always select the best SPE behavior, peace is more likely (and hence mass killings less likely) when:
–Ris lower; –dis larger; –Ni=N is smaller;
–the size of the group in power is larger (smaller) if >(<)1=2; –the higher is or N, for su¢ ciently high;
–the higher is ,unless dis very large.
In summary, for su¢ ciently high , the probability of war and mass killings is increasing inRand polarization,25 and decreasing ind, andN.
2 4Note also that full extermination (which is feasible only in this unlimited power
bench-mark) is chosen for su¢ ciently highRover any intermediate level of mass killings. This was true even in other versions of the model displayed in previous working papers, even when considering the Markov equilibrium rather than the best SPE.
2 5On average, we should expect larger groups to be more frequently in o¢ ce than smaller
We now turn to the general case with potential bounds on the exercise of power discretion, with the goal of con…rming the validity of the above insights and to see which types of limitations to the exercise of power are most e¤ective in di¤erent circumstances.
5
Equilibrium Analysis with Bounds on Power
Let us now allow in the analysis that the limits to the exercise of power and M may be binding, recalling …rst the meaning of such bounds.
If a State respects the constitution and the rule of law, it needs to o¤er at least to the powerless group. This may correspond to the minimum level of income needed for respecting the international human rights conventions, i.e. right for shelter, right for education, covering the basic needs and not letting people die in the street, or minimum levels of income and/or welfare services prescribed by the local institutions and laws. On the other hand, if the State suspends constitutional rights and the rule of law, calls a State of emergency with Martial law, then there are no boundaries to exploitation. In such a lawless situation it is not possible to guarantee any transfers to the powerless group as the state slips in a situation of anarchy. An alternative interpretation of is simply that this is the common knowledge minimum level of fairness below which the powerless group is expected to rebel and trigger the punishment phase, even if > j(R). In other words, the incentive compatibility constraint
j(R) computed in the previous section represents the trigger in a society in
which the powerless group evaluates the possibility to rebel only on the basis of their relative chances to win but without any cultural or social or legal reference point; whereas the possibility that the trigger of rebellion could be < with > j(R)represents the reality of groups and societies in which a social and/or legal norm of higher fairness exists, such that its violation is enough to trigger rebellion, even if not justi…ed by the pure calculations of convenience captured in the SPE continuation equilibrium logic of j(R).
When M <minfNi; Njg is binding, it means that no group in power can
kill (or displace) more thanM members of the other group (or that the cost of doing so would be in…nity). M has to be understood as a total upper bound over time.26
5.1
Binding constraint on exploitation only
Let us …rst analyze what happens when > j(R), i.e., when the limit to exploitation is binding, while for now let us keep the constraint on mass killings not binding.
Note …rst that when o¤ered , group iis willing to keep peace, given that > j. The incentive constraint that matters is therefore the one concerning the group in power: under what conditions doesjo¤er rather than deviating to full exploitation, abandoning all constitutional constraints, or to mass killings?
The payo¤ forj from peace is
(1 Ni
N )S
1 :
The payo¤ forj from deviating and exterminating groupiis
S+
1 (S Ni):
Thus, groupj will remain peaceful and refrain from mass killings i¤
< L(R) N
N+R: (5)
Note that L(R) is decreasing in R and equals j(R) exactly at R = Rj = (d N)(1 ) + Nj. Recall that exploitation alone ( = 0in the deviation
period) is dominated by the extermination deviation, something that is going to be revisited below, in the general case in which bounds exist to both types of exercise of power.
Remark 5 If M is not binding, the comparative statics of Proposition 1 con-tinue to hold even in the presence of a binding . The additional result is that the probability of peace is (weakly) decreasing in .
5.2
Worst equilibrium with binding constraints on all forms
of power
The next lemma characterizes the worst SPE of the game when on top of bounds on exploitation we also add the boundM <minfNi; Njg on killings.
Lemma 3 For any M < minfNi; Njg, and for any , the worst SPE is as
follows:
1. IfR d, then the worst SPE for the punishment phase involves war every period, with both groups killingM opponents at the …rst occasion of power;
2. on the other hand, if R < d, the worst SPE involves war forever but without mass killings.
Proof. Consider a subgame in which one grouphhas already killed M oppo-nents in the past, and hence can no longer access to additional killings. If at the beginning of this subgamehis out of power, then the trade-o¤ for the groupk that just conquered power becomes as follows.
Ifkkills, it obtains
Nk M
N 2M
S 2 M d
1 ;
Ifkdoes not kill,27 it obtains
Nk M
N M
S M d
1 :
Thus, performing mass killings is preferred ifR > d.
Further, if hhad the option to still do mass killings in the future, then a fortiorikwould have incentives to do mass killings when R > d.
In contrast, for R < d, when h does indeed not want to kill, then k does not want to kill either, as shown above. This fully characterizes the worst SPE, which always involves war, and hence never matters.
Armed with this lemma, we can now characterize the best SPE in the bounded power setting.
5.3
Best equilibrium characterization when both types of
power may have binding constraints
In this section, we are going to characterize the best SPE with peace or with con‡ict by separately examining the cases whered Randd < R.
Lemma 4 Letd R. The best SPE involves peace if and only if
d 1
1 + Nj Ni
S and 1 + d
S Nj
Ni
:
Otherwise, the best SPE involves con‡ict.
Proof. Consider any equilibrium strategy pro…le involving peace, assuming it exists, with group j in power o¤ering j every period. From Lemma 3 we
know that when groupideviates from peace and engages in rebellion it triggers the punishment phase with con‡ict in every period but without mass killings. Hence, groupi’s payo¤ from rebellion is
Ni
N S d
1 :
In contrast, groupi’s payo¤ from peace is
j
Ni
N S
1 :
Thus, groupi(weakly) prefers peace if
j max ;1
d S :
2 7Note that if postponing the killings for the future is a preferred strategy, this has to
Now turn to the trade-o¤ forj. Consider …rst the case in which <1 Sd. In this casej’s payo¤ from peace is
1 1 d
S Ni
N S
1 :
Both "exploitation" (i.e. grabbing all the pie, but not doing any mass killings) and mass killings will trigger the punishment phase. Group j’s payo¤ from "exploitation" is
S+ 1
Nj
N (S d): The payo¤ of groupj from mass killings is
S+ 1
Nj
N M(S M d):
Checking which constraint is binding shows that for R < d exploitation is preferred to mass killings, and hence exploitation is the relevant outside option.
Groupj prefers peace to exploitation i¤:
d 1
1 + Nj Ni
S:
(Note that ford < S this threshold is always bounded between0and1.) If instead >1 Sd, the condition under which j prefers peace (having to give ) over exploitation is
1 Ni
N S
1 > S+1
Nj
N (S d):
i.e.,
1 + d
S Nj
Ni
:
The above lemma tells us that there is an important di¤erence between the unlimited power benchmark and the analysis when both types of power can be limited:
Remark 6 In the presence of e¤ ective bounds on power it is no longer the case that exploitation of minority groups is always dominated by mass killings. In fact, whend Rit is the opposite.
As long as the non-produced rentsRare small relative to the cost of con‡ict d, there will be no mass killings.28
However, forR > dthe worst SPE is similar to the one in the unlimited power case, hence the characterization of the best SPE will again involve thresholds below which mass killings will occur, and once again, most importantly, the probability of such a scenario is increasing inR.
2 8This is why in the statement of Lemma 4 we need not refer to whetherM is larger or
Lemma 5 Let M < minfNi; Njg and d < R. There exist thresholds Rh, h
andLh,h=i; j, such that (i) the best SPE involves peace if and only ifR Rj
and max j; Lj .
(ii) When R > Rj and/or > max j; Lj , the best SPE involves war in the …rst period, and if groupj wins it commits mass killingsM. If group i
wins it commits mass killings M i¤ R > Ri and/or > maxf i; Lig, while forR Ri and maxf i; Lig the best SPE involves peace ever after. When mass killings occurred at the end of the …rst period, there exist thresholdsRi ,
Rj , Li and Lj , such that (A) if the winner of the …rst war is h=i; j, and
R Rh (and Lh , in case is binding), then peace follows ever after; while (B) ifR > Rh (and/or > Lh , in case is binding), then war continues until power shifts, at which point the second mass killingM takes place, and peace follows after that.
We relegate the (tedious) proof of this crucial characterization lemma to appendix A (the proof also contains the de…nitions of all thresholds used in lemma 5).
One important punchline of the above lemma is that whenR min Ri; Rj the best SPE involves peace in all periods, while for R >max Ri; Rj mass killings M occur at least once. In the zone in-between the two thresholdsRi andRj the occurrence of mass killings depends on the identity of the winner of the war in the …rst period.
Below we shall display graphically in Figure 1, in the space(R; ), the dif-ferent zones derived under the lemmas 4 and 5, for particular parameter values (d = 50, Ni = 50, Nj = 50, = 1, M = 5, and = 0:6). Hence, regular
non-resource production ( N) has a value of 100, and the destruction of war (d) corresponds in this example to half of the non-resource production. Other parameter values lead to di¤erent sizes of the zones, but qualitatively the picture looks the same.
Using the bounds of lemma 4 we can display what happens when R < d. In this case, mass killings never occur, and there is peace below the downward sloping green line and exploitation above. Moving to the region whereR > d, i.e. where the value of natural resource production is more than half of the value of the non-resource economy, we need to apply the bounds from lemma 5. For values of R < R = 114 and < L (R) (which corresponds to the downward sloping red line), there is still peace.29 Then there is a small corridor between
R andR = 118, and between the downward sloping redL (R)and the blue L (R) lines where only the winner of the …rst period con‡ict performs mass killings, and from then on successfully "buys o¤" the opponent group. For all other values ofRand (i.e., to the right ofR and above theL (R)line), there will be mass killings of the maximum possible amount at the earliest occasion by both groups. In other words, in that zone the equilibrium path involves mass killings and then revenge mass killings at the …rst time power switches. Note
2 9Note that given that in this numerical example there is N
i = Nj, we haveRi = Rj,
0 10 20 30 40 50 60 70 80 90 100 110 120 130 140 150 0.1
0.2 0.3 0.4 0.5 0.6 0.7 0.8 0.9 1.0
R lambda
R**
R*
ONE
M
AS
S
KI
LL
ING
PEACE
BOTH MASS KILLINGS
d EXPLOITATION
L**(R)
L*(R)
Figure 1: Zones of Peace, Exploitation and Mass Killings
that in this numerical example mass killings only occur in countries where the natural resource sector is larger than the non-resource economy, and/or where there are extremely tight egalitarian distribution rules.
The substantive predictions of the model are contained in the next proposi-tion:
Proposition 2: (I)Like in the unlimited power benchmark, it continues to be true that the probability of mass killings in the best SPE is, for su¢ ciently high
: increasing in Rand inNi=N anddecreasing in d, andN.
(II) The probability of mass killings in the best SPE is (weakly) increasing in .
(III)If is su¢ ciently high, then the value of M that minimizes the proba-bility of mass killings is always interior (i.e., the probaproba-bility of peace is a concave function of M), and the peace likelihood is maximized by M = N4 d.
The proof is relegated to appendix A.
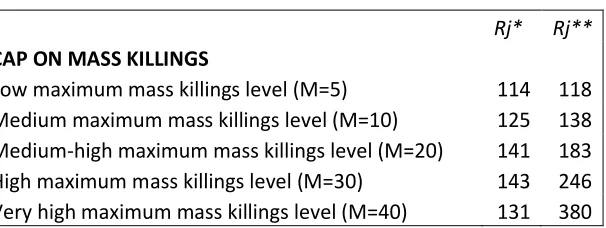
Rj*
Rj**
CAP ON MASS KILLINGS
Low maximum mass killings level (M=5)
114
118
Medium maximum mass killings level (M=10)
125
138
Medium-high maximum mass killings level (M=20)
141
183
High maximum mass killings level (M=30)
143
246
Very high maximum mass killings level (M=40)
131
380
Table 1: E¤ects of caps on mass killings
population size, the productivity of the economy, and the cost of war.30 Table 1 provides an overview of what happens for di¤erent constraints on M, keeping all other parameter values as before. Given that the value of the non-resource economy ( N) equals 100, the values of Rj andRj in this table correspond to the resource abundance as percentage of the non-resource econ-omy. Hence, a value ofRj of, say, 200 would mean that the threshold lies at a level of resource rents being twice as large as the non-resource economy.
The e¤ect of the level of the cap M on mass killings is ambiguous even for interior values of . Increasing M from a low to a medium level, makes mass killings less likely to occur, while increasingM further to a very high level results in an increase of the mass killings risk. This means that in examples like this the probability of mass killings is minimized by some interior level ofM, like established formally for the case of !1(cf. proof of Proposition 2).
Note that for many of the parameter constellations where mass killings are the most likely, i.e. for relatively high polarization and relatively low M, the thresholds of Rj and Rj are relatively close together, meaning that with a uniform distribution of parameters, and ofRin particular, the probability that the best SPE involves mass killings on both sides (with a sequence of wars between the …rst and the last mass killings episode) may be on average higher than the probability of observing mass killings on one side only. Hence, for many contexts one could observe serial correlation of mass killings.
5.4
Discussion
The characterization of the best SPE for every pair of constraints to the exercise of power allows us to draw some broad theoretical conclusions, before turning to the empirical evaluations of the comparative statics predictions with respect to the observable parameters.
The …rst remark is about robustness: as established in proposition 2(I), at least for high , the sign of the e¤ects of R; ; N; d and polarization on the
3 0It goes without saying that of course, trivially, if it was possible to costlessly enforce a
probability of mass killings remains the same for every amount of power that a government controlling group can exercise. Thus, in the empirical evaluation that follows we do not need to assume anything about power limitations.
However, there are substantively interesting di¤erences between the unlim-ited power benchmark and the rest of the analysis. Lemma 4 establishes that in an economy with very little resource rents, the best SPE can never display mass killings. The worst case scenario in such an economy is repeated con‡ict, which may happen when players are su¢ ciently impatient. The presence of this region of values ofR < dwhere mass killings cannot occur for any values of the other parameters is partly responsible for the fact that the e¤ects of changes in polarization are ambiguous for interior values of . Lemma 5 tells us about the conditions for con‡ict and mass killings in resource rich countries, withR > d. We shall have peace if two conditions are satis…ed. One is that non-produced rents are not too large,R Rj. The other is that the imposed level of fairness is not too strict, that is, maxf j; Ljg. Proposition 2 is based on how these thresholds vary with the basic parameters of the model.
In order to have an intuition for the comparative statics results in Proposition 2, let us start by stressing the di¤erences in terms of strategies between the two worlds, with and without constraints. Consider …rst the case with no constraints to power. We have obtained in Lemma 2 that ifR > Rj the best SPE involves war and extermination. The critical point is that in this case, the game ends with the extermination of the opponent. Extermination has a cost but it grants full appropriation of the remaining surplus. The introduction of a binding capM induces di¤erent considerations, because the victorious group will have to take into account that the game will continue with the surviving rival population. Furthermore, when a group does all the mass killings permitted by the cap, it cannot threaten with further mass killings after that, and hence the sharing conditions that it can impose on the loser will be less exploitative than if they could retain the future threat.
Consider now the e¤ect of a minimum fairness norm. If is very high, the victorious group will not be able to impose a su¢ ciently advantageous share of the surplus when avoiding mass killings (using them as a future threat only). Hence, too high a may induce immediate assassinations. This means for example that historical moments in which a group in power expects some serious reduction in their ability to extract surplus from other groups’ production or from natural resources, e.g. moments of expected democratization pressures, may be the most dangerous moments in terms of mass killings incentives. This observation could therefore contribute to explain the particular instability of economies that are transitioning towards democracy.31
Finally, the non monotonic e¤ects of M deserves some discussion. Mass killings have multiple e¤ects: (1) for any given level of fairness, the reduction in the number of people in the other group increases the share of the surplus that the group in power will obtain, and (2) mass killings increase the probability
3 1See Baliga, Lucca and Sjöström (2011) and references therein for additional reasons for
of winning for the group in power in future wars; but (3) mass killings reduce the overall surplus size. How important this reduction is, depends of the weight of the non-produced rents. If the non-produced rents are small, the third e¤ect dominates and mass killings are avoided. But if R is su¢ ciently large, mass killings become more attractive as the surplus shrinks relatively less after mas-sacres. The non-monotonic e¤ect of the bound on the power to kill depends on the importance of e¤ect (2). The level of unfairness depends on the threat to the loser of doing mass killings if this group triggers con‡ict in the future. As we have argued, the threat power is inversely related to the current use of mass killings. Hence, the less a player discounts the future payo¤s, the higher the weight it will give to this indirect threat e¤ect, which can keep the future share high. In contrast, the more the future is discounted, the more prominent will be the weight given to the more direct, immediate gains. Putting the e¤ects together, the cap M that makes mass killings least attractive is intermediate, at least when the players are patient enough. When is su¢ ciently low, the direct e¤ect dominates and we may have mass killings in the best SPE for all levels ofM, provided thatRis large enough.
6
Empirical Analysis
In this section we shall confront some of our predictions with data.
One of the main purposes of the country level regressions in subsection 6.1 is to assess how robust the existing empirical evidence on mass killings is when im-portant econometric issues are taken into account. Further, we want to include in the analysis several new variables, in particular on natural resource abun-dance, which plays a crucial role in our model, but has been largely neglected in the existing literature on mass killings.
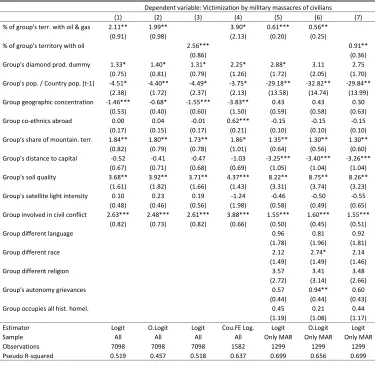
The ethnic group level analysis performed in subsection 6.3 examines for the …rst time what kind of ethnic groups are targeted in mass killings. Surprisingly, the existing literature has only studied mass killings on either a very aggregate level (i.e. with cross-country panels) or on a very disaggregate level (i.e. case studies of single countries). Studying victimization in massacres with a global panel of ethnic groups is useful, as decisions to commit massacres are strategic decisionsat the group level (as emphasized in our model).
6.1
Country level evidence on the determinants of mass
killings
consent of sustained policies by governing elites or their agents –or in the case of civil war, either of the contending authorities –that result in the deaths of a substantial portion of a communal group or politicized non-communal group." By this de…nition, 268 country-years (3.5 percent of all observations) experience mass killings between 1955 and 2007. These killing episodes take place in 28 di¤erent countries, and include all of the most notorious historical instances of large-scale massacres like for example the ones in Sudan, Rwanda, Bosnia or Cambodia. Countries that have experienced mass killings di¤er on various dimensions emphasized in our theory. Notably, they are much more natural re-source dependent, poorer and more ethnically polarized.32 Determining whether
these di¤erences hold up in a regression analysis with various controls will be the task to which we turn below.
Our sample contains all countries that are in the Correlates of War system, i.e. all countries that have some minimum size and international recognition, and covers the years 1960-2007 (most key explanatory variables start in 1960). This leaves us in Table 2 with between 2257 and 4771 observations depending on the speci…cation. In the Appendix B all variables are explained in detail and summary descriptive statistics are provided.
Most of the existing empirical literature on mass killings su¤ers from three weaknesses that we try to address:
1) There is usually an important omitted variable problem. Most studies use a pooled panel without controlling for unobserved heterogeneity. This is a serious issue, as the variation between countries that experience mass killings and countries that do not can be driven by various factors that are di¢ cult to observe. A good way to address these concerns would be to include country …xed e¤ects. However, we cannot do this as some key explanatory variables like ethnic polarization are not time-varying measures, and some of the natural resource variables like the measures of diamond and gold production vary relatively little over time. Further, removing all cross-sectional variation would also result in a very small sample.33 Hence, as a reasonable compromise we will cluster standard errors by country, which will already eliminate part of the problem. We also include as a robustness check six regional (i.e. continent) …xed e¤ects. This is also the approach adopted by Montalvo and Reynal-Querol (2008).
2) The second problem is that the dependent variable, i.e. mass killings, is auto-correlated over time. Put di¤erently, if in a given year mass killings occur, it becomes more likely that they will also occur in the next year. This is mainly due to the fact that our unit of observation is the country-year, while most mass killings episodes last for several years. In fact, in the list of mass killings episodes from "Political Instability Task Force" (PITF) that we use for our analysis, the
3 2In countries with mass killings natural resource production amounts to on average 10% of
their GDP while for the rest of the country sample this is 5%, their GDP per capita averages 1220 US$ as compared to a the rest of the sample where it is 6150 US$, and ethnic polarization equals 0.6 compared to 0.5 in the rest of the sample. All three di¤erences are statistically signi…cant at the 1% level.
3 3The inclusion of country …xed e¤ects would lead to a drop in the sample size by over 85%,
duration of mass killings episodes ranges from a minimum of 1 to a maximum of 20 years, with an average duration of 6.6 years. Most existing studies ignore this and focus on current incidence without controlling for lagged incidence. There are two ways to address this: Adding the …rst lag of mass killings incidence as explanatory variable, or coding a mass killing onset variable (that only takes a value of 1 if mass killings newly start, and where ongoing mass killings are coded as missing). We use both of these approaches.34
3) The existing studies also use only a rather limited number of control variables, which aggravates the omitted variable problem. We add a range of new control variables and annual time dummies.
The main reason for running our own regressions is that the existing litera-ture only devotes very little attention to the e¤ect of natural resources on mass killings, which play a crucial role in our model. The only paper we are aware of that links natural resources to mass killings is by Querido (2009). However, it only studies a sub-sample of countries (Africa) for a short time period (1989-2005), which leads to a sample size of barely above 200 observations. Further, it only uses data on the existence but neither on the value nor abundance of natural resources. To address these issues, we use in our global sample several standard measures of the value of oil production from various sources, as well as data on diamond, gold, and timber production.
Let us brie‡y recapitulate what predictions of the model will be confronted to the data. The punchline of the theoretical analysis was that (at least for large ) we should expect more mass killings for largeR, high polarization, small , smallN, smalld, and high . Our primary focus in the empirical analysis will be on R, because providing the …rst comprehensive empirical analysis on the e¤ects of natural resources on mass killings is a priority, regardless of whether the theoretical predictions on all other variables work in the data. For this reason we will include in the analysis various measures of quantity of natural resources. A second important evaluation is that of the role of polarization, hence we will include in the analysis an index of ethnic polarization. When controlling for natural resource abundance, as we do, the coe¢ cient of GDP per capita becomes a good proxy for productivity, which allows us to capture the impact of . We also include as variable a country’s population size, which capturesN.
The parameter d, i.e. the cost of war, is more di¢ cult to capture with observable variables. Typically in richer countries the potential for destruction is larger in absolute terms, hence one can also think of GDP per capita as a (admittedly very imperfect) proxy ford. Finally, also is hard to proxy. Our variable democratization can be seen as a proxy for .
In addition to these variables of direct interest, our speci…cations also include the typical control variables included in the existing literature, as displayed below.
3 4Note that in the literature on civil wars (see e.g. Fearon and Laitin, 2003, and Collier and
We consider the following benchmark logit model:
log P(M ass_killingsc;y= 1) 1 P(M ass_killingsc;y= 1)
= +W0c;y +X0c +Z0y ; (6)
where the left hand side is the logarithm of the ratio of the probability of mass killings over the probability of no mass killings, with the mass killings variable varying at the country (c) and year (y) level. Coe¢ cient denotes the constant,
W0
cy a vector of variables that vary at the country and year level,X0c a vector
of variables that vary at the country level, and Z0
y a vector of annual time
dummies. , , and are vectors of coe¢ cients. Among them the coe¢ cients of interest are the ones corresponding to the main variables of the theory listed above.
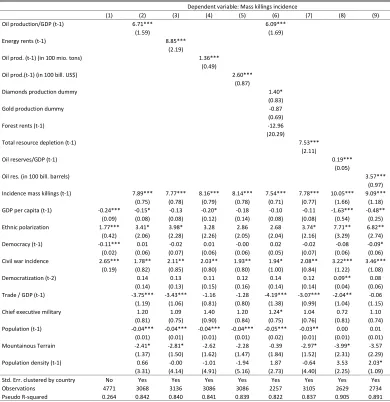
Table 2 displays our results, with on the top line for each variable the co-e¢ cient and below in the parenthesis the robust standard errors. In the …rst column we include the variables that have attracted most attention in the ex-isting literature: GDP per capita, ethnic polarization, democracy, and civil war incidence. Like in most of the existing literature, in that benchmark column we do not control for auto-correlation of the dependent variable, we do not allow for clustered standard errors and we add no further controls. The results are in line with the existing studies and all variables have the expected sign and are highly signi…cant: High GDP per capita and democracy reduce the risk of mass killings, while ethnic polarization and the presence of civil war increase the risk. From column 2 on, we now allow in all columns the robust standard errors to be clustered at the country level to address concerns of unobserved heterogeneity between countries leading to over-stated signi…cance levels. Further, we now include the lagged mass killings variable to take into account potential auto-correlation of this variable, and add several additional control variables to reduce omitted variable bias. To account for potential concerns of reversed causality, we lag the explanatory variables by one period where appropriate.
It is interesting to see how these uncontroversial changes a¤ect the signi…-cance levels of the four explanatory variables of column 1. While the e¤ects of economic output, ethnic polarization and civil war incidence on mass killings continue in most of the columns 2-8 to be statistically signi…cant in the presence of more controls and clustered standard errors, democracy becomes insigni…cant in all but one of these columns.
Given that traditionally many papers in the related literature on civil wars have used a variety of measures of natural resource abundance relative to GDP (e.g. Fearon and Laitin, 2003; Collier and Hoe- er, 2004), it makes sense to use Oil production / GDP as well as other measures. Hence, in the baseline regres-sion of column 2 we include our main measure of natural resource abundance, the ratio of the value of oil production over GDP (from British Petroleum, 2009). Its mass killings inducing e¤ect is signi…cant at the 1% level. Note also that trade openness, population size, and mountainous terrain are found to decrease the risk of mass killings.
Dependent variable: Mass killings incidence
(1) (2) (3) (4) (5) (6) (7) (8) (9) Oil production/GDP (t-1) 6.71*** 6.09***
(1.59) (1.69)
Energy rents (t-1) 8.85*** (2.19)
Oil prod. (t-1) (in 100 mio. tons) 1.36*** (0.49)
Oil prod.(t-1) (in 100 bill. US$) 2.60*** (0.87) Diamonds production dummy 1.40*
(0.83)
Gold production dummy -0.87
(0.69)
Forest rents (t-1) -12.96
(20.29)
Total resource depletion (t-1) 7.53*** (2.11)
Oil reserves/GDP (t-1) 0.19***
(0.05)
Oil res. (in 100 bill. barrels) 3.57***
(0.97) Incidence mass killings (t-1) 7.89*** 7.77*** 8.16*** 8.14*** 7.54*** 7.78*** 10.05*** 9.09***
(0.75) (0.78) (0.79) (0.78) (0.71) (0.77) (1.66) (1.18) GDP per capita (t-1) -0.24*** -0.15* -0.13 -0.20* -0.18 -0.10 -0.11 -1.63*** -0.48**
(0.09) (0.08) (0.08) (0.12) (0.14) (0.08) (0.08) (0.54) (0.25) Ethnic polarization 1.77*** 3.41* 3.98* 3.28 2.86 2.68 3.74* 7.71** 6.82** (0.42) (2.06) (2.28) (2.26) (2.05) (2.04) (2.16) (3.29) (2.74) Democracy (t-1) -0.11*** 0.01 -0.02 0.01 -0.00 0.02 -0.02 -0.08 -0.09* (0.02) (0.06) (0.07) (0.06) (0.06) (0.05) (0.07) (0.06) (0.06) Civil war incidence 2.65*** 1.78** 2.11** 2.03** 1.93** 1.94* 2.08** 3.22*** 3.46***
(0.19) (0.82) (0.85) (0.80) (0.80) (1.00) (0.84) (1.22) (1.08) Democratization (t-2) 0.14 0.13 0.11 0.12 0.14 0.12 0.09** 0.08 (0.14) (0.13) (0.15) (0.16) (0.14) (0.14) (0.04) (0.06) Trade / GDP (t-1) -3.75*** -3.43*** -1.16 -1.28 -4.19*** -3.07*** -2.04** -0.06 (1.19) (1.06) (0.81) (0.80) (1.38) (0.99) (1.04) (1.15) Chief executive military 1.20 1.09 1.40 1.20 1.24* 1.04 0.72 1.10 (0.81) (0.75) (0.90) (0.84) (0.75) (0.76) (0.81) (0.74) Population (t-1) -0.04*** -0.04*** -0.04*** -0.04*** -0.05*** -0.03** 0.00 0.01 (0.01) (0.01) (0.01) (0.01) (0.02) (0.01) (0.01) (0.01) Mountainous Terrain -2.41* -2.81* -2.62 -2.28 -0.39 -2.97* -3.99* -3.57 (1.37) (1.50) (1.62) (1.47) (1.84) (1.52) (2.31) (2.29) Population density (t-1) 0.66 -0.00 -1.01 -1.94 1.87 -0.64 3.53 2.03* (3.31) (4.14) (4.91) (5.16) (2.73) (4.40) (2.25) (1.09) Std. Err. clustered by country No Yes Yes Yes Yes Yes Yes Yes Yes Observations 4771 3068 3136 3086 3086 2257 3105 2629 2734 Pseudo R-squared 0.264 0.842 0.840 0.841 0.839 0.822 0.837 0.905 0.891 Note: The unit of observation is a country in a given year. The sample covers all countries of the Correlates of War list and the years 1960-2007. Logit regressions with intercept in all columns. Significance levels *** p<0.01, ** p<0.05, * p<0.1. Robust standard errors in parenthesis. All specifications control for unreported annual time dummies.
production in percent of the Gross National Income (from World Bank, 2010). Also this measure increas