OpenEnsembles: A Python Resource for Ensemble
Clustering
Tom Ronan tom [email protected]
Shawn Anastasio [email protected]
Zhijie Qi [email protected]
Roman Sloutsky [email protected]
Kristen M. Naegle [email protected]
Department of Biomedical Engineering and the Center for Biological Systems Engineering Washington University in St. Louis
St. Louis, MO 63122, USA
Pedro Henrique S. Vieira Tavares [email protected]
Department of Computer Science University of Arizona
Tucson, AZ 85721, USA
Editor:Antti Honkela
Abstract
In this paper we introduce OpenEnsembles, a Python toolkit for performing and analyzing ensemble clustering. Ensemble clustering is the process of creating many clustering solu-tions for a given dataset and utilizing the relasolu-tionships observed across the ensemble to identify final solutions, which are more robust, stable or better than the individual solutions within the ensemble. The OpenEnsembles library provides a unified interface for applying transformations to data, clustering data, visualizing individual clustering solutions, visual-izing and finishing the ensemble, and calculating validation metrics for a clustering solution for any given partitioning of the data. We have documented examples of using OpenEnsem-bles to create, analyze, and visualize a number of different types of ensemble approaches on toy and example datasets. OpenEnsembles is released under the GNU General Public License version 3, can be installed via Conda or the Python Package Index (pip), and is available athttps://github.com/NaegleLab/OpenEnsembles.
Keywords: Unsupervised Learning, Ensembles, Clustering, Ensemble Clustering, Fin-ishing Techniques
1. Introduction
Clustering, a type of unsupervised learning, has been instrumental in a large number of fields for reducing data dimensionality, identifying important features, and uncovering the underlying structure of relationships that give rise to the sampled data under consideration. However, a single clustering result may represent a spurious solution (such as when an algo-rithm is stuck in a local minima) or instead represent just one of many possible structures within of complex data (such as when partitioning of an image identifies underlying shapes but fails to find differences in lighting). Ensemble clustering can be used to overcome the limitations of a single clustering solution by clustering repeatedly, each time making some
c
perturbation to either the data or the approach to clustering. The ensemble of clustering results provides more information about the structure of the underlying data, and how likely any particular grouping of objects is across the ensemble. There are several aspects to performing ensemble clustering, which include: (i) determining and implementing the appropriate perturbations, (ii) deriving a single clustering result that is representative of all the clustering solutions in the ensemble (finishing), and (iii) assessing the results of the finished ensemble, in comparison to the results of an individual solution, to understand the structure and quality of solutions (validation metrics). Our previous review on clustering in biological data covers the types of ensemble clustering and its applications (Ronan et al., 2016) in detail, where Figure 1 contains a table of example ensemble approaches and their motivations. Here, we describe the open source Python toolkit for easily implementing, visualizing, and analyzing ensemble clustering.
2. Architecture
There are three main OpenEnsembles classes that pair with the main aspects of ensemble clustering: data (storing and manipulating data), cluster (clustering data), and validation (assessing the degree of success of a clustering solution according to an objective such as compactness or connectedness). A common feature across these classes is that they are container objects for housing data, either data matrices (data class), clustering solutions (cluster class), or validation metric results of a clustering solution (validation class). Ad-ditionally, each class has a primary function (to transform, cluster, or calculate), where the classes create a common interface for interacting with a variety of transformations, clustering algorithms, and validation metrics. Interacting with any specific transformation of data, retrieving a specific clustering solution or validation metric is done by using the user-defined dictionary key that describes the specific instance. Here we will demonstrate many of the OpenEnsembles features by recreating the first publication of the use of ensem-ble clustering – Ana Fred’s use of ensemensem-bles to form a final solution through the majority vote across many non-deterministic k-means solutions (Fred, 2001). OpenEnsembles is built using many open source Python projects, including: scikit-learn (Pedregosa et al., 2012), Pandas (McKinney, 2010), Matplotlib (Hunter, 2007), NetworkX (Hagberg et al., 2008), and NumPy (Walt et al., 2011).
Data
Data is instantiated using a pandas DataFrame object, therefore all the flexibility of load-ing data from different file formats can be used to coerce the data of interest into an OpenEnsembles data object and metadata can be retained for future analysis. Once in-stantiated, data can be transformed or used as the basis for clustering or plotting. Thedata
K-means Solution (K=2)
Majority Vote: 2 solutions
Majority Vote: 10 solutions
Majority Vote: 25 solutions
1import pandas as pd 2from sklearn import datasets 3import openensembles as oe
4#Set up a dataset and put in pandas DataFrame.
5x, y = datasets.make_moons(n_samples=200, shuffle=True, noise=0.02, random_state=None) 6df = pd.DataFrame(x)
7#instantiate the oe data object
8dataObj = oe.data(df, [1,2])
9#instantiate an oe clustering object
10c = oe.cluster(dataObj)
11c_MV_arr = []
12val_arr = []
13for i in range(0,39):
14 # add a new clustering solution, with a unique name
15 name ='kmeans_'+str(i)
16 c.cluster('parent', 'kmeans', name, K=16, init ='random', n_init = 1)
17 # calculate a new majority vote solution, where c has one more solution on each iteration
18 c_MV_arr.append(c.finish_majority_vote(threshold=0.5))
19 #calculate the determinant ratio metric for each majority vote solution
20 v = oe.validation(dataObj, c_MV_arr[i])
21 val_name = v.calculate('det_ratio', 'majority_vote', 'parent')
22 val_arr.append(v.validation[val_name])
23#calculate the co-occurrence matrix
24coMat = c.co_occurrence_matrix()
Co-Occurrence Matrix (40 Solutions)
Class Perturbation Goal of Perturbation
Data Noise (resample data) Identify relationships that are robust to noise in data Data Projections into lower dimensions Avoid the curse of high dimensionality in clustering results
Cluster K Identify optimum number of clusters
Cluster Starting Point For non-deterministic algorithms: identify global minimima Cluster Parameters of Clustering Explore a range of clustering relationships
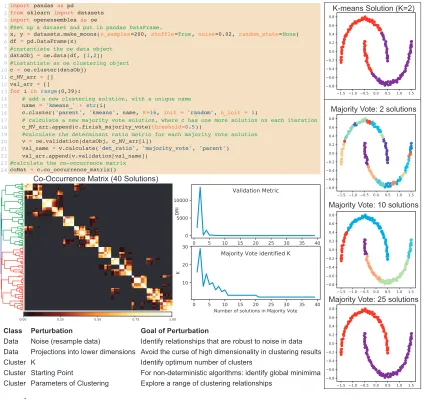
Figure 1: Code and outputs of OpenEnsembles. An ensemble approach (Fred, 2001) to find stable and optimal solutions from the combination of many solutions of the non-deterministic k-means algorithm with majority vote. Code for plotting figure panels is not included (for brevity). K-means can only find clusters that are spheroidally shaped, but as an ensemble, it can identify alternate structures. DRI stands for determinant ratio index – a measure of connectedness in clusters
Cluster
a new clustering solution each time, which is added to the clustering object container and is accessed using the unique key (here it is k-means hnumberi).
Often, one wants to produce a final partition derived from consensus across the ensemble of solutions – i.e. ‘finish’ the ensemble by building a final, single partitioning of the data. In the current version of OpenEnsembles, we have implemented majority vote as proposed by Ana Fred (Fred, 2001) and mixture models as proposed by Topchy et al. (Topchy et al., 2005). Additionally, there are two finishing techniques that operate on the co-occurrence matrix, as we have proposed previously (Schaberg et al., 2017) (Naegle et al., 2012). An entry in the co-occurrence matrix is the number of times a pair of objects cluster across the ensemble. One method treats the co-occurrence matrix as a similarity matrix and uses linkage clustering to identify clusters (Figure 1). The second method treats the co-occurrence matrix as an adjacency matrix and then finds complete subgraphs within the thresholded co-occurrence matrix via k-cliques and percolation Palla et al. (2005). Final partitions are returned as clustering objects and can be plotted and evaluated like any other clustering solution (Figure 1).
Validation
Quantitative evaluation of how well data is clustered, according to a particular objective function, is called a validation metric. Different validation metrics prioritize different aspects of clustering outcomes such as connectivity, compactness, or separation. We have written a Python package of 28 validation metrics, covering the breadth of the clValid R package of validation metrics (Brock et al., 2008). These validation metrics are available for direct use, or through the OpenEnsembles validation class, which wraps calls to validation metrics for a unified interface with other OpenEnsembles classes. As one can see from the determinant ratio index plot in Figure 1, as the number of clustering solutions in the ensemble increases, the solution both (a) stabilizes and (b) correctly identifies the number of inherent, connected clusters within the data.
Conclusion
Implementation and analysis of ensemble clustering may now be done within in succinct and readable Python code (here, roughly 20 lines of code to reproduce an entire paper of results, Figure 1). Beyond the main functionality of OpenEnsembles, to perform, finish, and validate clustering solutions on data, OpenEnsembles also contains features for calculating co-occurrence, mutual information (overlap/similarity between clustering solutions), and plotting of data and matrices generated. Future work will ideally incorporate expanded selections of algorithms and fuzzy partitioning of data, which is especially amenable to ensemble clustering.
Acknowledgments
References
Guy Brock, Vasyl Pihur, Susmita Datta, and Somnath Datta. clValid : An R Package for Cluster Validation. J. Stat. Softw., 25(4):1–22, 2008.
Ana Fred. Finding consistent clusters in data partitions. In Josef Kittler and Fabio Roli, editors, Mult. Classif. Syst., pages 309–318. Springer, lncs 2096 edition, 2001.
Aric A Hagberg, Los Alamos National, and Los Alamos. Exploring Network Structure, Dynamics, and Function using NetworkX. In Proc. 7th Python Sci. Conf. (SciPy 2008), number SciPy 2008, pages 11–15, 2008.
John D. Hunter. Matplotlib: A 2D Graphics Environment. Comput. Sci. Eng., (9):90–95, 2007.
Wes McKinney. Data Structures for Statistical Computing in Python. In St´efan van der Walt and Jarrod Millman, editors, Proc. 9th Python Sci. Conf., pages 51–56, 2010.
Kristen M Naegle, Forest M White, Douglas A Lauffenburger, and Michael B Yaffe. Robust co-regulation of tyrosine phosphorylation sites on proteins reveals novel protein interac-tions. Mol. Biosyst., 8(10):2771–2782, Aug 2012.
Gergely Palla, Imre Der´enyi, Ill´es Farkas, and Tam´as Vicsek. Uncovering the overlapping community structure of complex networks in nature and society. Nature, 435(7043): 814–8, 2005.
Fabian Pedregosa, Ga¨el Varoquaux, Alexandre Gramfort, Vincent Michel, Bertrand Thirion, Olivier Grisel, Mathieu Blondel, Peter Prettenhofer, Ron Weiss, Vincent Dubourg, Jake Vanderplas, Alexandre Passos, David Cournapeau, Matthieu Brucher, Matthieu Perrot, and ´Edouard Duchesnay. Scikit-learn: Machine Learning in Python. J. Mach. Learn. Res., 12:2825–2830, 2012.
Tom Ronan, Zhijie Qi, and Kristen M. Naegle. Avoiding common pitfalls when clustering biological data. Sci. Signal, 9(432):re6, 2016.
Katherine E. Schaberg, Venktesh S Shirure, Elizabeth A Worley, Steven C George, and Kristen M Naegle. Ensemble clustering of phosphoproteomic data identifies differences in protein interactions and cell-cell junction integrity of HER2-overexpressing cells. Integr. Biol., 9:539–547, 2017.
Alexander Topchy, Anil K Jain, and William Punch. Clustering ensembles: models of consensus and weak partitions. IEEE Trans. Pattern Anal. Mach. Intell., 27(12):1866– 81, Dec 2005.