The Thirty-Third AAAI Conference on Artificial Intelligence (AAAI-19)
Angular Triplet-Center Loss for Multi-View 3D Shape Retrieval
Zhaoqun Li,
1∗Cheng Xu,
1∗Biao Leng
1,2,3†1School of Computer Science and Engineering, Beihang University, Beijing, 100191 2Research Institute of Beihang University in Shenzhen, Shenzhen, 518057
3Beijing Advanced Innovation Center for Big Data and Brain Computing, Beihang University, Beijing, 100191
{lizhaoqun, cxu, lengbiao}@buaa.edu.cn
Abstract
How to obtain the desirable representation of a 3D shape, which is discriminative across categories and polymerized within classes, is a significant challenge in 3D shape retrieval. Most existing 3D shape retrieval methods focus on capturing strong discriminative shape representation with softmax loss for the classification task, while the shape feature learning with metric loss is neglected for 3D shape retrieval. In this paper, we address this problem based on the intuition that the cosine distance of shape embeddings should be close enough within the same class and far away across categories. Since most of 3D shape retrieval tasks use cosine distance of shape features for measuring shape similarity, we propose a novel metric loss named angular triplet-center loss, which directly optimizes the cosine distances between the features. It inher-its the triplet-center loss property to achieve larger inter-class distance and smaller intra-class distance simultaneously. Un-like previous metric loss utilized in 3D shape retrieval meth-ods, where Euclidean distance is adopted and the margin de-sign is difficult, the proposed method is more convenient to train feature embeddings and more suitable for 3D shape re-trieval. Moreover, the angle margin is adopted to replace the cosine margin in order to provide more explicit discriminative constraints on an embedding space. Extensive experimental results on two popular 3D object retrieval benchmarks, Mod-elNet40 and ShapeNetCore 55, demonstrate the effectiveness of our proposed loss, and our method has achieved state-of-the-art results on various 3D shape datasets.
Introduction
With the development of 3D sensing techniques and avail-ability of large-scale 3D shape repositories (Chang et al. 2015; Wu et al. 2015), 3D shape retrieval has become more significant in 3D shape analysis communities with wide ap-plication prospects. Among the existing 3D shape retrieval methods, view-based methods have achieved best perfor-mance so far. In view-based 3D shape retrieval, deep shape representation learning over multi-view image sequences of 3D shapes (Xu et al. 2018; Dai, Xie, and Fang 2018) have dramatically advanced various 3D shape retrieval tasks in recent years.
∗
They contributed equally to this work
†
Corresponding author
Copyright c2019, Association for the Advancement of Artificial Intelligence (www.aaai.org). All rights reserved.
The most fundamental issue in 3D shape retrieval is how to capture the efficient shape embeddings that make the in-stances from the same category closer and those from dif-ferent categories farther away. A well-known general re-trieval algorithm of view-based methods is Multi-view Con-volutional Neural Networks (MVCNN) (Su et al. 2015), extracting the visual feature of each view and aggregat-ing them into a compact shape representation in a unified framework. Most view-based methods (Leng et al. 2018; 2016) like MVCNN build discriminative shape features for the object classification task with the softmax loss. How-ever, softmax loss only focuses on distinguishing features across classes and it ignores the intra-class similarity, which is not specifically suitable for 3D shape retrieval task. Re-cently, (He et al. 2018) firstly formally introduce deep met-ric learning in 3D shape retrieval community to tackle this problem, arguing that the metric loss such as triplet loss or center loss can bring the performance benefits to 3D shape retrieval. Moreover, they propose the triplet-center loss (TCL) that can optimize the features by minimizing the intra-class variance while also maximizing the inter-class variance at the same time. Inspired by their work, we de-velop our method with regard to the deep metric learning in view-based retrieval methods.
Most 3D shape retrieval approaches based on the metric loss like TCL (He et al. 2018) use the Euclidean distance of features to optimize the embedding space in the training, while the cosine distance is adopted for measuring shape similarity in the testing. This inconsistent metric restricts the feature learning of these methods. Moreover, the desirable Euclidean margin is difficult to determine because the range of Euclidean distance between features could be very large.
M
ax P
ool
ing
CNN
α β
anchor
positive center negative center positive feature
negative feature
Angular Triplet-Center loss
Fully-connected
MVCNN Framework
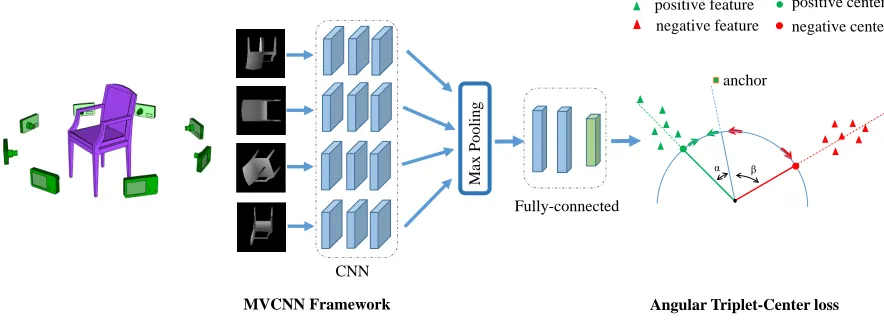
Figure 1: The flowchart of the proposed 3D shape retrieval framework. We use MVCNN to extract model features and the pro-posed ATCL is the supervision signal. In the training process, the ATCL encourages the anchor (extracted feature) to minimize the angle with its corresponding positive center while maximizing the angles with other negative centers.
on cosine margincos(θ) +msuffers from unstable param-eter update and is hard to converge if the number of a mini-batch is small, we take an equivalent alternative way that the angular margin(θ+m)is adopted to directly optimize shape features in angular space based on both L2 normalized instance features and center features. In our method, ATCL is built on the MVCNN framework for view-based 3D shape retrieval that unifies the shape feature learning and deep met-ric learning into an end-to-end fashion. The flowchart of our method is shown in Fig. 1. The rendered images of a shape are input to the MVCNN to generate a shape feature. Then the feature embeddings are learned under the supervision of our angular triplet-center loss.
Our proposed metric loss can obtain highly discriminative and robust shape representations and has the following key advantages. Firstly, the decision boundary of angular margin has more explicit discriminative constraints on an embed-ding space than those retrieval methods based on Euclidean distance. Meanwhile, it inherits the property of TCL to min-imize the intra-class distance and maxmin-imize inter-class dis-tance at the same time. In addition, the proposed loss is easy to converge and the training is stable to update the parameters, especially for large-scale 3D shape dataset like ShapeNetCore55 (Chang et al. 2015). Our method achieves the state-of-the-art performance on ModelNet dataset and ShapeNetCore55 dataset.
In summary, our main contributions are as follows. • We investigate the angular metric learning that the shape
features are directly optimized in angular embedding space for view-based retrieval, which is more suitable for the nature of 3D shape retrieval task.
• We propose a novel loss function named angular triplet-center loss that provides more explicit discriminative con-straints on an embedding space than those methods based on Euclidean distance.
• Our method achieves the state-of-the-art on both Mod-elNet and ShapeNetCore55 datasets, which demonstrates
that our shape features are more discriminative.
Related work
A large number of works (Ioannidou et al. 2017) have been proposed to address 3D shape retrieval problem in recent years. In particular, with the explosive growth of large-scale public 3D shape repositories and the success made by the convolutional neural network (CNN) in computer vision, the CNN-based 3D shape retrieval methods have achieved impressive performance. In this section, we will mainly in-troduce representative 3D shape retrieval methods based on deep learning techniques.
Generally, 3D shape retrieval methods could be coarsely divided into two categories: model-based methods and view-based methods. The model-view-based method directly extracts the shape feature from the raw 3D representations of ob-jects, such as polygon meshed (Xie et al. 2017; Boscaini et al. 2016), voxel grid (Ma et al. 2018; Li et al. 2016), point cloud (Qi et al. 2017a; 2017b), or octree representa-tion (Wang et al. 2017). For example, (Qi et al. 2016) in-troduce two volumetric CNN network architectures includ-ing the auxiliary part-based classification task and the long anisotropic kernel for long-distance interactions, which im-proves the performance of volumetric CNN-based 3D shape recognition methods. (Shen et al. 2018) propose kernel cor-relation and graph pooling to capture local patterns, leading a robust improvement for PointNet-like methods. (Wang et al. 2017) performs 3D CNN on the octree representation of 3D shapes, showing more compact storage and fast com-putation than existing model-based approaches. Although model-based methods can effectively interpret the geometric characteristics of 3D shapes, their performances are limited by the high computational complexity (e.g., voxel represen-tation) and noise of naive 3D shape representation, such as incompleteness or occlusions.
Euclidean margin
Angular margin
anchor
positive center
negative center positive feature
negative feature
(a) softmax loss (b) center loss + softmax loss (c) triplet-center loss (d) angular triplet-center loss
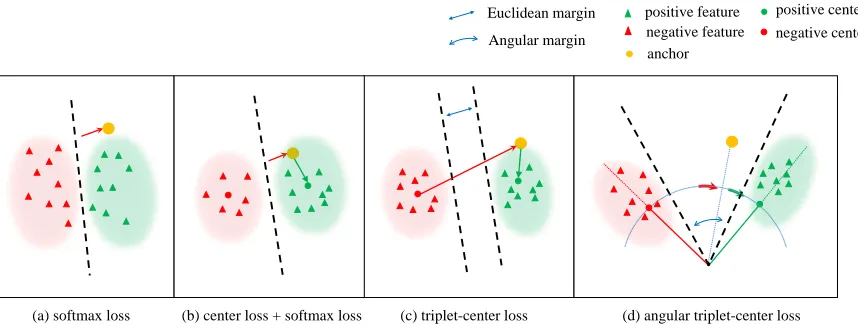
Figure 2: The effect of different loss functions on the feature distribution. (a) tries to find a decision boundary to separate different classes features, it pushes the anchor away from the decision boundary. (b) adds a force to keep the anchor close to its corresponding center. (c) pulls the anchor to its corresponding center while it pushes the features away from the other centers (d) rotates the anchor to its positive center and it augments the angles between the anchor and negative centers. Compared with (b) (c) which use Euclidean distance, our method conducts the optimization directly in the angular space.
learning example of the view-based technique is GIFT (Bai et al. 2016), extracting each single view feature by using CNN with GPU acceleration and adopting the inverted file to reduce computation in distance metrics. Apart from a single view, many researchers focus on building a compact shape feature through an informative multi-view image sequence of the 3D shape. For example, (Su et al. 2015) use a set of CNN to extract each view’s feature and then aggregate in-formation from multiple views into a single and compact shape representation with the element-wise maximum oper-ation. (Huang et al. 2018) develop a local MVCNN shape descriptors, which generates a local descriptor for any point on the shape and can be directly applicable to a wide range of shape analysis tasks. Recently, (Feng et al. 2018) pro-pose a view-group-shape framework (GVCNN) to exploit intrinsic hierarchical correlation and discriminability among views, achieving a significant performance gain on the 3D shape retrieval task. Typically, the deep representation of multiple views performs more discriminative for 3D shapes and leads the best retrieval results on various 3D shape datasets.
The above 3D shape retrieval methods are trained to learn the discriminative 3D shape representation under the supervision of softmax loss for the object classification task. However, this classification task is not specifically desirable for 3D shape retrieval task. Inspired the widely adopted deep metric learning in image retrieval / person re-identification task, (He et al. 2018) recently introduce two popular metric learning loss, triplet loss and center loss, in 3D shape retrieval community and achieve state-of-the-art results on ModelNet and ShapeNetCore55 datasets. Triplet loss (Schroff, Kalenichenko, and Philbin 2015) is proposed to separate shape features within one class from those fea-tures from different classes by a distance margin. And cen-ter loss (Wen et al. 2016) learns the discriminative features via optimizing a center vector for each class and penalizing
the distance between the features and their corresponding class centers. Combining the advantages of triplet loss and center loss, TCL is proposed for 3D shape retrieval and it can optimize the features directly by minimizing the intra-class variance while also maximizing the inter-intra-class vari-ance at the same time. However, these methods prefer to use the metric loss based on Euclidean distance, while most 3D shape retrieval tasks adopt cosine distance to measure shape similarity. To make this gap, we propose a novel loss called Angular triplet-center loss. In addition, (Wang et al. 2018) propose the CosineFace loss for face verification, which is similar to our method. However, our loss directly optimizes the angular distance between different features of instances, while CosineFace is built upon the normalized weights and features.
Proposed method
The goal of our method is to obtain the discriminative shape representation via directly optimizing the geometric distri-bution of features in cosine (angle) embedding space.
optimize the embedding space. In the next section, we first review on TCL and then propose our loss function.
Review on Triplet-Center Loss
TCL is proposed for 3D model retrieval that leverages the advantage of triplet loss and center loss. Given a training datasetX ∈RD, letY={y1, y2, ..., y|X |}denote the
corre-sponding label set,yi ∈ {1,2, ..., K}whereKis the
num-ber of classes. Deep metric learning aims to train a neural network, denoted byfθ(·), which maps the data inX onto a
new feature spaceF ∈Rn. LetD(·)be a metric function in
Fwhich can measure the distances between features. For writing convenience, we use fi ∈ Rn to represent
fθ(xi) which is the extracted feature from CNN. Given a
batch of training data withM samples, the TCL can be ex-pressed as:
LT C= M
X
i=1
max(D(fi, cyi) +m−min j6=yi
D(fi, cj),0) (1)
whereD(·)represents the squared Euclidean distance func-tion:
D(fi, cyi) =
1
2||fi−cyi||
2 (2)
Here, m is a manually designed Euclidean margin and ci ∈Rnis the center of classi.
The TCL mainly contains two tasks: reduce the distance between feature and corresponding center and enlarge the distance between features and negative center. It can effec-tively minimize the intra-class variance while also maximize the inter-class variance at the same time. However, similar to center loss and triplet loss, TCL still uses Euclidean distance for 3D shape retrieval task which means that the optimiza-tion is not direct for cosine distance. Moreover, the design of marginmis important for a good performance, while the squared Euclidean margin is not easy to design.
Angular Triplet-Center Loss
Motivation.To address the above issues, we propose a met-ric loss called angular triplet-center loss (ATCL) that di-rectly optimizes the angular distances between the features. Intuitively, improving the cosine distance distribution is a more direct way to enhance the discriminative power of the features. Meanwhile, the angular margin has a very clear ge-ometric interpretation, it corresponds to the angular distance on the hypersphere. And the margin design for angular dis-tance is much more simple since the angle is limited in[0, π]. Under these considerations, we design the angular triplet-center loss for the sake of discriminative across categories and polymerized within on class shape representation.
Proposed loss function.We assign each class a centerci ∈ Rn. Different from the explanation in center loss and TCL,
the center here represents thedirectionof the corresponding class features. For writing convenience, we denotev˜as the normalized vector ofv:˜v= ||vv||
2. LetC={c1, c2, ..., cK}
denote center set andchardi ∈ C\{cyi}be thenearest
neg-ative centerwhich is the closest center tofiunder a metric
functionD(·). Here,hardi ∈ {1,2, ..., K} is the index of
the nearest negative center. So we have:
min
j6=yiD(fi, cj) =D(fi, chardi) (3)
We callαi = arccos( ˜fi
T
·˜cyi)positive angle to indicate
the angle between feature and corresponding center. And
βi= arccos( ˜fi
T
·˜chardi)is callednegative angle. Inspired
by TCL, we can get a loss function about cosine distance via replacing directly theD(·)in Eq. 1 by cosine distance:
Lcos= M
X
i=1
max(cosd(fi, cyi) +m−min
j6=yicosd(fi, cj),0)
=
M
X
i=1
max(cos(βi) +m−cos(αi),0)
(4) where
cosd(fi, cj) = 1−
fiT·cj
||fi||2· ||cj||2
= 1−cos(fi, cj) (5)
But in practice, this form of loss is not easy to opti-mize. In the process of implementation, we observe that the drop of loss is not very stable when the cos margin is large (> cos23π). Notice that the cosine value has a one-to-one mapping from the cosine space to the angular space when the angle is in[0, π]. Therefore, equivalently, we can choose directly the angle between two vectors as their dis-tance. Moreover, the angular margin has a more clear geo-metric interpretation than cosine margin. With this idea, we propose ATCL by a new metric function:
LAT C = M
X
i=1
max(arccos( ˜fi
T
·˜cyi) +m
−min
j6=yi
arccos( ˜fi
T ·c˜j),0)
=
M
X
i=1
max(αi+m−βi,0)
(6)
As shown above, the positive angle and the negative angle are used directly in the loss design. With this final version of ATCL, the training can converge with a large scale of angu-lar margin.
Back-propagation.As the Eq. 4 and 6 show, the features need to pass aL2-normalization layer to compute the cosine value or angle. Besides, centers are also normalized in every iteration. Here, we first formulate the gradients of normal-ized features and then that of normalnormal-ized centers.
Given a mini-batch with M samples,LAT C can be
re-garded as the summation of each sample’s lossLi:
Li= max(αi+m−βi,0) (7)
we have:
∂LAT C
∂f˜i
=∂Li ∂f˜i
= ˜chardi·δ(Li>0)
q 1−( ˜fi
T
·˜chardi)
2
− ˜cyi·δ(Li>0)
q 1−( ˜fi
T ·c˜yi)
2
= [c˜hardi
sin(βi)
− ˜cyi
sin(αi)
]·δ(Li>0)
(8)
Turn to the centers, for stability, the update for centers is not strictly using the gradient derived by Eq. 6. Instead, we use an “average version” as mentioned in center loss. For simplicity, we denoteg1i=
˜
fi
sin(βi)andg2i=
˜
fi
sin(αi), then:
∆cj=
PM
i=0g1i·δ(Li>0)·δ(hardi =yj)
1 +PM
i=0δ(Li >0)·δ(hardi=yj)
−
PM
i=0g2i·δ(Li>0)·δ(i=yj) 1 +PM
i=0δ(Li>0)·δ(i=yj)
(9)
Training with softmax loss.As a general metric loss, ATCL can be used independently to guide the feature learning and it can converge stably. Moreover, we notice that the combi-nation of ATCL and softmax loss functions can further im-prove the discriminative power of features. This is because that softmax loss drops more stably and quickly at the be-ginning of the training process compared to ATCL. And this is useful for centers’ training since the initial feature distri-bution changes a lot during the training process with single ATCL supervision. Formally, the combination can be writ-ten asLtotal:
Ltotal=Lsof tmax+λ·LAT C (10)
whereλis a trade-off hyper-parameter. We will discuss the influence ofλin the experiment section.
Discussion
Comparison with TCL.The main difference between two loss functions is that TCL uses Euclidean distance in the loss design while ATCL uses angular distance. The angular mar-gin is more suitable for the retrieval task. And it has a more clear geometric interpretation than squared Euclidean dis-tance. In fact, in the case of Euclidean space, the value of margin depends largely on the magnitude of the elements in the feature vector which makes margin design difficult. In contrast, the angular between two vectors is always in[0, π] so that the design of angular margin is easier.
Angular margin. An appropriate angular margin θ (be-tween 10π and π3) can focus on the hard samples in dataset. Ifθis too large, the loss will concern about the samples that are not important in the retrieval. We can give an explana-tion from Eq. 7 and 8. With a small angular marginθ, the losses will not back-propagate for easy samples since their angular distributions are “perfect” that makeLi= 0. As the
Methods ModelNet40 ModelNet10
AUC MAP AUC MAP
ShapeNets 49.94% 49.23% 69.28% 68.26%
DeepPano 77.63% 76.81% 85.45% 84.18%
MVCNN - 78.90% -
-GIFT 83.10% 81.94% 92.35% 91.12%
GVCNN - 85.70% -
-TCL(VGG M) 85.59% 84.35% -
-ATCL 86.52% 85.35% 91.19% 90.60%
ATCL+softmax 87.23% 86.11% 92.49% 92.07%
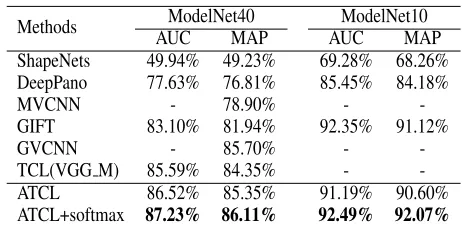
Table 1: The performance comparison with state-of-the-art on ModelNet.
angular margin grows, the task becomes more difficult and more losses will be propagated. As a result, the loss cannot capture the hard samples to which the training should pay more attention. In our experiment,θ = 0.7(≈40◦)has the best performance.
Experiment
In this section, we evaluate the performance of ATCL on two representative large-scale 3D shape datasets and also com-pare the results with the state-of-art methods. Following we provide comprehensive experiments to discuss the compar-ison with other metric loss. And we also investigate the in-fluence of parameters, including the angular margin and the hyper-parameterλ, on the performance of 3D shape retrieval in the last part.
Implementation. Our experiments are conducted on a server with 2 Nvidia GTX1080Ti GPUs, an Intel Xeon CPU and 128G RAM. The proposed method is implemented in PyTorch. For the structure of the CNN, we use VGG-M (Chatfield et al. 2014) as the base network in all our experiments. VGG-M has 5 convolution layers and 3 fully-connected layers (fc6-8), and we place view pooling layer after (conv5). The network is pre-trained on ImageNet (Deng et al. 2009) and the centers are initialized by a Gaussian dis-tribution of mean value 0 and standard deviation 0.01. We use the stochastic gradient descent (SGD) algorithm with momentum 2e-4 to optimize the loss. The batch size for the mini-batch is set to 20. The learning rate for the CNN is 1e-4 and is divided by 10 at the epoch 80. Specially, the learning rate for centers is always 1e-4 in the training process. The total training epochs are 120.
In the retrieval process, we render 8 views by Phong re-flection in different positions to generate depth images. The size of each image is 224x224 pixels in our experiment. Then all these 8 images are put into the CNN together to generate the model feature. The features extracted for testing are the outputs of the penultimate layer,i.e. fc7. The cosine distance is used for the evaluation.
Retrieval on large-scale 3D datasets
ShapeNet-Methods Micro Macro Micro + Macro
F-measure MAP NDCG F-measure MAP NDCG F-measure MAP NDCG
Wang 0.246 0.600 0.776 0.163 0.478 0.695 0.205 0.539 0.753
Li 0.534 0.749 0.865 0.182 0.579 0.767 0.358 0.664 0.816
Kd-network 0.451 0.617 0.814 0.241 0.484 0.726 0.346 0.551 0.770
MVCNN 0.612 0.734 0.843 0.416 0.662 0.793 0.514 0.698 0.818
GIFT 0.661 0.811 0.889 0.423 0.730 0.843 0.542 0.771 0.866
Our 0.665 0.843 0.885 0.404 0.777 0.851 0.535 0.810 0.868
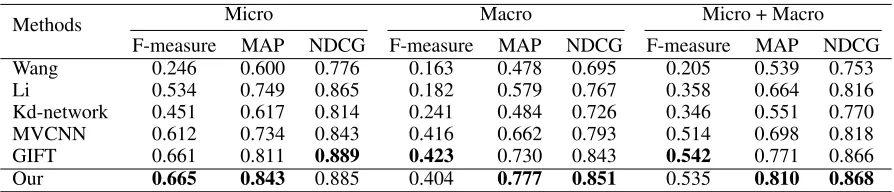
Table 2: The performance comparison on SHREC16 perturbed dataset
Loss function AUC MAP
softmax loss 79.67% 78.28%
softmax loss+center loss 82.24% 80.95%
triplet loss 80.12% 78.90%
TCL(VGG M) 85.59% 84.35%
ATCL 86.52% 85.35%
ATCL+softmax loss 87.23% 86.11%
Table 3: The performance comparison with different loss functions on ModelNet40.
Core55 dataset (Chang et al. 2015). Next, we will give a de-tailed introduction of these datasets.1)ModelNet Dataset: this dataset is a large-sacle 3D CAD model dataset com-posed of 127,915 3D CAD models from 662 categories. It has two subsets called ModelNet40 and ModelNet10. Mod-elNet40 dataset contains 12,311 models from 40 categories and the second one contains 4,899 models from 10 cate-gories. For our evaluation experiment, we adopt the same method to split training and test set as mentioned in (Wu et al. 2015),i.e. randomly select 100 unique models per cat-egory from the subset, where the first 80 models are used for training and the rest for testing.2)ShapeNetCore55: the dataset from SHape REtrieval Contest 2016 (Savva et al. 2016) is a subset of the full ShapeNet dataset with clean 3D models and manually verified category and alignment an-notations. This dataset contains 51,190 3D shapes from 55 common categories divided into 204 sub-categories. There are two versions in this dataset. The first is “normal” dataset in which the shapes are aligned. And the second is more challenging “perturbed” dataset where all shapes are rotated randomly. We follow the official training and testing split method to conduct our experiment on perturbed version, where the database is split into three parts, 70% shapes used for training, 10% shapes for validation data and the rest 20% for testing.
The evaluation metrics used in this paper include mean average precision (MAP), area under curve (AUC) and F-measure. Refer to (Wu et al. 2015; Savva et al. 2016) for their detailed definitions.
Comparison with the state-of-the-arts. In experiments for ModelNet40 and ModelNet10 datasets, we choose 3D ShapeNets (Wu et al. 2015), DeepPano (Shi et al. 2015), MVCNN (Su et al. 2015), GVCNN (Feng et al. 2018), TCL (He et al. 2018) and GIFT (Bai et al. 2016)
meth-ods for comparison. Note that MVCNN, GVCNN and GIFT are all trained only with softmax loss. The experimental re-sults and comparison among different methods are presented in Tab. 1. Our method (ATCL+softmax loss) achieves the best retrieval MAP of86.11%on ModelNet40 and92.07% on ModelNet10 respectively. We outperform MVCNN by 7.21%in terms of MAP on ModelNet40 dataset. Compared with GIFT, which leverages an off-line re-ranking technique, the combination of ATCL and softmax loss shows its supe-riority to improve the MAP by4.17%on ModelNet40. Be-sides, as the current state-of-the-art view-based method on ModelNet40, GVCNN is trained with the softmax loss on GoogleLenet and an addition post-processing that the low-rank Mahalanobis metric learning is adopted. Compared with it, our method not only gains0.41%improvement of MAP on ModelNet40, but also has higher efficiency with the end-to-end training fashion. The above results demon-strate that our deep metric learning method is more effective than softmax loss in retrieval task.
It should be noted that our method is built on the basis of triplet-center loss (TCL). To keep fair comparison, we implement TCL on VGG M according to the settings men-tioned in (He et al. 2018). The result shows that our method (ATCL) exceed TCL by1%in MAP which means that the optimization in angular distance is more effective than that in Euclidean distance.
For the evaluation in ShapeNetCore55 dataset, we take three types of results including macro, micro and mean of macro and micro. Macro is mainly for providing an un-weighted average on the entire database and Micro aims to dispose the influence of different model categories sizes. In this dataset, two labels are provided and an evaluation called the normalized discounted cumulative gain (NDCG) is de-fined in this competition.
We choose Wang (Savva et al. 2016), Li (Savva et al. 2016), K-d network (Klokov and Lempitsky 2017), MVCNN (Su et al. 2015) and GIFT (Bai et al. 2016) methods for comparison. As shown in Tab. 2, our method achieves the state-of-the-art result. Compared with GIFT which uses the re-ranking technique, the F-measure in terms of macro in our method is lower. However, our method is more efficient as no post-processing is used.
Compared with other loss functions.
0.82 0.83 0.84 0.85 0.86 0.87 0.88
0.01 0.1 1 10
𝜆𝜆
0.82 0.83 0.84 0.85 0.86 0.87 0.88
0.2 0.5 0.7 1 1.2 1.5
𝑚𝑚 MAP
AUC
(a) (b)
Figure 3: The performances of different hyper-parameter settings in ModelNet40.
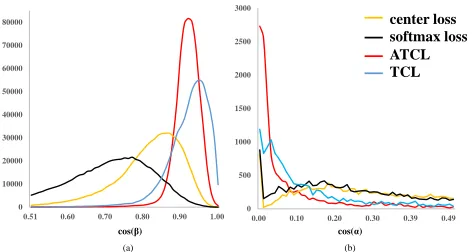
0 10000 20000 30000 40000 50000 60000 70000 80000
0.51 0.60 0.70 0.80 0.90 1.00
cos(β) cos(α)
(a) (b)
0 500 1000 1500 2000 2500 3000
0.00 0.10 0.20 0.30 0.39 0.49
center loss softmax loss ATCL TCL
Figure 4: Histogram statistics of cosine distance with differ-rent methods in ModelNet40. (a) shows the inter-class co-sine distance distribution and (b) is the intra-class coco-sine distance distribution. Compared to the Euclidean distance based method, ATCL is more suitable for optimizing cosine distance between features.
the performance by 7.07% in MAP from single softmax loss supervision. And the combination with softmax loss, compared to single ATCL, gives an improvement of0.76% in MAP. This is owing to the effect of grouping features brought by softmax loss at the beginning of the training pro-cess which encourages the centers to converge better. By us-ing angular metric loss function, our method achieves0.71%
gains in AUC and1% in MAP compared with TCL. This
demonstrates optimization on angular margin works better than that on Euclidean margin.
We show in Fig. 4 the histogram of the cosine distance be-tween features. The inter-class distance is shown in Fig. 4 (a) and Fig. 4 (b) is the intra-class distance. As we can see, with the supervision of ATCL, the distribution of cosine distance is much better than other Euclidean distance based methods. Most of the intra-class distances in ATCL are nearly 0 while inter-class cosine distances are mainly concentrated between 0.9 and 1. It convincingly demonstrates that our loss design can significantly improve the discriminative power of em-bedded features.
Parameter analysis
There two hyper-parameters in our method which are impor-tant for the implementation. One is the loss weight of ATCL when training jointly with softmax loss λand the other is the angular marginm. We conduct experiments with differ-ent values of hyper-parameters to observe the influence on the final performance.
Dicussion on angular margin.We use single ATCL as su-pervision loss and the same parameter settings to conduct experiments in this section. The results with different m are shown on the left of Fig. 3. It should be pointed out the margin value here is in radian. ATCL converges across a wide range of angular margin from 0.2 (≈ 11◦) to 1.5 (≈ 86◦). After testing different margins, we find that the performance changes slightly whenmis not too large. How-ever, MAP score drops a lot when mbecomes larger than 1. In fact, the angle values between centers are distributed around π2. Although a large angular margin encourages the inter-class distance to become larger, it makes every sample in a mini-batch become hard samples (the target is too diffi-cult). Therefore, a large angular margin has a bad influence on focusing on real hard samples. And adding too much mar-gin (>1.5) penalty will cause the training divergence. The best margin value for the ModelNet is0.7with86.48%in AUC and85.21%in MAP.
Dicussion on loss weight.We choosem = 0.7to conduct all experiments in this section. The hyper-parameter λ in-dicates the weight of two tasks. A small value ofλmeans more attention to the classification task. For obtaining the best performance using different loss weight, we adjust the learning rate in different cases to conduct the experiments. As λincreases from 0.01, the performance first rises and then drops. The performances are shown on the right of Fig. 3. We can observe that the best setting is 1:1 which tells us that the combination of two supervisions improves each other.
Conclusion
In this paper, we propose a novel metric loss function named angular triplet-center loss for the 3D shape retrieval. The loss design inherits the advantage of triplet-center loss and is more powerful than it. Compared with other retrieval meth-ods based on the metric loss, our loss function focus on op-timizing the feature distribution on angle space, providing more explicit discriminative constraints on the shape em-bedding than Euclidean metric. Extensive results show that the proposed loss outperforms state-of-the-art methods on two large-scale 3D shape datasets. The learned shape repre-sentation is highly discriminative and robust, which is more suitable for 3D shape retrieval task.
Acknowledgements
References
Bai, S.; Bai, X.; Zhou, Z.; Zhang, Z.; and Jan Latecki, L. 2016. Gift: A real-time and scalable 3d shape search engine. InProceedings of the IEEE Conference on Computer Vision and Pattern Recognition, 5023–5032.
Boscaini, D.; Masci, J.; Rodol`a, E.; and Bronstein, M. 2016. Learning shape correspondence with anisotropic convolu-tional neural networks. InAdvances in Neural Information Processing Systems, 3189–3197.
Chang, A. X.; Funkhouser, T.; Guibas, L.; Hanrahan, P.; Huang, Q.; Li, Z.; Savarese, S.; Savva, M.; Song, S.; Su, H.; et al. 2015. Shapenet: An information-rich 3d model repository. arXiv preprint arXiv:1512.03012.
Chatfield, K.; Simonyan, K.; Vedaldi, A.; and Zisserman, A. 2014. Return of the devil in the details: Delving deep into convolutional nets.arXiv preprint arXiv:1405.3531. Dai, G.; Xie, J.; and Fang, Y. 2018. Siamese cnn-bilstm architecture for 3d shape representation learning. InIJCAI, 670–676.
Deng, J.; Dong, W.; Socher, R.; Li, L.-J.; Li, K.; and Fei-Fei, L. 2009. Imagenet: A large-scale hierarchical im-age database. InComputer Vision and Pattern Recognition, 2009. CVPR 2009. IEEE Conference on, 248–255. Ieee. Feng, Y.; Zhang, Z.; Zhao, X.; Ji, R.; and Gao, Y. 2018. Gvcnn: Group-view convolutional neural networks for 3d shape recognition. InProceedings of the IEEE Conference on Computer Vision and Pattern Recognition, 264–272. He, X.; Zhou, Y.; Zhou, Z.; Bai, S.; and Bai, X. 2018. Triplet-center loss for multi-view 3d object retrieval. arXiv preprint arXiv:1803.06189.
Huang, H.; Kalogerakis, E.; Chaudhuri, S.; Ceylan, D.; Kim, V. G.; and Yumer, E. 2018. Learning local shape de-scriptors from part correspondences with multiview convo-lutional networks. ACM Transactions on Graphics (TOG) 37(1):6.
Ioannidou, A.; Chatzilari, E.; Nikolopoulos, S.; and Kom-patsiaris, I. 2017. Deep learning advances in computer vision with 3d data: A survey. ACM Computing Surveys (CSUR)50(2):20.
Klokov, R., and Lempitsky, V. 2017. Escape from cells: Deep kd-networks for the recognition of 3d point cloud models. InComputer Vision (ICCV), 2017 IEEE Interna-tional Conference on, 863–872. IEEE.
Leng, B.; Liu, Y.; Yu, K.; Zhang, X.; and Xiong, Z. 2016. 3d object understanding with 3d convolutional neural networks. Information sciences366:188–201.
Leng, B.; Zhang, C.; Zhou, X.; Xu, C.; and Xu, K. 2018. Learning discriminative 3d shape representations by view discerning networks. IEEE transactions on visualization and computer graphics.
Li, Y.; Pirk, S.; Su, H.; Qi, C. R.; and Guibas, L. J. 2016. Fpnn: Field probing neural networks for 3d data. In Ad-vances in Neural Information Processing Systems, 307–315. Ma, C.; Guo, Y.; Lei, Y.; and An, W. 2018. Binary vol-umetric convolutional neural networks for 3-d object
recog-nition.IEEE Transactions on Instrumentation and Measure-ment(99):1–11.
Qi, C. R.; Su, H.; Nießner, M.; Dai, A.; Yan, M.; and Guibas, L. J. 2016. Volumetric and multi-view cnns for object clas-sification on 3d data. InProceedings of the IEEE conference on computer vision and pattern recognition, 5648–5656. Qi, C. R.; Su, H.; Mo, K.; and Guibas, L. J. 2017a. Pointnet: Deep learning on point sets for 3d classification and seg-mentation. Proc. Computer Vision and Pattern Recognition (CVPR), IEEE1(2):4.
Qi, C. R.; Yi, L.; Su, H.; and Guibas, L. J. 2017b. Point-net++: Deep hierarchical feature learning on point sets in a metric space. InAdvances in Neural Information Processing Systems, 5099–5108.
Savva, M.; Yu, F.; Su, H.; Aono, M.; Chen, B.; Cohen-Or, D.; Deng, W.; Su, H.; Bai, S.; Bai, X.; et al. 2016. Shrec’16 track large-scale 3d shape retrieval from shapenet core55. InProceedings of the eurographics workshop on 3D object retrieval.
Schroff, F.; Kalenichenko, D.; and Philbin, J. 2015. Facenet: A unified embedding for face recognition and clustering. In Proceedings of the IEEE conference on computer vision and pattern recognition, 815–823.
Shen, Y.; Feng, C.; Yang, Y.; and Tian, D. 2018. Mining point cloud local structures by kernel correlation and graph pooling. InProceedings of the IEEE Conference on Com-puter Vision and Pattern Recognition, volume 4.
Shi, B.; Bai, S.; Zhou, Z.; and Bai, X. 2015. Deeppano: Deep panoramic representation for 3-d shape recognition. IEEE Signal Processing Letters22(12):2339–2343. Su, H.; Maji, S.; Kalogerakis, E.; and Learned-Miller, E. 2015. Multi-view convolutional neural networks for 3d shape recognition. InProceedings of the IEEE international conference on computer vision, 945–953.
Wang, P.-S.; Liu, Y.; Guo, Y.-X.; Sun, C.-Y.; and Tong, X. 2017. O-cnn: Octree-based convolutional neural net-works for 3d shape analysis.ACM Transactions on Graphics (TOG)36(4):72.
Wang, F.; Cheng, J.; Liu, W.; and Liu, H. 2018. Additive margin softmax for face verification. IEEE Signal Process-ing Letters25(7):926–930.
Wen, Y.; Zhang, K.; Li, Z.; and Qiao, Y. 2016. A dis-criminative feature learning approach for deep face recog-nition. InEuropean Conference on Computer Vision, 499– 515. Springer.
Wu, Z.; Song, S.; Khosla, A.; Yu, F.; Zhang, L.; Tang, X.; and Xiao, J. 2015. 3d shapenets: A deep representation for volumetric shapes. InProceedings of the IEEE conference on computer vision and pattern recognition, 1912–1920. Xie, J.; Dai, G.; Zhu, F.; Wong, E. K.; and Fang, Y. 2017. Deepshape: Deep-learned shape descriptor for 3d shape re-trieval. IEEE transactions on pattern analysis and machine intelligence39(7):1335–1345.