humanity’s health and survival within the biosphere into the indefinite future. It is not so much the individual core scientific questions that set ecological economics apart – since these questions are covered independently in other disciplines as well – but rather the treatment of these questions in an integrated, transdisciplinary way, which is essential to their understanding and effective use in policy. The solutions being considered in ecologial eco-nomics are deserving of increasing attention.
See also:Adaptive Management and Integrative
assessments; Ecological Footprint; Ecosystem Services; Limits to Growth; Sustainable Development.
Further Reading
Barbier EB, Burgess JC, and Folke C (1994)Paradise Lost? The Ecological Economics of Biodiversity, 267pp. London: Earthscan. Boulding KE (1966) The economics of the coming spaceship earth.
In: Jarrett H (ed.)Environmental Quality in a Growing Economy, pp. 3–14. Baltimore, MD: Resources for the Future/Johns Hopkins University Press.
Boumans R, Costanza R, Farley J,et al.(2002) Modeling the dynamics of the integrated earth system and the value of global ecosystem services using the GUMBO model.Ecological Economics 41: 529–560.
Costanza R (ed.) (1991)Ecological Economics: The Science and Management of Sustainability. New York: Columbia University Press. Costanza R (2000)Visions of alternative (unpredictable) futures and their
use in policy analysis. Conservation Ecology4(1): 5http://
www.consecol.org/vol4/iss1/art5/(accessed October 2007).
Costanza R (2001) Visions, values, valuation and the need for an ecological economics.BioScience51: 459–468.
Costanza R, Cumberland JC, Daly HE, Goodland R, and Norgaard R (1997)An Introduction to Ecological Economics, 275pp. Boca Raton, FL: St. Lucie Press.
Costanza R, Voinov A, Boumans R,et al.(2002) Integrated ecological economic modeling of the Patuxent River watershed, Maryland. Ecological Monographs72: 203–231.
Costanza R, Wainger L, Folke C, and Ma¨ler K-G (1993) Modeling complex ecological economic systems: Toward an evolutionary, dynamic understanding of people and nature.BioScience 43: 545–555.
Daly HE (1968) On economics as a life science.Journal of Political Economy76: 392–406.
Farley J and Costanza R (2002) Envisioning shared goals for humanity: A detailed shared vision of a sustainable and desirable USA in 2100. Ecological Economics43: 245–259.
Jansson AM, Hammer M, Folke C, and Costanza R (eds.) (1994) Investing in Natural Capital: The Ecological Economics Approach to Sustainability, 504. Washington, DC: Island Press.
Krishnan R, Harris JM, and Goodwin N (eds.) (1995)A Survey of Ecological Economics. Washington, DC: Island Press.
Martinez-Alier J (1987)Ecological Economics: Energy, Environment, and Society, 287pp. Oxford: Blackwell.
Norton B, Costanza R, and Bishop R (1998) The evolution of preferences: Why ‘sovereign’ preferences may not lead to sustainable policies and what to do about it.Ecological Economics 24: 193–211.
Ecological Economics 2
R Costanza, University of Vermont, Burlington, VT, USA
Published by Elsevier B.V.
Introduction Further Reading
Introduction
Stories about the economy typically focus on gross domestic product (GDP), jobs, stock prices, interest rates, retail sales, consumer confidence, housing starts, taxes, and assorted other indicators. We hear things like ‘‘GDP grew at a 3% rate in the fourth quarter, indicating a recovering, healthy economy, but with room for further improvement.’’ Or, ‘‘The Fed raised short-term interest rates again to head off inflation’’.
But do these reports, and the indicators they cite, really tell us how the economy is doing? What is the economy anyway? And what is this economy for?
Conventional reports on these questions are rather narrow. The ‘economy’ we usually hear about refers
But is this what the economy is all about? Or more accurately, is this ‘all’ that the economy is about? Or, is this what the economy ‘should be’ about? The answer to all of these is an emphatic ‘no’. Here’s why.
Let’s start with purpose. The purpose of the economy ‘should be’ to provide for the sustainable well-being of people. That goal encompasses material well-being cer-tainly – but also anything else that affects well-being and its sustainability. This seems obvious and noncontrover-sial. The problem comes in determining what things actually affect well-being and in what ways.
There is substantial new research on this ‘science of happiness’ that shows the limits of conventional economic income and consumption in contributing to well-being. Psychologist Tim Kasser in his 2003 bookThe High Price of Materalism points out, for instance, that people who focus on material consumption as a path to happiness are actually less happy and even suffer higher rates of both physical and mental illnesses than those who do not. Material consumption beyond real need is a form of psychological ‘junk food’ that only satisfies for the moment and ultimately leads to depression, Kasser says.
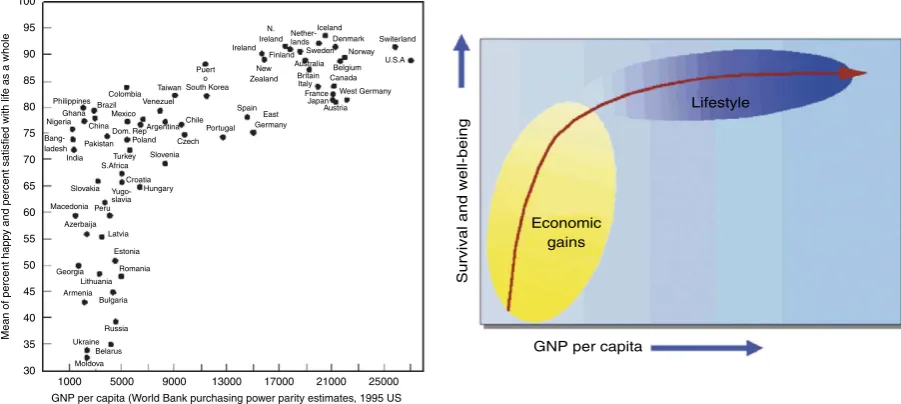
Economist Richard Easterlin, a noted researcher on the determinants of happiness, has shown that well-being tends to correlate well with health, level of educa-tion, and marital status, and with income only up to a fairly low threshold (Figure 1). He concludes in a recent paper in the Proceedings of the National Academy of Sciences
that,
People make decisions assuming that more income, com-fort, and positional goods will make them happier, failing to recognize that hedonic adaptation and social compar-ison will come into play, raise their aspirations to about
the same extent as their actual gains, and leave them feeling no happier than before. As a result, most indivi-duals spend a disproportionate amount of their lives working to make money, and sacrifice family life and health, domains in which aspirations remain fairly con-stant as actual circumstances change, and where the attainment of one’s goals has a more lasting impact on happiness. Hence, a reallocation of time in favor of family life and health would, on average, increase individual happiness.
British economist Richard Layard’s 2005 bookHappiness: Lessons from a New Scienceechos many of these ideas and concludes that current economic policies are not improv-ing happiness and that ‘‘happiness should become the goal of policy, and the progress of national happiness should be measured and analyzed as closely as the growth of GNP.’’ Several countries are now interested in alternative mea-sures of progress. For example, the country of Bhutan has recently announced that it will make ‘gross national hap-piness’ its explicit policy goal.
Economist Robert Frank, in his 2000 bookLuxury Fever, also concludes that the nation would be better off – overall national well-being would be higher, that is – if we actually consumed less and spent more time with family and friends, working for our communities, maintaining our physical and mental health, and enjoying nature.
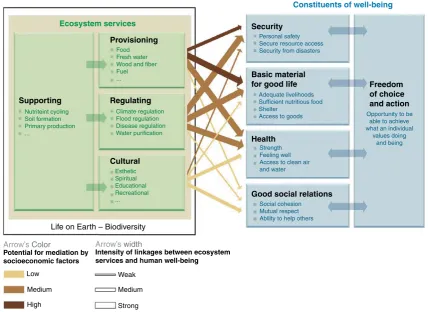
On this last point, there is substantial and growing evidence that natural systems contribute heavily to human well-being (Figure 2). In a paper published in 1997 in the journalNature, the author with his co-workers estimated that the annual, nonmarket value of the Earth’s ecosystem services is $33 trillion globally, substantially larger than global GDP. The just released UN
1000 30
Mean of percent happ
y and percent satisfied with lif
e as a whole
35 40 45 50 55 60 65 70 75 80 85 90 95 100 5000
GNP per capita (World Bank purchasing power parity estimates, 1995 US 9000 13000 17000 21000 25000
GNP per capita Economic
gains
Lifestyle
Survival and well-being
Russia Bulgaria Armenia Lithuania Georgia Estonia Latvia Azerbaija Macedonia Peru Slovakia India Bang-ladesh Nigeria Philippines Ghana Brazil China Pakistan Poland Turkey S.Africa Croatia Hungary Slovenia Czech Portugal Spain East Germany Chile Argentina Mexico Dom. Rep Colombia Venezuel Taiwan New Zealand Ireland N. Ireland Finland Sweden Australia Britain Italy France Japan Austria Canada West Germany Belgium U.S.A Switerland Nether-lands Iceland Denmark Norway Puert o Yugo-slavia Romania Ukraine Moldova Belarus South Korea
Millennium Ecosystem Assessment is a global update and compendium of ecosystem services and their contribu-tions to human well-being.
So, if we want to assess the ‘real’ economy – all the things which contribute to real, sustainable, human wel-fare and quality of life – as opposed to only the ‘market’ economy, we have to measure the nonmarketed contribu-tions to human well-being from nature, from family, friends, and other social relationships at many scales, and from health and education. One convenient way to summarize these contributions is to group them into four basic types of capital that are necessary to support the real, human-welfare-producing economy: built capital, human capital, social capital, and natural capital (Figure 3).
The market economy covers mainly built capital (fac-tories, offices, and other built infrastructure and their products) and part of human capital (spending on labor), with some limited spillover into the other two types. Human capital includes the health, knowledge, and all the other attributes of individual humans that allow them to function in a complex society. Social capital includes all the formal and informal networks among people: family, friends, and neighbors, as well as social institutions at all levels, like churches, social clubs, local, state, and
national governments, NGOs, international organiza-tions, and the institutions of the market itself. Natural capital includes the world’s ecosystems and all the ser-vices they provide that support human well-being. Ecosystem services occur at many scales, from climate regulation at the global scale, to flood protection, soil formation, nutrient cycling, recreation, and esthetic ser-vices at the local and regional scales.
So, how have the world’s real economies been doing recently, compared to their market economies? The short answer is, not so good. How do we know? One way is through surveys of people’s life satisfaction, which in the US has been decreasing slightly since about 1975. A second approach is an aggregate measure of the real economy that has been developed as an alternative to GDP called the genuine progress indicator, or GPI.
Let’s first take a quick look at the problems with GDP as a measure of true human well-being. GDP is not only limited – measuring only marketed economic activity or gross income – it also counts all of this activity as positive. It does not separate desirable, well-being-enhancing activity from undesirable well-being-reducing activity. For example, an oil spill increases GDP because someone has to clean it up, but it obviously detracts from society’s well-being. From the perspective of GDP, more crime,
Opportunity to be able to achieve what an individual
values doing and being Adequate livelihoods
Sufficient nutritious food Shelter
Access to goods Personal safety Secure resource access Security from disasters
Strength Feeling well Access to clean air and water
Social cohesion Mutual respect Ability to help others
Climate regulation Flood regulation Disease regulation Water purification
Esthetic Spiritual Educational Recreational ...
Food Fresh water Wood and fiber Fuel ...
Nutriteint cycling Soil formation Primary production ...
Good social relations Health
Cultural Regulating Supporting
Provisioning
Life on Earth – Biodiversity
Potential for mediation by socioeconomic factors
Intensity of linkages between ecosystem services and human well-being
Weak Low
Medium
High
Medium
Strong Arrow’s Color Arrow’s width
Basic material
for good life Freedom
of choice and action Security
Constituents of well-being
Ecosystem services
more sickness, more war, more pollution, more fires, storms, and pestilence are all potentially good things, because they can increase marketed activity in the economy.
GDP also leaves out many things that do enhance well-being but are outside the market. For example, the unpaid work of parents caring for their own children at home does not show up, but if these same parents decide to work outside the home to pay for child care, GDP suddenly increases. The nonmarketed work of natural capital in providing clean air and water, food, natural resources, and other ecosystem services does not ade-quately show up in GDP, either, but if those services are damaged and we have to pay to fix or replace them, then GDP suddenly increases. Finally, GDP takes no account of the distribution of income among individuals. But it is well-known that an additional $1 worth of income pro-duces more well-being if one is poor rather than rich. It is also clear that a highly skewed income distribution has negative effects on a society’s social capital.
The GPI addresses these problems by separating the positive from the negative components of marketed eco-nomic activity, adding in estimates of the value of nonmarketed goods and services provided by natural, human, and social capital, and adjusting for income-distribution effects (Figure 4 lists the compo-nents of the GPI). While it is by no means a perfect representation of the real well-being of a nation, GPI is a much better approximation than GDP. As Amartya Sen and others have noted, it is much better to be approxi-mately right in these measures than precisely wrong.
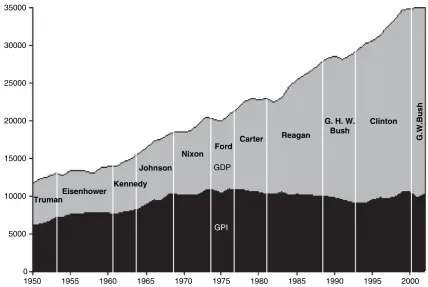
Comparing GDP and GPI for several countries shows that in many ‘developed’ countries the benefits of growth in the market economy are now being outweighed by the uncounted costs of that growth. For example, Figure 5 shows that in the US while GDP has steadily increased since 1950, with the occasional dip or recession, GPI peaked in about 1975 and has been gradually decreasing ever since. From the perspective of the real economy, as opposed to just the market economy, the US has been in recession since 1975. As already mentioned, this picture is also consistent with survey-based research on people’s stated life-satisfaction. We are now in a period of what Herman Daly has called ‘un-economic growth’, where further growth in marketed economic activity (GDP) is actually reducing well-being on balance rather than enhancing it. In terms of the four capitals, while built capital has grown, human, social, and natural capital have declined or remained constant and more than can-celed out the gains in built capital.
While US GPI was beginning to trend upward again at the end of the Clinton years, the policies of the Bush administration have led to a significant worsening of income distribution (thereby further decreasing social capital), an increasing depletion of natural capital, and worsening human capital through decreased spending on education and health, and loss of jobs. And the built capital component (GDP) has not been growing fast enough to outweigh these negatives. While the dollar incomes of some wealthy individuals may have improved over this period, the overall well-being of the US has significantly declined. Further, the psychological
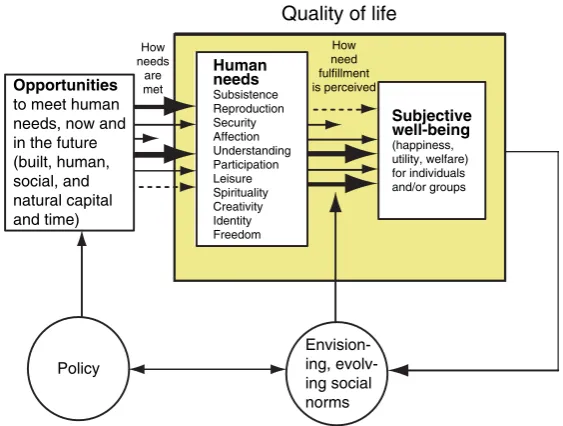
Opportunities
to meet human needs, now and in the future (built, human, social, and natural capital and time)
Human needs Subsistence Reproduction Security Affection Understanding Participation Leisure Spirituality Creativity Identity Freedom How
needs are met
Quality of life
How need fulfillment is perceived
Subjective well-being (happiness, utility, welfare) for individuals and/or groups
Envision-ing, evolv-ing social norms Policy
Figure 3 Quality of life as the interaction of human needs and the subjective perception of their fulfillment, as mediated by the
evidence is that even the well-being (as opposed to income) of the wealthy individuals has probably not improved very much and may even have declined. From the perspective of the real economy, things are not improving.
Is the news all bad? No. We recently estimated the GPI of the State of Vermont and of Burlington, the state’s largest city, and found that Vermont’s and Burlington’s GPI per capita had increased over the entire 1950–2000 period and is now more than double the national average.
Column A: Personal consumption expenditures
Additions
Subtractions
Column F: Services of household capital Column G: Services highways and street
Built capital Human capital Social capital Natural capital
Column H: Cost of crime
Column I: Cost of family breakdown
Column K: Cost of underemployment
Column L: Cost of consumer durables
Column J: Loss of leisure time
Column M: Cost of commuting
Column O: Cost of automobile accidents Column N: Cost of house old pollution abatement
Column P: Cost of water pollution Column Q: Cost of air pollution Column R: Cost of noise pollution Column S: Loss of wetlands Column T: Loss of farmland
Column U: Depletion of nonrenewable resources
Column W: Cost of ozone depletion Column X: Loss of forest cover
Column Y: Net capital investment
Column Z: Net foreign lending and borrowing
Column V: Long-term environmental damage
Column B: Income distribution
Column C: Personal consumption adjusted for income inequaltiy
Column D: Value of household labor Column E: Value of volunteer work
Figure 4 The genuine progress indicator (GPI) by column.
Truman
Eisenhower Kennedy
Johnson
Reagan
G. H. W. Bush
Nixon Ford
Carter
Clinton
G.W.B
u
s
h
1950 0 5000 10000 15000 20000 25000 30000 35000
1955 1960 1965 1970 1975
GPI
GDP
1980 1985 1990 1995 2000
This was due to Vermont’s attention to protecting and enhancing natural, human, and social capital in balance with gains in built capital – accomplished through the application of strong, local democratic principles, and processes still actively at work in Vermont.
The lesson from Vermont, and from similar analyses done at the regional level in other locales, is that there is significant variation within and across countries in trends in well-being and quality of life, and plenty of good examples we can learn from to improve overall well-being at multiple scales.
How can we apply these lessons to get out of the real recession in human well-being at the national scale that many countries are now in? Several policies have been suggested that would help to turn things around:
•
Shifting our primary national policy goal fromincreasing marketed economic activity (GDP) to maximizing national well-being (GPI or something similar). This would allow us to see the interconnec-tions between built, human, social, and natural capital and build well-being in a balanced and sustainable way.
•
Reforming tax systems to send the right incentives by taxing negatives (pollution, depletion of natural capi-tal, overconsumption) rather than positives (labor, savings, investment).•
Reforming international trade to promote well-being over mere GDP growth. This implies protecting natural capital, labor rights, and democratic self-determination first and then allowing trade, rather than promoting the current trade rules that ignore all nonmarket contributions to well-being.•
Implementing strong democracy, as Tom Prugh, Robert Costanza, and Herman Daly have argued in the book The Local Politics of Global Sustainability. Strong democracy implies true participation of all in governance and is an essential prerequisite to building a sustainable and desirable future.•
Increasing the size of the ‘common sector’ of the econ-omy (as opposed to the private and public sectors) but creating common property asset trusts to ‘propertize’ natural and social capital assets, as described in Peter Barnes’ bookCapitalism 3.0.Ultimately, getting out of the recession in well-being we are currently in will require us to look beyond the limited
definition of the ‘economy’ we read about in the news-papers, and recognize what the real economy is and what it is for. We must not allow deceptive accounting prac-tices – analogous to those that caused the Enron and WorldCom debacles – to paint an inaccurate and ulti-mately destructive picture of how ‘well’ we are doing. Alternatives are available, but they need significant further discussion and research.
With nothing less than our current and future well-being at stake, we can certainly afford to devote greater effort to learning how to adequately understand and measure it. If we want things that really matter to our well-being to count, we must learn how to recognize and count them, use that information to inform policy in a real democracy, and create adaptive institutions that can effectively implement the policy.
See also:Ecological Health Indicators.
Further Reading
Barnes P (2006)capitalism 3.0: A Guide to Reclaiming the Commons. San Francisco, CA: Berrett-Koehler.
Costanza R, d’Arge R, de Groot R,et al.(1997) The value of the world’s ecosystem services and natural capital.Nature387: 253–260. Costanza RJ, Erickson K, Fligger A,et al.(2004) Estimates of the
Genuine Progress Indicator (GPI) for Vermont, Chittenden County, and Burlington, from 1950 to 2000.Ecological Economics 51: 139–155.
Costanza RJ, Fisher S, Ali C,et al.(2006) Quality of life: An approach integrating opportunities, human needs, and subjective well-being. Ecological Economics61: 267–276.
Daly HE and Farley J (2003)Ecological Economics: Principles and Applications. Washington, DC: Island Press.
Easterlin RA (2003) Explaining happiness.Proceedings of the National Academy of Sciences of the United States of America
100(19): 11176–11183.
Frank R (1999)Luxury fever: Why money fails to satisfy in an era of excess. Mankato, MN: The Free Press.
Kahneman D, Diener E, and Schwarz N (eds.) (1999)Well-Being: The Foundations of Hedonic Psychology. New York: Russell Sage Foundation.
Kasser T (2003)The High Price of Materalism. Cambridge, MA: MIT Press.
Layard R (2005)Happiness: Lessons from a New Science. New York: Penguin.
Prugh T, Costanza R, and Daly H (2000)The Local Politics of Global Sustainability, 173pp. Washington, DC: Island Press.