R E S E A R C H
Open Access
Effects of a single 20 mg dose of letrozole
on ovarian function post dominant follicle
selection: an exploratory randomized
controlled trial
H.C.M. Allaway
1,3, D.R. Chizen
1, G.P. Adams
2and R.A. Pierson
1*Abstract
Background:Our objective was to explore the impact of a single dose of an aromatase inhibitor (letrozole) administered at defined times of the follicular phase or immediately after ovulation on dominant follicle development, luteogenesis and new follicle wave emergence.
Methods:A prospective pilot study using a randomized complete block, controlled, open label design was conducted at an academic clinical research center. Forty-five healthy, female volunteers (25.5 ± 0.9 years, BMI 25.0 ± 0.6 kg/m2) who had not taken hormonal contraceptives for a minimum of 2 months were recruited. A 20 mg dose of Letrozole was administered once orally in each of 3 groups when the dominant follicle reached a diameter of 1) 12 mm, 2) 18 mm, 3) the first day following ovulation (post-ovulation), or 4) treatment was withheld (control). Serial ultrasonography and phlebotomy began on day 4 of the menstrual cycle and continued for 1.5 menstrual cycles. Participants recorded menses and daily events in a life events calendar for the duration of the study. Demographic and single point measurements were compared among groups by ANOVA. Changes in hormone concentrations over time were compared among groups by repeated measures ANOVA. Kruskal-Wallis tests were used for non-normally distributed data.
Results:The dominant follicle in all treatment groups ovulated. There were no differences among experimental groups in peak follicle diameter, follicular growth rate, endometrial thickness at ovulation or inter-ovulatory interval. Plasma concentrations of estradiol dropped, while FSH and LH concentrations rose following treatment in all treatment groups. Plasma FSH and LH concentrations were higher in the 18 mm group compared to the 12 mm and post-ovulation groups (P< 0.02).
Conclusion:Administration of a single 20 mg dose of Letrozole at the times of the menstrual cycle we examined did not induce dominant follicle regression or failure of corpus luteum formation. Letrozole-induced suppression of estradiol synthesis by the dominant follicle was not detrimental to follicle growth or ovulation following follicle selection, likely due to increased circulating concentrations of FSH and LH resulting from a lack of estradiol-induced suppression of the hypothalamic-pituitary-ovarian axis.
Trials registration number:Clinical trials registration number NCT01046578.
Keywords:Aromatase inhibitor, Follicular phase, Ovulation, Estradiol, Endometrium
* Correspondence:[email protected]
1Department of Obstetrics, Gynecology & Reproductive Sciences, College of Medicine, University of Saskatchewan, 103 Hospital Drive, Saskatoon, SK S7N 0 W8, Canada
Full list of author information is available at the end of the article
Background
The traditional model of folliculogenesis during the hu-man menstrual cycle posits that a single cohort of antral follicles in the ovary begins to grow at the beginning of the menstrual cycle and a dominant follicle is physiolo-gically selected in the mid-follicular phase: ovulation of the dominant follicle occurs approximately 2 weeks fol-lowing the onset of menses [1]. However, a more current model has evolved through the use of serial transvaginal ultrasonography which enabled detailed characterization of follicular and luteal dynamics through the identifica-tion of definitive ovarian points of reference; i.e., the oc-currence of ovulation and the emergence of follicular waves [2–4]. Menses occurs in the middle of the inter-ovulatory interval and the final of 2 or 3 waves of follicle development culminates in ovulation. Descriptions of antral follicle waves in women are consistent with fol-licular wave dynamics observed during the estrus cycles of several domestic animal species [5–8].
Data from Canada and the United States emphasize the need for a better understanding of the regulation of ovarian function [9–15], as the use of emergency and cyclic hormonal contraception increases. In 2006, ap-proximately 450,000 pregnancies were documented in Canada and 20% ended in elective termination [10, 11]. Similarly, 51% of the 6.7 million documented pregnan-cies in the United States in 2008 were unintended [13, 14], with 40% of unintended pregnancies ending in elective termination (20% of all pregnancies) [14]. The Centers for Disease Control reported 11% of 15–44 year olds and 23% of 20–24 year olds had ever used an emergency contraceptive [12]. The reasons for use were fear of contraceptive failure (45%) and unprotected sex (49%) [12]. Croxatto et al. [16, 17] have demonstrated the occurrence of ovulation following emergency contraception administration varied depending on the size of the follicle at administration. The closer the follicle size was to preovulatory, the less likely treat-ment with a full or half dose of emergency contracep-tion was going to prevent ovulacontracep-tion [16, 17]. Thus, the mechanism of action for combined hormonal contra-ception use as an emergency contraceptive is not well understood and investigations into the removal of endogenous estrogen would provide a unique oppor-tunity to evaluate mechanisms of steroidogenesis im-pact on folliculogenesis.
The non-steroidal aromatase inhibitor (AI) Letrozole (FemaraTM
) reversibly inactivates the aromatase enzyme [18–20] and prevents the enzymatic conversion of androgens to estrogens [19, 21]. Letrozole is the most commonly used AI for ovulation induction and has been used successfully when administered between days 3 and 7 of the follicular phase as small 5-day dose (2.5 or 5.0 mg/day) and large single dose (20 mg) regimens [18,
19, 22–24]. To date, there are no reports of AI use initi-ated at other points of follicle growth in humans.
The decline in FSH coupled with the rise in estradiol (E2) early in the follicular phase is well documented; however, the response of post-deviation follicles to de-creasing E2and increasing FSH is not well documented [25, 26]. In the bovine model of ovarian function, neither a single nor 3 day AI dosing protocol was able to induce regression of a dominant follicle nor cause an increase FSH release [27, 28]. Yapura et al. [27, 28] observed a lengthened follicular dominance and increased secretion of luteinizing hormone (LH) with a single and 3 day AI dosing protocol. Single and multi-day dosing in humans and animal models demonstrated similar results, therefore the use of the single day protocol should be viewed as most appropriate [22–24, 27, 28]. A better understanding of the role of estrogen in controlling folliculogenesis, and the effects of aromatase inhibitors on post-deviation ovar-ian function may lead to the development of better proto-cols for both fertility and contraception. Thus, the overall objectives of the present study were to evaluate mechanis-tically the ovarian and endocrine effects of Letrozole treat-ment when administered at the time of dominant follicle selection, the immediate pre-ovulatory period and imme-diate post-ovulatory period during natural menstrual cycles.
Methods
A prospective pilot study was conducted using a con-trolled, randomized complete block, open label design at a single center.
Participants
Forty-five women between the ages of 18 and 35 years (25.5 years ± 0.9; mean ± SD) with a body mass index (BMI) of 18–32 (25.0 ± 0.6) were enrolled and 41 women completed the study. Informed consent was obtained from all women prior to the initiation of study proce-dures. All participants were self-reported non-smoking, healthy women with regular menstrual cycles with no contraindication to contraceptive or aromatase inhibitor use (as determined by medical history and physical examination). The women were naïve to the use of hor-monal contraceptive or were required to discontinue use of hormonal contraceptives≥2 months before the study. Participants were asked to abstain from intercourse during the study; however, participants were also provided with barrier contraceptives (condoms) throughout the study to prevent pregnancy if they were requested.
Treatments
generator by HCMA. Women in the respective groups were given a single 20 mg oral dose of letrozole (Femara, Novartis Pharmaceuticals Canada, Inc., Dorval, Quebec) when the largest ovarian follicle after menses was first detected at a diameter of 1) 12 mm (n= 10; peri-selection group), 2) 18 mm (n= 10; pre-ovulatory group), or 3) within 24 h after ovulation (n= 10; post-ovulation group), or 4) were given no treatment (n= 11; control group).
Ultrasonography
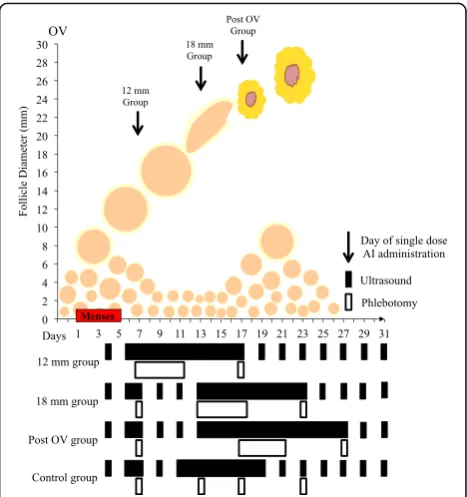
Ovarian follicular and endometrial development were evaluated by transvaginal ultrasonography using a 6– 9 MHz convex-array transducer (Ultrasonix RP, Vancou-ver, BC, Canada). Most examinations (95%) were per-formed by one operator (HCMA); the remaining examinations were performed by co-authors. Partici-pants were monitored for 1.5 menstrual cycles (i.e., from the first menses of the observational period to the first ovulation after the second menses). Beginning on day 4 (day 1 = first day of menses), ultrasonographic examina-tions were performed every-other-day until the day of letrozole treatment in the peri-selection (12 mm) group or until the dominant follicle was≥16 mm in diameter in all other experimental groups when ultrasound exam-inations were done daily thereafter for a minimum of 11 days or until the fate of the dominant follicle was de-termined (i.e., regression, formation of an anovulatory follicular cyst, hemorrhagic anovulatory follicle (HAF), luteinized unruptured follicle (LUF) or ovulation (OV)). Following ovulation, women in the control group were then examined every-other-day until the post-treatment ovulatory follicle attained a 16 mm diameter. Daily ex-aminations then resumed until the subsequent ovulation. In all treatment groups, subsequent ultrasound examina-tions were conducted every-other-day from the time that the dominant follicle’s fate was determined until the post-treatment ovulatory follicle was≥16 mm in diam-eter; daily examinations then resumed until the subse-quent ovulation. A schematic representation of the study protocol is shown in Fig. 1.
The number and diameter of antral ovarian follicles≥ 2 mm were imaged and tabulated during each ultra-sound examination to assess the day of wave emergence. The average of two orthogonal measurements was used as the mean follicle diameter for all follicles > 10 mm. The dominant follicle was defined as the follicle≥ 10 mm that surpassed the diameter of all other follicles in the cohort by≥2 mm in diameter [2, 3]. Subordinate follicles were defined as all other follicles in the cohort with the dominant follicle and the 1st
subordinate follicle was the largest of the subordinate follicles. Co-dominant follicles were defined as two follicles reaching > 13 mm [29]. Ovulation was defined as the disappearance of a
follicle≥12 mm in diameter detected ultrasonographically the previous day, followed by subsequent visualization of a corpus luteum [30]. Wave emergence was defined retro-spectively as the day when the largest follicle of each wave was first identified at 4–5 mm. The identity and non-identity methods were used to characterize changes in fol-licle diameter during the study [2, 7, 31]. The diameter profiles of individual follicles that grew≥8 mm over time for each woman were tabulated using the day of follicular wave emergence as the point of reference [2].
Endometrial thickness and pattern also were recorded during each ultrasound examination following standard operating procedures of the WHIRL, as previously described [32]. Briefly, endometrial thickness was mea-sured as the distance from the anterior stratum myometrial junction to the posterior stratum basalis-myometrial junction in the mid-sagittal plane. The transverse and sagittal planes of section which repre-sented the largest dimensions of the fundal aspect of the endometrium were used for all measurements. Endomet-rial echotexture pattern was assessed each day as either an M, A, B, C or D pattern.
Blood sampling
In the treatment groups blood samples were taken daily for 5 days beginning on the day of treatment. The inter-val was defined as the observation interinter-val. If the fate of the extant dominant follicle was not determined after 5 days, blood samples were taken every-other-day until the dominant follicle met one of the defined fates. In all
participants a single blood sample was taken 5–9 days after the fate of the follicle was known. A final blood sample was taken when the pre-ovulatory follicle of the second cycle reached 18 mm. In the control group, blood samples were taken at times equivalent to the day of treatment in the other groups (i.e., 12 mm follicle, 18 mm follicle, and 24 h post-ovulation), 5–9 days fol-lowing ovulation and when the pre-ovulatory follicle reached 18 mm. Blood samples were collected in 7 mL tubes and allowed to coagulate for 30–45 min at room temperature before centrifugation for 30 min at 700 × g. Serum samples were stored at −20 °C until all partici-pants completed the study.
Daily events charts
All volunteers were provided with an event diary to record menstrual patterns, concomitant medications and any adverse events that occurred during the study.
Hormone assays
Competitive fluorescence immunoassays (ImmuliteTM, Siemens Healthcare Diagnostics Inc., Tarrytown, NY, USA) were used to measure serum FSH and LH concen-trations and validated radioimmunoassays were used to measure serum E2and progesterone (P4) concentrations. All assays were performed in a single batch and con-ducted at Prairie Diagnostic Services at the University of Saskatchewan. Minimum detectible limits were: FSH: 0.1 mIU/mL; LH: 0.1 mIU/mL; E2: 1.4 pg/mL; and P4: 0.02 ng/mL. Intra-assay coefficients of variation for low, medium and high reference concentrations, respectively, were 3.0, 2.9 and 1.6% for FSH, 2.6, 2.4 and 1.6% for LH, and 3.9, 6.3 and 7.6% for P4. Intra-assay coefficients of variation for low and high reference concentrations, re-spectively, were 2.4 and 10.9% for E2. Inter-assay coeffi-cients of variation were 4.7 and 13.2% (low, high) for E2 and 3.9, 6.3 and 7.6 (low, medium, high) for P4. The magnitude of the decrease in plasma estradiol concen-tration following treatment was calculated using the equation ([E2day of treatment] –[E2day of nadir])/(day of nadir–day 1).
Statistical analyses
Sample size was determined by the mechanistic and pilot study nature of the trial. All analyses were based on intent-to-treat. Statistical analyses were performed using SAS version 9.2 (SAS Institute, Cary, NC, USA). Single-point measurements were compared among groups by analysis of variance. Changes in hormone concentrations (E2, FSH and LH) and endometrial thickness over time were compared among groups by analysis of variance for repeated measures (PROC MIXED). Endometrial pat-terns and intervals from treatment to ovulation were
compared using Kruskal-Wallis tests. Significance was set atP< 0.05. Results are expressed as the mean ± SEM.
Results
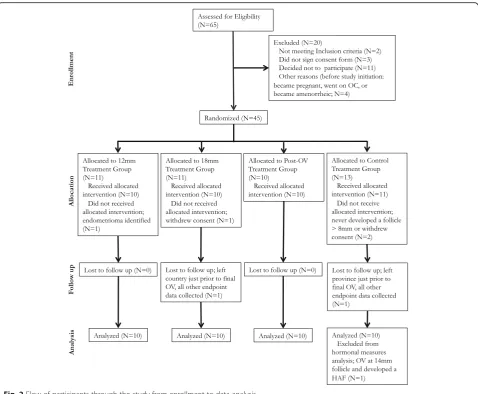
The flow of participants through the study protocol is shown (Fig. 2). Participants who had aberrations in luteal follicle wave dynamics were followed ultrasonographi-cally over a longer time and had extra days of blood sampling (data not shown). The age and BMI of partici-pants were similar among treatment groups (Table 1; P > 0.4). No adverse events were observed in our sub-jects. Forty-one participants completed the pilot study. Four participants were excluded or withdrew from the study prior to receiving treatment and were not included in the analyses. One participant in the 18 mm group and one in the control group were lost to follow-up just prior to ovulation at the end of the study and is included in all analyses. One participant in the control group ovu-lated at a small follicle diameter (>14 mm), which was not observed by ultrasound within 24 h, thus this par-ticipant was excluded from analyses of hormone data.
Follicular and luteal dynamics
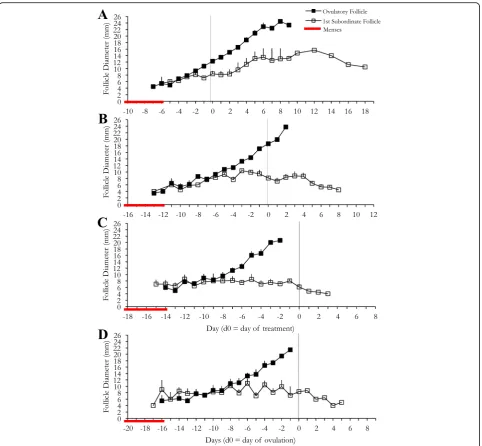
The mean diameter profiles of the dominant and first subordinate follicles of the ovulatory wave for each treat-ment group are shown (Fig. 3). The dominant follicles extant at the time of treatment in all study groups ovu-lated. Ovulation was confirmed by ultrasonographic ob-servation of a corpus luteum and a subsequent rise in P4 on days 5–9 [33]. In the 12 mm group, 3 of 10 (30%) women developed co-dominant follicles: one follicle ovulated and the other regressed in one woman and both follicles ovulated in 2 women. One of the 10 (10%) women in the 18 mm group developed co-dominant follicles; one follicle ovulated and the other regressed. In the control group, one of the 11 women (9%) developed co-dominant follicles; one follicle ovulated at 13 mm and the other developed into a HAF. Data from this participant were excluded from hormonal analysis.
The interval from treatment to ovulation differed among groups (P< 0.0001; Table 2). Peak follicle diam-eter was greater in the 12 mm group than that of the 18 mm and control groups (P< 0.04). The interval from treatment to ovulation was longest in the 12 mm group and shortest in the 18 mm group. There were no differ-ences among study groups in the rate of growth of the dominant follicle from treatment to ovulation, or to peak follicle diameter before follicle rupture was observed in the post-ovulation group. (P > 0.1; Table 2).
intervals from ovulation to new follicular wave emer-gence (0.4 ± 4.5 d, −0.2 ± 2.5 d, 0.5 ± 3.0 d, 0.8 ± 3.2 d, respectively; P= 0.925).
Day 5–9 serum P4 concentrations were 22.9 ± 5.5 ng/ mL, 16.3 ± 1.8 ng/mL, 13.0 ± 1.4 ng/mL and 24.1 ± 5.7 ng/ mL in the 12 mm, 18 mm, post-ovulation and control groups, respectively (P= 0.1899) and were above the clin-ically defined minimum P4concentration required to con-firm ovulation. No differences were observed among
groups with regard to P4concentrations, inter-menstrual interval and inter-ovulatory interval.
Circulating hormone concentrations
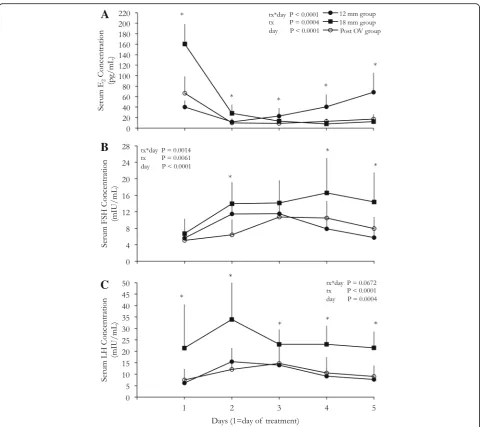
Changes in serum concentrations of E2, FSH and LH in the treatment groups are shown (Fig. 4). The pattern of change in serum E2concentration across the observation interval differed among the 3 treatment groups (P< 0.0001; Fig. 4a). The 18 mm group exhibited higher (P< 0.0001) E2 concen-trations on the day of treatment, which was attributed to the presence of a pre-ovulatory dominant follicle. Following treatment E2 concentrations decreased in all treatment groups (P= 0.0004). The 18 mm group E2concentrations reached baseline on the third day after treatment and remained at baseline until the 5th day (P= 0.8563). The 12 mm group E2concentrations increased (P= 0.01) from 2 to day 5. The magnitude of the initial drop in E2 concentra-tion in the 18 mm group was larger than in both the 12 mm and post ovulation groups (P= 0.04).
Fig. 2Flow of participants through the study from enrollment to data analysis
Table 1Descriptive Statistics for age and BMI (mean ± SEM) of participants
Experimental Group N Age (years) BMI (kg/m2)
12 mm 10 24.8 ± 1.9 25.4 ± 0.8
18 mm 10 28.0 ± 1.6 24.5 ± 1.1
Post OV 10 24.0 ± 1.6 24.8 ± 1.4
Control 11 25.2 ± 1.8 25.4 ± 1.1
Fig. 3Mean follicle diameter profiles of the treatment groups. The 12 mm group (n= 10;a), 18 mm group (n= 10;b), post-OV group (n= 10;c), and control group (n= 11;d) are shown separately. Data are shown for 9 days following ovulation and are centralized to the day of treatment for each respective treatment group or day of OV in the control group
Table 2Mean follicular end points (mean ± SEM) among experimental groups
Experimental Group N Day of treatment (d) Peak diameter (mm) Follicular growth rate (mm/d)
Interval from treatment to OV (d)
12 mm 10 9.2 ± 0.4 23.2 ± 1.0 1.5 ± 0.1 7.4 ± 0.6
18 mm 10 14.5 ± 1.1a 19.8 ± 0.6 1.3 ± 0.1 1.9 ± 0.2a
Post OV 10 17.9 ± 0.8a, b 20.7 ± 1.3 1.5 ± 0.1 −1.0 ± 0.0a, b
Control 11 NA 19.8 ± 1.4 1.2 ± 0.1 NA
P-value 0.0001 0.1266 0.1809 0.0001
All comparisons are within columns a
difference from 12 mm group (P< 0.05) b
Plasma FSH concentrations increased and subsequently decreased to pretreatment concentrations over the 5-day observation interval in all treatment groups (P= 0.0014; Fig. 4b). The statistical interaction was attributed to the immediate FSH increase from day 1 to 2 in the 12 and 18 mm groups (P< 0.0001).
Following treatment, plasma LH concentrations in all treatment groups initially increased (P= 0.0013; Fig. 4c) and then decreased to pretreatment levels by the end of the observation interval. The mean plasma LH concen-trations over the observation interval were higher in the 18 mm group versus the 12 mm and post ovulation groups (P< 0.02).
The maximum concentrations of FSH and LH following treatment differed among treatment groups (P< 0.03). The 18 mm group had higher FSH and LH concentrations than the 12 mm and post ovulation groups (P< 0.05); maximum FSH and LH concentrations did not differ between the 12 mm and post ovulation groups (P > 0.26).
Endometrial dynamics
the interval from menses to ovulation, inter-ovulatory interval or inter-menstrual interval among experimental groups (P= 0.2; Table 3).
Discussion
The dominant follicle observed in all treatment groups ovulated and there were no differences among experi-mental groups for peak follicle diameter, follicular growth rate, nor endometrial thickness at ovulation. As expected E2concentration declined, while both FSH and LH concentrations increased following administration of a single 20 mg dose of AI in all treatment groups. Differ-ences among groups in P4concentrations, inter-menstrual interval and inter-ovulatory interval were not observed, therefore, we concluded that there was no effect of treatment on luteogenesis.
Concentrations of serum E2, FSH and LH on the day before receiving treatment in each group did not exceed previously published ranges for the specified physiologic time points in our laboratory [3] nor did they differ from the control group at the same time point. Decreased E2 was observed within 24 h of AI administration in all women, supporting our hypotheses that treatment with
an AI would cause a transient drop in E2. These findings contrast studies in the bovine model, where increasing plasma E2 concentrations were observed for 4 days fol-lowing AI administration in metestrous. The E2increase was associated with a simultaneous increase in follicle diameter [28], which is similar to the continued follicle development in all our treatment groups despite the drop in E2concentrations. In the 12 mm group an in-crease in E2concentrations began 2 days after AI admin-istration and was attributed to the health and continued growth of the pre-ovulatory dominant follicle, while the absence of a rise in E2in the 18 mm and post-ovulation groups has been attributed to the physiologic drop in E2 secretion following ovulation [3]. A compensatory mechanism for the preservation of follicle growth and ovulation following the acute drop in E2after AI admistration may be explained by the observation of in-creases in FSH and LH concentrations.
All treatment groups exhibited a rise in FSH following treatment in the present study. Garcia-Velasco et al. [34] demonstrated a 7 day delay in a rise in FSH when Letro-zole was administered during the luteal phase. Both doc-umented rises in luteal FSH concentrations in women contrast with a lack of FSH change in the bovine model [27, 28]. In the present study, all three groups exhibited a typical mid follicular phase rise in FSH during the 4 days immediately following treatment. A 4-day rise in FSH following aromatase inhibitor treatment later in the follicular phase (day 12 and 18) appeared to elongate the FSH rise thus potentially allowing multiple dominant follicles to develop.
Circulating LH concentrations reached maximum concentrations within 24 h of treatment and returned to initial concentrations by the end of the observation interval in all groups. The rise in LH concentrations within 24 h is consistent with reports of AI treatment in the bovine model [27, 28]. A sustained elevation in LH following cessation of follicular phase AI administration has not previously been reported in women [18, 20, 22–24]. Bedaiwy et al. [35] documented no difference in LH Fig. 5Mean profiles of endometrial thickness. Women in all
treatment groups, 12 mm (n= 10), 18 mm (n= 10), 24 h post ovulation (n= 10), and control (n= 11) are identified. Data are shown for one inter-menstrual interval and are centralized to the day of ovulation. No significant effect of day was observed for endometrial thickness
Table 3Descriptive statistics for physiologically relevant intervals (mean ± SEM) among experimental groups
Experimental Group N Interval from
menses to OV
Inter-menstrual interval
Inter-ovulatory interval
Interval from treatment to menses
12 mm 10 16.6 ± 0.5 27.6 ± 1.1 29.5 ± 1.6 19.7 ± 1.3
18 mm 10 16.4 ± 1.1 29.6 ± 1.4 26.9 ± 2.0 16.1 ± 0.6a
Post OV 10 16.9 ± 0.8 28.0 ± 1.0 23.9 ± 3.0 11.1 ± 0.9a, b
Control 11 17.2 ± 1.0 28.5 ± 1.1 29.0 ± 1.1 NA
P-value 0.9284 0.6551 0.2014 0.0001
All intervals are in days
N= 9 for 18 mm group andN= 10 for control group in inter-ovulatory interval column a
difference from 12 mm group (P< 0.05) b
concentrations in AI treated cycles compared to natural cycles up to day 11 of the menstrual cycle; however, treat-ment with 2.5 mg AI led to significantly lower LH on the day of hCG administration. It has been suggested that the prolonged elevation in LH following aromatase inhibitor treatment in the follicular and luteal phases indirectly en-hances dominant follicle development [27, 28].
When treatment was administered at a 12 mm follicle diameter the selected follicle continued to grow, and attained a larger pre-ovulatory size compared with the 18 mm treatment group and control group and there was a tendency for the follicle to be larger than observed in the post-ovulation group. However, in the 18 mm group there was no change in follicle diameter at ovula-tion compared to the control group. The trend towards a larger ovulatory follicle in the 12 mm group may be re-lated to the acute drop in E2in the mid-follicular phase. We postulated that the compensatory rise in FSH and LH following an AI induced drop in E2accentuated fol-licular growth. However, within the constraints imposed by our study design, we were unable to conclude that AI treatment affects ovulatory follicle diameter.
Our observation of an unaltered growth profile is in contrast with the bovine model where a single, large dose of letrozole after follicle selection prolonged the interval from treatment to ovulation [27, 28]. To date, there has been no in depth evaluation of the effects of AI use on fol-licle growth profiles when administered prior to dominant follicle selection (i.e., 10 mm diameter). In retrospect, it would have been useful to have include a treatment group in which women received Letrozole on the 3rdday follow-ing menses an prior to follicle selection. Initiation of AI treatment prior to selection has been documented in ovu-lation induction, which appears to release negative feed-back on FSH secretion and stimulate further growth of the extant follicular wave; however, available studies did not measure changes in FSH during treatment [19, 20, 22, 24, 35]. In natural menstrual cycles, the duration of the FSH rise at wave emergence is short and it is presumed that this is due to the negative feedback system of E2 and inhibin B. This mechanism is postulated to ensure mono-vulation [20].
In the present study, multiple dominant follicles were developed by women in the 12 mm, 18 mm and control groups in the follicular phase of the treatment cycle. In the 12 mm group, 20% of the women ovulated two folli-cles during the treatment period, in contrast with the re-ported 4% natural occurrence of double ovulation [26, 29]. Another participant in the 12 mm group developed a sec-ond dominant follicle that regressed. This observation is conceptually similar to a recent study in the bovine model wherein the 1st
subordinate follicle of animals given an AI in the follicular growth phase (day 1–3) exhibited larger mean diameters [27]. It was postulated that an extended
mid follicular phase FSH rise in women allowed a subor-dinate follicle to be rescued from atresia. In both the 18 mm and control groups, a second dominant follicle grew but either regressed (10%) or resulted in ovulatory failure (9%). Ovulatory failure occurs in approximately 5% of cycles of regularly cycling women [36] and 10% of cy-cles in infertile women [37, 38]. An increased incidence of ovulatory failure was not observed in the present study.
We were limited in our ability to evaluate the impact of AI treatment on luteal function. We hypothesized that AI treatment would result in ovulatory failure and hence did not anticipate a need for the evaluation of serial luteal phase P4. We were also limited in our ability to directly as-sess differences between the control group in this pilot study and each of the treatment groups across the entire treatment timeframe. Blood draws in the control group were timed only to coincide with the times of letrozole treatment. An optimal design to facilitate comparison of the control group to the treatment groups during the observation interval would have required volunteers to submit to daily blood collection for approximately 15 con-secutive days. We were already limited by our ability to at-tract volunteers for the study protocol as executed. We were also financially unable to support a separate control group in this study for each treatment group.
Conclusions
Aromatase inhibitor treatment at follicle diameters of 12 mm or 18 mm or 24 h post ovulation were associated with a transient decrease in E2 concentrations and ele-vated circulating FSH and LH concentrations during the 4 days following treatment. The drop in E2concentration did not suppress dominant follicle growth or early corpus luteum development. These results were unexpected and provide an impetus for additional studies to elu-cidate the roles of E2, LH and FSH in the regulation of follicle and luteal development in women. There is no reason to suspect other commercially available aromatase inhibitors (i.e., anastrozole) would have different effect than the observations made with letro-zole on ovarian function.
Abbreviations
AI:Aromatase inhibitors; BMI: Body mass index; E2: Estradiol; FSH: Follicle stimulating hormone; HAF: Hemorrhagic anovulatory follicle; LH: Luteinizing hormone; LUF: Luteinized unruptured follicle; OV: Ovulation;
P4: Progesterone; WHIRL: Women’s Health Imaging Research Laboratory
Acknowledgements
Funding
The project was supported by a Canadian Institutes of Health Research (CIHR) operating grant to RAP. The CIHR had no role in the design of the study, data collection, analysis and interpretation of data, or writing the manuscript.
Availability of data and materials
The datasets analysed during the current study are not publicly available due to pending intellectual property review.
Authors’contributions
HCMA and RAP were responsible for the study design and study approvals process, study execution, data collection, data analysis and interpretation and manuscript writing. DRC was responsible for study execution, data analysis and interpretation and manuscript revision. GPA was responsible for the study design, data analysis and interpretation and manuscript revision. All authors read and approved the final manuscript.
Competing interests
HCMA and DRC have nothing to declare. RAP declares holding Canadian, US and European patents on the use of aromatase inhibitors for emergency contraception. RAP and GPA declare holding US and International patents on Aromatase Inhibitors in Mammalian Reproduction: Compounds, Compositions and Methods.
Consent for publication
No individually identified patient data are included in the manuscript.
Ethics approval and consent to participate
The study protocol, Bio 08–139, was approved by the Biomedical Research Ethics Review Board at the University of Saskatchewan with No Objection approval by Health Canada. All study procedures were conducted at the Women’s Health Imaging Research Laboratory (WHIRL) at the University of Saskatchewan in full compliance with the standard operating procedures of the WHIRL, the Tri-Council Policy Statement on the Ethical Conduct for Research Involving Humans, the Declaration of Helsinki on ethical principles for medical research involving humans, and in compliance with the guidelines of the International Conference on Harmonization on Good Clinical Practice. Each volunteer signed consent to participate after reviewing study procedures and expectations with study staff and consented to have their de-identified data included in all analyses and subsequent publications.
Author details
1
Department of Obstetrics, Gynecology & Reproductive Sciences, College of Medicine, University of Saskatchewan, 103 Hospital Drive, Saskatoon, SK S7N 0 W8, Canada.2Department of Veterinary Biomedical Sciences, Western College of Veterinary Medicine, University of Saskatchewan, Saskatoon, SK, Canada.3Present Address: Department of Kinesiology, Pennsylvania State University, State College, PA, USA.
Received: 22 November 2016 Accepted: 16 January 2017
References
1. Gougeon A. Dynamics of follicular growth in the human: a model from preliminary results. Hum Reprod. 1986;1:81–7.
2. Baerwald AR, Adams GP, Pierson RA. A new model for ovarian follicular development during the human menstrual cycle. Fertil Steril. 2003;80:116–22. 3. Baerwald AR, Adams GP, Pierson RA. Characterization of ovarian follicular
wave dynamics in women. Biol Reprod. 2003;69:1023–31.
4. Baerwald AR, Adams GP, Pierson RA. Ovarian antral folliculogenesis during the human menstrual cycle: a review. Hum Reprod Update. 2012;18:73–91. 5. Adams GP, Baerwald AR. Animal Models for the Study of Human Ovarian
Function. Reprod Fertil Dev. 2012;24:284.
6. Ginther OJ, Kot K, Wiltbank MC. Associations between emergence of follicular waves and fluctuations in FSH concentrations during the estrous cycle in ewes. Theriogenology. 1995;43:689–703.
7. Pierson RA, Ginther OJ. Follicular Population-Dynamics during the Estrous-Cycle of the Mare. Anim Reprod Sci. 1987;14:219–31.
8. Pierson RA, Ginther OJ. Ultrasonic-Imaging of the Ovaries and Uterus in Cattle. Theriogenology. 1988;29:21–37.
9. Black A, Francoeur D, Rowe T, Collins J, Miller D, Brown T, David M, Dunn S, Fisher WA, Fleming N, et al. Canadian contraception consensus. J Obstet Gynaecol Can. 2004;26:347–87. 389–436.
10. Pregnancy Outcomes by Age Group (Total Pregnancies). http://www.statcan. gc.ca/tables-tableaux/sum-som/l01/ind01/l3_2966_2961-eng.htm?hili_none. 11. Induced Abortions in Hospitals and Clinics by Age Group and Area of
Residence of Patient, Canada, Provinces and Territories. http://www.statcan. gc.ca/tables-tableaux/sum-som/l01/cst01/health43-eng.htm.
12. Daniels K, Jones J, Abma J. Use of emergency contraception among women aged 15–44: United States, 2006–2010. NCHS data brief, no 112. Hyattsville: National Center for Health Statistics; 2013.
13. Finer LB, Zolna MR. Unintended pregnancy in the United States: incidence and disparities, 2006. Contraception. 2011;84:478–85.
14. Finer LB, Zolna MR. Shifts in intended and unintended pregnancies in the United States, 2001–2008. Am J Public Health. 2014;104 Suppl 1:S43–48. 15. Henshaw SK. Unintended pregnancy in the United States. Fam Plan
Perspect. 1998;30:24–9. 46.
16. Croxatto HB, Brache V, Pavez M, Cochon L, Forcelledo ML, Alvarez F, Massai R, Faundes A, Salvatierra AM. Pituitary-ovarian function following the standard levonorgestrel emergency contraceptive dose or a single 0.75-mg dose given on the days preceding ovulation. Contraception. 2004;70:442–50.
17. Croxatto HB, Fuentealba B, Brache V, Salvatierra AM, Alvarez F, Massai R, Cochon L, Faundes A. Effects of the Yuzpe regimen, given during the follicular phase, on ovarian function. Contraception. 2002;65:121–8. 18. Casper RF. Aromatase inhibitors in ovarian stimulation. J Steroid Biochem
Mol Biol. 2007;106:71–5.
19. Casper RF, Mitwally MF. Review: aromatase inhibitors for ovulation induction. J Clin Endocrinol Metab. 2006;91:760–71.
20. Casper RF, Mitwally MF. Use of the aromatase inhibitor letrozole for ovulation induction in women with polycystic ovarian syndrome. Clin Obstet Gynecol. 2011;54:685–95.
21. Casper RF, Mitwally MF. A historical perspective of aromatase inhibitors for ovulation induction. Fertil Steril. 2012;98:1352–5.
22. Badawy A, Abdel Aal I, Abulatta M. Clomiphene citrate or letrozole for ovulation induction in women with polycystic ovarian syndrome: a prospective randomized trial. Fertil Steril. 2009;92:849–52.
23. Badawy A, Metwally M, Fawzy M. Randomized controlled trial of three doses of letrozole for ovulation induction in patients with unexplained infertility. Reprod Biomed Online. 2007;14:559–62.
24. Mitwally MF, Casper RF. Use of an aromatase inhibitor for induction of ovulation in patients with an inadequate response to clomiphene citrate. Fertil Steril. 2001;75:305–9.
25. Ginther OJ, Beg MA, Bergfelt DR, Donadeu FX, Kot K. Follicle selection in monovular species. Biol Reprod. 2001;65:638–47.
26. Mihm M, Evans AC. Mechanisms for dominant follicle selection in monovulatory species: a comparison of morphological, endocrine and intraovarian events in cows, mares and women. Reprod Domest Anim. 2008;43 Suppl 2:48–56.
27. Yapura J, Mapletoft RJ, Pierson R, Singh J, Naile J, Giesy JP, Adams GP. A bovine model for examining the effects of an aromatase inhibitor on ovarian function in women. Fertil Steril. 2011;96:434–8. e433.
28. Yapura J, Singh J, Mapletoft RJ, Pierson R, Rogan D, Adams GP. Effect of a Prolonged Aromatase Inhibitor Treatment on Pre-Ovulatory Ovarian Follicles in Cattle. Reprod Fertil Dev. 2012;24:113.
29. Ginther OJ, Gastal EL, Gastal MO, Bergfelt DR, Baerwald AR, Pierson RA. Comparative study of the dynamics of follicular waves in mares and women. Biol Reprod. 2004;71:1195–201.
30. Hanna MD, Chizen DR, Pierson RA. Characteristics of follicular evacuation during human ovulation. Ultrasound Obstet Gynecol. 1994;4:488–93. 31. Sirois J, Fortune JE. Ovarian follicular dynamics during the estrous cycle in
heifers monitored by real-time ultrasonography. Biol Reprod. 1988;39:308–17. 32. Baerwald AR, Pierson RA. Endometrial development in association with
ovarian follicular waves during the menstrual cycle. Ultrasound Obstet Gynecol. 2004;24:453–60.
33. Baerwald AR, Adams GP, Pierson RA. Form and function of the corpus luteum during the human menstrual cycle. Ultrasound Obstet Gynecol. 2005;25:498–507.
35. Bedaiwy MA, Abdelaleem MA, Hussein M, Mousa N, Brunengraber LN, Casper RF. Hormonal, follicular and endometrial dynamics in letrozole-treated versus natural cycles in patients undergoing controlled ovarian stimulation. Reprod Biol Endocrinol. 2011;9:83.
36. Kerin JF, Kirby C, Morris D, McEvoy M, Ward B, Cox LW. Incidence of the luteinized unruptured follicle phenomenon in cycling women. Fertil Steril. 1983;40:620–6.
37. Bomsel-Helmreich O, Ali-Mifti W. Imaging in infertility and reproductive endocrinology. In: Jaffe R, Pierson R, Abramowicz J, editors. Imaging in Infertility and Reproductive Endocrinology. Philadelphia: J.B. Lippincott Company; 1994. p. 117–28.
38. Pierson R, Chizen DR. Transvaginal ultrasonographic assessment of normal and aberrant ovulation. In: Jaffe R, Pierson R, Abramowicz J, editors. Imaging in Infertility and Reproductive Endocrinology. Philadelphia: J.B. Lippincott Company; 1994. p. 129–42.
• We accept pre-submission inquiries
• Our selector tool helps you to find the most relevant journal • We provide round the clock customer support
• Convenient online submission • Thorough peer review
• Inclusion in PubMed and all major indexing services • Maximum visibility for your research
Submit your manuscript at www.biomedcentral.com/submit