Ehsan Zolfonoun a,*
a Material and Nuclear Fuel Research school, Nuclear Science and Technology Research Institute, Tehran, Iran Research Article, Issue 1
Analytical Methods in Environmental Chemistry Journal Journal home page: www.amecj.com/ir
AMECJ
---and biological samples. The quantification of metal ions in various matrices has been performed by different techniques, including spectrophotometry, atomic absorption spectrometry (AAS), and inductively coupled plasma optical emission spectrometry (ICP-OES) [3]. In addition, using the mentioned methods directly for determining indium at very low concentrations is difficult because of insufficient sensitivity of this technique, as well as the matrix interferences which occur in real samples, and an initial sample pretreatment, such as preconcentration of the analyses (or analytes) and matrix separation, is often necessary [4]. Solid
Solid phase extraction and determination of indium using
multi-walled carbon nanotubes modified with magnetic
nanoparticles
1. Introduction
Indium is an important element in the semiconductor industry, in the nuclear studies and in the production of high purity materials [1]. Indium and its compounds have numerous industrial applications including the manufacture of liquid crystal displays (LCD), semiconductors, low-temperature solders, and infrared photodetectors [2]. Also, indium compounds damage the heart, kidney, and liver. Thus, there is a need for specific and precise determination of indium traces in environmental
*Corresponding author: Email: [email protected] https://doi.org/10.24200/amecj.v1.i01.14
Solid phase extraction of indium; Ehsan Zolfonoun
A R T I C L E I N F O: Received 18 Aug 2018 Revised form 20 Oct 2018 Accepted 28 Oct 2018 Available online 31 Oct 2018
Keywords: Indium
Preconcentration Carbon nanotubes Fe3O4 nanoparticles
A B S T R A C T
In this work MWCNTs-Fe3O4 nanocomposite was used as an adsor-bent for extraction and preconcentration of indium fromaqueous lutions. The magnetic MWCNTs with adsorbed analytes were easily separated from the aqueous solution by applying an external magnetic field. After elution of the adsorbed analytes, the concentration of indi um was determined using inductively coupled plasma optical emission spectrometry determination. The effects of pH, sorbent amount, eluent type, chelating reagent concentration, sample volume, and time on the recovery of the In(III) were investigated. Moreover, under the mum conditions, the detection limit for In(III) was 0.28 µg L−1. The
precision of the method, evaluated as the relative standard deviation obtained by analyzing a series of ten replicates, was 3.1 %. Ultimately, the method was successfully applied for the determination of In(III) in .environmental water samples
phase extraction (SPE) is a routine extraction method for preconcentration of organic and inorganic analytes. This technique reduces solvent usage and exposure, disposal costs, and extraction time. In addition, based on the references, [5] and [6], various adsorbents have been used for adsorption of analytes in SPE methods.
Magnetic nanoparticles, mainly including Fe3O4 nanoparticles, received increasing attention in the recent years due to its unique properties and high potential applications in various fields such as cell separation, magnetically assisted drug delivery, enzyme immobilization, and protein separation [7, 8].. Recently, using magnetic nanoparticles for extraction of analytes in SPE methods is gaining research interest [9, 10]. In addition, multi-walled carbon nanotubes (MWCNTs) have received great attention due to their exceptional electronic, mechanical, thermal, chemical properties, and significant potential applications in many fields [11]. Owing to their large surface area and high reactivity, MWCNTs based adsorbents have been used for solid phase extraction and preconcentration of organic compounds and metal ions [12,13]. The decoration of MWCNTs with various compounds can modify their physicochemical properties. Also, this character makes them more suitable for chemical and biological applications. Functionalizing MWCNTs with magnetic nanoparticles can combine the features of magnetic nanoparticles and MWCNTs, which may result in materials with potential applications in biological labelling, drug delivery, and magnetic storage media [14, 15]. In this paper, a magnetic solid phase extraction method based on Multi-walled carbon nanotubes decorated with Fe3O4 nanoparticles is developed for the extraction and preconcentration of trace amounts of indium, prior to their determination by ICP-OES.
2. Experimental Procedure
2.1. Reagents
All reagents used were of analytical grade and
were used as supplied. HNO3, ammonia solution, FeCl3·6H2O, and FeCl2·4H2O, were purchased from Merck (Germany). MWCNTs (purity> 95%) were obtained from Sigma-Aldrich. Standard stock solution (1000 μg mL-1) of In(III) was prepared by dissolving appropriate amounts of In(NO3)3 in water. A solution of 1.0×10⁻³ mol L−1 quinalizarine (Merck) was prepared by dissolving appropriate amounts of this reagent in 0.01 mol L−1 NaOH (Merck).
2.2. Instrumentation
All the measurements were carried out using a Perkin Elmer (Optima 7300 DV) simultaneous ICP-OES coupled to a concentric nebulizer and equipped with a charge coupled device (CCD) detector. Moreover, Metrohm model 744 digital pH meter, equipped with a combined glass-calomel electrode, was employed for the pH adjustments.
2.3. Preparation of MWCNTs-Fe3O4 nanocomposite MWCNTs-Fe3O4 nanocomposite was synthesized according to the previously reported methods, which were mentioned in the references, [14] and [15]. First, MWCNTs were dispersed in concentrated nitric acid for 4 hours with ultrasonic treatment. Then purified MWCNTs were separated by filtering. Afterwards, they washed repeatedly with distilled water followed by ethanol and dried at 50 °C. The MWCNTs-Fe3O4 nanocomposite was prepared by chemical coprecipitation method. First, FeCl3·6H2O (1.18 g) and FeCl2·4H2O (0.43 g) were dissolved in 200 mL deionized water under nitrogen gas with vigorous stirring at 60
◦C. Then 1.0 gram of MWCNTs was added in the
7 Solid phase extraction of indium; Ehsan Zolfonoun
washed with 200 mL deionized water four times.
2.4. Magnetic solid-phase extraction procedure A 100-mililiter sample or standard solution containing In(III) (pH 6), and QA (1.0×10⁻⁵
mol L−1), was transferred in a glassware beaker. Then 5 mg MWCNTs-Fe3O4 nanocomposite was added into the sample solution. Afterwards, the mixture was stirred for 3 min. Subsequently, the sorbent particles were isolated by placing a strong magnet, and the supernatant was poured away. The preconcentrated target analyte was eluted using 1.0 mL of a 1 mol L−1 solution of HNO
3. Finally, the concentration of In(III) in acidic aqueous phase was determined by ICP-OES.
3. Results and discussion
3.1. Effect of pH
The effect of pH on the extraction of indium was studied in the range of 2.0–8.0 using nitric acid or sodium hydroxide. The resulting percent recovery-pH plots are shown in Fig. 1. These plots indicate that sorption is maximum and quantitative in the pH range of 6.0–7.0. Consequently, a solution pH of 6.0 was used in further experiments.
3.2. Effect of the sorbent amount
In order to study the effect of the sorbent, 2 to 10 mg of MWCNTs-Fe3O4 nanocomposite was added to 100 mL of the sample solution (Fig. 2).
The obtained results showed that by increasing the sorbent amounts from 2 up to 5 mg due to increasing accessible sites, extraction recovery increased, and then it remained constant. A 5-miligram of the MWCNTs-Fe3O4 nanocomposite was selected for subsequent experiments.
3.3. Effect of eluent type
In order to find the best eluent, different eluting solutions such as HCl, H2SO4, HNO3 and acetic acid, were tested. The results revealed that a 1.0-mililiter of 1.0 M concentration of all acids could afford the quantitative elution of In3+ from the sorbent. Finally, subsequent elutions of In3+ were carried out with 1 M HNO3 solution
3.4. Effect of chelating reagent concentration The effect of QA concentration on the extraction of indium was studied, and the results are shown in Fig. 3. Also, QA concentration in the range of 0 to 5.0×10⁻⁵ mol L−1 was investigated by us. Then, maximum recovery was obtained at a concentration of 1.0×10⁻⁵ mol L−1 of the ligand and at higher concentrations, the extraction recovery remained constant.
3.5. Effect of solution volume
The effect of solution volume was examined by
Fig. 1. Effect of pH on the recovery of In(III) ion. Fig. 2. Effect of the MWCNTs-Fe3O4 amount on the
preconcentrating different volumes (20–250 mL) of aqueous solutions spiked with a constant mass of 10.0 μg of In(III), and the results are depicted in Fig. 4. The obtained results showed that when aqueous solution volume was up to 100 mL, recoveries above 95% were obtained. Thus, 100 mL was considered to be the maximal enrichment volume for water samples. Consequently, since the final solution volume to be measured by ICP-OES was 1.0 mL, the preconcentration factor for In(III) was evaluated as 100.
3.6. Effect of extraction time
The effect of extraction time on the extraction of
In(III) was studied in the range of 1–15 min. The experimental results indicated that there was no significant effect on the extraction efficiency when the extraction time increased from 3 to 10 min. Based on the above considerations, the extraction time that is equal to 3 min was selected for further studies.
3.7. Effect of diverse ions on the recovery
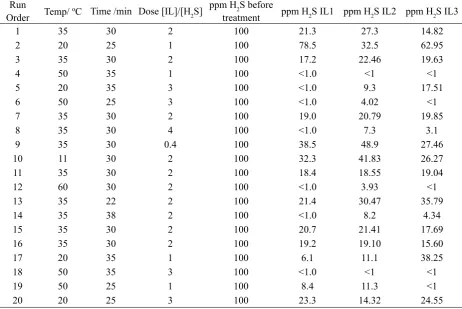
In order to assess the possible analytical applications of the recommended procedure, the effect of common coexisting ions in natural water samples on the preconcentration and determination of indium ion was studied. In these experiments, 100 mL solutions containing 50 μg L−1 of indium and various amounts of interfering ions were treated according to the recommended procedure. In addition, tolerable limit was defined as the highest amount of foreign ions that produced an error not exceeding ±5% in the determination of investigated analyte ion. The results are summarized in Table 1. As seen, a large number of ions used have no considerable effect on the determination of indium.
3.8. Analytical figures of merit
In Table 2, the analytical characteristics of the proposed method, including linear range, limit of detection, reproducibility, and enrichment factor have been summarized. In the optimum conditions, a calibration graph was constructed by preconcentrating a series of the solutions according to the recommended procedure. There is an important tip, that the calibration curve for In(III) was linear form 1.0 to 500 µg L−1 with a regression Fig. 3. Effect of chelating reagent concentration on the
recovery of In(III) ion.
Fig. 4. Effect of sample volume on the recovery of In(III) ion.
Table 1. Tolerance limits of some cations and anions on the sorption and determination of indium.
Ion Tolerance limit (µg mL−1)
Li+, Na+, K+, Cl-, NO
3- >2000
Ca2+, Mg2+, Ba2+, Sr2+ 1000
Ag+, Hg2+, SO
4- 50
Cu2+, Fe3+, Pb2+, Ni2+, Co2+,
Cr3+, Mn2+, Cd2+, Zn2+
9 Solid phase extraction of indium; Ehsan Zolfonoun
coefficient of 0.995. The limit of detection (LOD) of the proposed method for the determination of indium was studied under the optimal experimental conditions. The LOD, defined three times by paying attention to the standard deviation of 10 measurements of the blank solution divided by the slope of the calibration curve, was 0.28 µg L−1. The reproducibility of the proposed method for extraction and determination of 50 µg L−1 indium (n= 10) was also studied. Finally, the relative standard deviations (R.S.D.) of these determinations were 3.1 %.
3.9. Application
The accuracy of the proposed method was tested by separation and determination of In(III) in tap water, mineral water, and well water samples. The obtained results are given in Table 3. The relative recoveries for the spiked samples were in the range of 94–109 %. The results demonstrated that the proposed method was suitable for the determination of In(III) in real samples.
4. Conclusions
In this study, a fast and simple method based was developed for the separation and preconcentration of indium,prior to ICP-OES determination. The use of NPs endued the SPE method with high extraction capacity and preconcentration factors. The magnetic separation greatly improved the separation rate while avoided the time-consuming column passing or filtration operation. The proposed preconcentration and determination method gives a low limit of detection and good R.S.D. values. Finally, the method can be successfully applied to the separation and determination of indium in real samples.
5. References
[1] M. Souad, C. Louage, J. Yves Doisy, L. Meunier, A. Benderrag, B. Ouddane, S. Bellayer, N. Nuns, M. Traisnel, U. Maschke, Extraction of indium-tin oxide from end-of-life LCD panels using ultrasound assisted acid leaching, Ultrason. Sonochem., 40 (2018) 929-936.
[2] J. Uhrovčík, J. Lesný, Determination of indium in liquid crystal displays by flame atomic absorption spectrometry, J. Ind. Eng. Chem., 21 (2015) 163-165.
[3] J.R. Dean, Practical inductively coupled plasma spectroscopy, Wiley., UK, 2005.
[4] B. Çelik, E. Akkaya, S. Bakirdere, F. Aydin, Determination of indium using vortex assisted solid phase microextraction based on oleic acid coated magnetic nanoparticles combined with slotted quartz tube-flame atomic absorption spectrometry, Microchem. J., 141 (2018) 7-11.
[5] M. Eftekhari, M. Gheibi, M. Akrami, F. Iranzad, Solid-phase extraction of ultra-trace levels of lead using tannic acid-coated graphene oxide as an efficient adsorbent followed by electrothermal atomic absorption spectrometry; response surface methodology – central composite design, New J. Chem., 42 (2018) 1159-1168.
[6] J.B. Ghasemi and E. Zolfonoun, Simultaneous spectrophotometric determination of trace amounts of uranium, thorium, and zirconium using the partial least squares method after their preconcentration by α-benzoin oxime modified Amberlite XAD-2000 resin, Talanta, 80 (2010) 1191-1197.
[7] Y. Li, Y.C. Liu, and J. Tang, Fe3O4-Al2O3 magnetic core-shell microspheres for rapid and highly specific capture of phosphopeptides with Table 2. Analytical parameters of the proposed method.
Parameter Analytical feature Linear range (µg L−1) 1.0−500
r2 0.995
LOD (µg L−1) 0.28
R.S.D. % (n = 10) 3.1 Enrichment factor 100
Table 3. Recovery of indium from water samples.
Sample Indium
Added
(µg L−1) (µg LFound −1) Recovery(%)
Tap water 0.0 <LOD –
10.0 9.7 (1.8)a 97
Mineral water 0.0 <LOD – 10.0 10.9 (1.4) 109 River water 0.0 <LOD –
10.0 9.4 (2.6) 94
a Values in parentheses are R.S.D.s based on three
mass spectrometry analysis, J. Chromatogr. A, 1172 (2007) 57-71.
[8] D. Horak, B. Rittich, J.A. Safar, A. Spanova, J. Lenfeld, and M.J. Benes, Properties of RNase A immobilized on magnetic poly(2-hydroxyethyl methacrylate) microspheres. Biotechnol. Prog., 17 (2001) 447-452.
[9] J.B. Ghasemi and E. Zolfonoun, Simultaneous spectrophotometric determination of trace amount of polycyclic aromatic hydrocarbons in water samples after magnetic solid-phase extraction by using projection pursuit regression, Environ. Monit. Assess., 185 (2013) 2297-2305.
[10] A. Mehdinia, M. Ramezani, A. Jabbari, Preconcentration and determination of lead ions in fish and mollusk tissues by nanocomposite of Fe3O4@graphene oxide@polyimide as a solid phase extraction sorbent, Food Chem., 237 (2017) 1112-1117.
[11] R.H. Baughman, A.A. Zakhidov, and W.A. deHeer, Carbon nanotubes-the route toward
applications,Science, 297 (2002) 787-792.
[12] C. Herrero-Latorre, J. Barciela-García S. García- Martín R. M. Peña-Crecente, Graphene and carbon nanotubes as solid phase extraction sorbents for the speciation of chromium: A review, Anal. Chim. Acta, 1002 (2018) 1-17.
[13] Z. Dehghani, Firouzabadi, S. Dadfarnia, A.M. Haji Shabani, M.H. Ehrampoush, E.N. Tafti, Magnetic dispersive solid phase extraction using modified magnetic multi-walled carbon nanotubes combined with electrothermal atomic absorption spectrometry for the determination of selenium, Int. J. Environ. Anal. Chem., 98 (2018) 555-569.
[14] A. Pistone, D. Iannazzo, and M. Fazio, Synthesis and magnetic properties of multiwalled carbon nanotubes decorated with magnetite nanoparticles, Physica B, 435. (2014) 88-91.
Research Article, Issue 1
Analytical Methods in Environmental Chemistry Journal Journal home page: www.amecj.com/ir
AMECJ
---Ali Akbar Miran Beigia,*, Maryam Yousefia,b, and Majid Abdoussb a Research Institute of Petroleum Industry, West Blvd. of Azadi Sport Complex, Tehran, Iran
b Department of Chemistry, Amirkabir University of Technology, P.O. Box 15875-4413, Tehran, Iran
along with methane and light hydrocarbons in many oil and gas fields [7, 8]. According g to the international environmental regulations, H2S contained in the acid gases should be effectively removed before emission to atmosphere [8, 9]. H2S is commonly removed from natural and synthesis gases through chemical absorption using aqueous solutions of organic bases like single amines, amine mixtures, or mixtures of an amine and a salt of an amino acid [10-12]. Extensive research has been conducted by several groups on aqueous solutions of alkanolamines, especially
Room temperature imidazolium-based ionic liquids as
scavengers for hydrogen sulfide removal of crude oil
1. Introduction
Hydrogen sulfide is one of the most abundant sulfur containing compounds in natural gas and light and middle distillate oil fractions as well as in atmospheric air effluents and pulp and paper industry. Hydrogen sulfide is undesirable, colorless, odorous, highly toxic, and poisonous for catalysts and corrosive to industrial gas and oil streams [1-3]. Also, it can be regarded as a major source of air pollution [4-6]. This acid gas is produced
*Corresponding author emails: [email protected]
DOI: https://doi.org/10.24200/amecj.v1.i01.32
A R T I C L E I N F O: Received 20 Aug 2018 Revised form 24 Oct 2018 Accepted 30 Oct 2018 Available online 31 Oct 2018
Keywords: H2S removal Crude oil Ionic liquids
Commercial scavengers Petroleum refining
A B S T R A C T
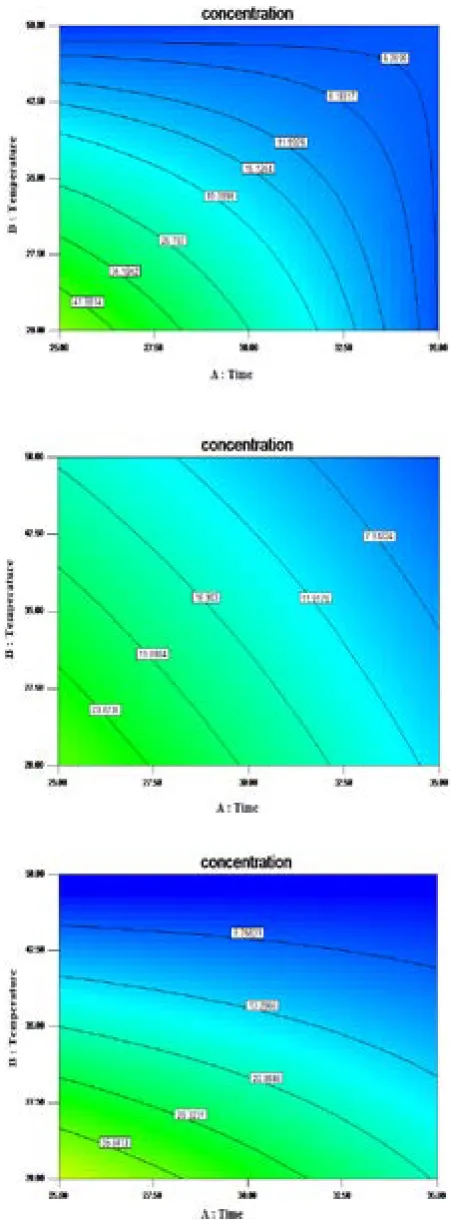
Determination of H2S amounts in crude oil was performed by a precise method instead of UOP163 that were developed in our pervious works. Evaluation of ILs and scavengers were done by two ways. The first one was based on variable concentration of ILs as the scavenger (dynamic method), and the second one was based on a constant concentration of the scavenger during H2S removal process (static method). In the static method, design of
experiments was performed for all three tested ILs and three parameters such as time, temperature, and dosage (injection volume) of ILs were investigated. A wide range of time and temperature was also studied according to operating conditions in petroleum terminals. The dose of ILs was obtained from the dynamic method. According to the obtained results, these ILs had a significant effect on H2S reduction in crude oil, so that H2S concentration
in some conditions was less than 1 ppm. In comparison between ILs and commercial scavengers’s performance can be properly understood that not only ILs reduced H2S concentration, but also their dosage was very low, and mole ratio of [IL]/[H2S] was 1:3 that it was negligible compared with
commercial scavengers. Also the results showed that [EMIM][NTf2] was more effective than the other ILs in H2S removal.
Ionic liquids for hydrogen sulfide removal; Ali Akbar Miran Beigi, et al
monoethanolamine (MEA), diethanolamine (DEA) and methyldiethanolamine (MDEA) for treating and sweetening [13-16]. All of them are volatile and they show a reversible reaction that it can reverse H2S in refining processes and make the process economically expensive [17].
In contrast ionic liquids (ILs) provides a vaporless, thermally stable [18, 19], reusable “green” solvent and catalyst for chemical reactions, so ILs has very possibility for removal of H2S. ILs are molten salts composed entirely of ions, and many of them are liquids at room temperature. Room temperature ionic liquids (RTILs), often referred to as ‘designer solvents’, have been the great focus of scientists in various fields since they can be tuned for specific applications [20-27]. Nowadays, the most commonly studied ILs normally contain, imidazolium, ammonium, phosphonium, pyridinium, and pyrrolidinium cations, and
tetrafluoroborate, hexafluorophosphate, bistrifluorosulfonylimide and triflate anions [20,
25, 28-30]. In addition, the physicochemical properties of ILs can be finely tuned by slight structural changes of the corresponding cations and anions [23–26]. To better understand the nature of ionic liquids and rationally expand their applications especially as pollutant scavenger and electrolyte, knowledge of their thermophysical
and electrochemical properties is required. In this work [Hmim][BF4], [Emim][Ntf2] and [Bmim] [MeSO4] were used as scavengers for H2S removal from crude oil and then the results were compared with several commercial scavengers. Molecular structures of the three ILs are shown in Fig. 1. In our previous work, physical and electrochemical properties of these ILs were investigated. Viscosity, solubility, thermal decomposition and electrochemical window of three ILs were studied more than the other properties. So these mentioned properties have been applied for H2S removal. For example, the viscosity of selected ILs was fully compatible with the crude oil. Therefore, use of them in crude oil was not a problem. The thermal stability of ILs was very high and their ability at high temperatures was excellent. ILs may be have hydrophilic or lipophilic properties.
The hydrophilic and lipophilic ILs can remove H2S of aqueous and organic parts of crude oil respectively. The decomposition temperature ranges of three ILs are shown in Table 1. Also, the experimental values of physicochemical properties of [HMIM][BF4], [EMIM][NTf2] and [BMIM][MeSO4], such as density, refractive index, dynamic and kinematic viscosities, pH, and surface tension are listed in Table 2[20]. According to our previous studies these ILs are very suitable for H2S
Fig. 1. Molecular structures of the three ILs
1-Hexyl-3-Methylimidazolium Tetrafuoroborate
[HMIM][BF4] C10H19BF4N2 M.W. = 254.08
IL1
1-Buthyl-3-Methylimidazolium Methylsulfate [BMIM][MeSO4]
C9H18N2O4S M.W. = 250.32
IL3
1-Ethyl-3-Methylimidazolium bis(trifluoromethylsulfonyl)imide
[EMIM][NTf2] C8H11F6N3O4S2 M.W. = 391.32
IL2 Hydrophilic Property
13 Ionic liquids for hydrogen sulfide removall Ali Akbar Miran Beigi, et al
scavenging and to the best of our knowledge we didn’t find any paper related to H2S removal from crude oil by using ILs. In addition, these ILs unlike other scavengers don’t have any disadvantages such as slow synthetics, high consumption, unstable in high temperatures, or increase salt and sediments content. Of course the elimination
t (oC) ρ (g mL-1) η (mPa s) n
D σ(mN m-1) 104 ap (K) pH of 1% Solution
[HMIM][BF4]
10 1.1562 608.1 1.4265 41.4 5.343
20 1.1492 311.7 1.4241 40.6 5.525 6.41
25 1.1461 220.0 1.4223 40.4 5.623 6.25
30 1.1425 167.3 1.4211 40.0 5.718
40 1.1355 103.3 1.4183 39.8 5.909 5.77
50 1.1280 63.77 1.4158 39.0 6.104
60 1.1214 52.22 1.4137 38.2 6.302 5.12
70 1.1122 28.48 1.4106 37.2 6.504
80 1.1004 21.39 1.4080 36.6 6.709 4.49
90 1.0874 15.87 1.4051 36.3 6.918 4.17
95 1.0838 13.92 1.4038 35.9 7.025
[EMIM][NTf2]
10 1.5311 55.92 1.4254 40.2 4.706
20 1.5220 37.27 1.4232 39.8 5.518 6.48
25 1.5168 31.13 1.4220 39.4 5.929 6.5
30 1.5117 26.28 1.4206 39.0 6.344
40 1.5020 19.67 1.4179 38.8 7.186 6.54
50 1.4907 14.96 1.4153 38.6 8.045
60 1.4780 11.84 1.4127 38.0 8.925 6.60
70 1.4651 9.506 1.4101 37.2 9.828
80 1.4494 7.820 1.4072 36.6 10.76 6.66
90 1.4292 6.539 1.4045 36.0 11.72 6.69
95 1.4230 6.054 1.4033 35.5 12.21
[BMIM][MeSO4]
10 1.2117 220.6 1.4831 46.0 4.457
20 1.2053 122.3 1.4777 44.4 4.810 7.60
25 1.2019 93.78 1.4771 43.7 4.988 7.55
30 1.1983 73.35 1.4765 43.4 5.167
40 1.1923 46.85 1.4745 42.6 5.530 7.39
50 1.1853 32.21 1.4719 42.0 5.899
60 1.1774 23.02 1.4694 41.2 6.274 7.18
70 1.1668 17.05 1.4673 39.8 6.656
80 1.1538 13.14 1.4650 39.0 7.0453 6.96
90 1.1400 10.34 1.4626 38.1 7.443 6.85
95 1.1356 9.257 1.4615 37.6 7.645
Table 2. Densityρ, dynamic viscosity η, refractive index nD, surface tension σ, thermal expansion ap, and pH of the
ionic liquids at different temperatures
Table 1. Thermal decomposition for investigated ionic liquids.
Ionic Liquid Decomposition Temperature Range/ºC [HMIM][BF4] 310-500
[EMIM][NTf2] 390-510
reaction mechanism is unknown and our further studies certainly will be in this field.
In present work determination of H2S amounts in crude oil was performed by the method that was presented by researchers at Research Institute of Petroleum Industry method (RIPI). [31] Then ILs was used in two different ways as scavengers for H2S removal. Finally, the results of both methods were compared with several commercial scavengers. Also, in our next work, metallic nanoparticles will be synthesized in ionic liquids media for H2S removal from crude oil.
2. Experimental
2.1. Materials
All chemicals and three ionic liquids were purchased from Merck, Aldrich and Fluka companies. The chemicals were used without further purification. Crude oil samples included exported crude oil such as Balarood, Masjed Soleyman, Soomar, Bahregan, and Furoozan.
2.2. Experimental procedure
The RIPI method was applied for determination of H2S amounts in crude oil. As we have previously reported this method was based on preliminary extraction with voltammetric detection. This method offers several inherent advantages for H2S determination. Voltammetric detection methods are specific, since other species are electrochemically inactive at potentials where H2S is detected. Also, this technique is very sensitive. Apparatus for determination of hydrogen sulfide in crude oil is shown in figure 2. After the measurement of H2S content in crude oil, evaluation of several commercial scavengers and the ILs was done. Unfortunately there was not a systematic and standardized method to evaluate the efficiency of scavengers. In present work two methods was applied for evaluation. One is related to RIPI, was based on constant concentration of ILs or commercial scavengers and the other one was based on variable concentration of them that is related to
15 Ionic liquids for hydrogen sulfide removall Ali Akbar Miran Beigi, et al
oil export terminals. In the constant concentration method for ILs, design of experiment was applied by using Design Expert software.
3. Results and discussion
3.1. Evaluation of commercial scavengers
Evaluation of commercial scavengers was developed by two methods.
3.1.1 First method (Variable concentration)
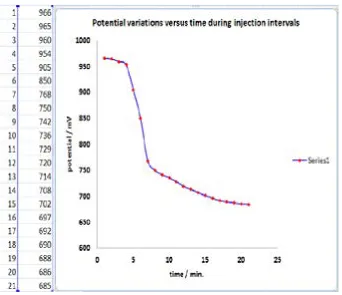
This method has been developed by the RIPI, had high operating speed. The scavengers that were used had fast kinetic and high efficiency. Evaluation in this method was based on measuring and following potential variations of crude oil during addition of scavengers in a specified time. A potential variation of crude oil was shown in figure 3.
In the RIPI method, usually in the one minute intervals, approximately 50 µL of scavenger was added to the certain amount of crude oil (about 100 g) and potential changes versus time and volume
consumption of scavenger were recorded (Fig.3). Mutations that occurred in the potential curves were related to the equivalent point of H2S titration by scavenger. In the equivalent point, almost all H2S contents were neutralized by scavenger and crude oil are free of H2S.
Primary investigations showed that electrode potential was depended on H2S or S concentration in crude oil. As long as hydrogen sulfide was present in the crude oil, electrode potential, depending on the H2S concentration in the specified range was nearly between -900 up to -1200 mV. It should be noted that beside H2S concentration the electrode potential could be a function of temperature and electrolyte. Also, according to the Nernst equation, the electrode potential is depend on oxidative and reductive concentration, ions mobility and activity coefficient. Therefore, the potential ranges difference between -900 to -1200 mV may be due to one of the items listed above. In this method, evaluation of H2S reduction was based on
decreasing of the electrode potential. Experience indicated that when the crude oil was free of H2S, electrode potential shifted to nearly less than -750 up to -800 mV. To more accurate investigations, 4 samples of commercial scavengers were tested using this method, and the results are given in Table 3.
As can be observed, sulfavent 32 and sulfavent 43 had better efficiency than the others. Lesser amounts of sulfavent 32 were used, on the other hand, Sulfavent 43 had higher speed. So that, for the neutralization of H2S in crude oil, only 1 ml of scavenger was needed during 7 minutes. Although, both methods gave same results in the selection of scavengers, but the RIPI method provided more information, such as the effective time of scavenger and equivalent point.
3.1.2. Second method (Constant concentration)
This method was based on instructions of oil export terminals. First, the amount of H2S was measured in crude oil and then specific dosage of scavengers was added to the crude oil. The consumed volume of scavenger (was related to H2S concentration. Here, H2S concentration was based on the
amount of hydrogen sulfide in crude oil, which is usually between 50 to 100 ppm of scavenger and depending on its efficiency, was about 2 to 5 times of the amount of H2S in crude oil.
In a general evaluation, 100 g of a crude oil containing 75 ppm H2S, was chosen. Then 225 ppm ([Scavenger]/[H2S]:3) of the scavenger was added to it. After an hour stirring at room temperature, the H2S concentration was measured with RIPI method. The same experimental conditions were done for an overnight and the results were reported and compared. Accordingly, all four samples were tested and the results are shown in Table 4.
Since the experiments were conducted on consecutive days, and there was no possibility of H2S amount stabilization. So, the results were normalized in first and the last columns. As can be seen in the table, without any commercial scavenger, H2S concentration has reached to 43 ppm after an overnight, but by mistake this reduction was generally considered to be scavenger. As a result, long reaction time was one of disadvantages in this method.
The result showed that all scavengers, with the exception of Sulfavent 44, had the ability to remove Sample name Injection volume/ml (initial)/mvE (final)/mvE Treatment time/min
sulfavent 32 0.65 1100 805 15
sulfavent 42 0.55 1080 810 10
sulfavent 43 1 1000 860 7
sulfavent 44 1 1100 945 12
Table 3. Evaluation of commercial scavengers using RIPI method
Table 4. Evaluation of commercial scavengers using constant concentration of scavenger sample name H2S content in crude
befor treatment / ppm after 1 hour treatment / H2S content in crude ppm
H2S content in crude after overnight
treatment / ppm
H2S content in crude before treatment after
overnight / ppm
sulfavent 32 75 10.5 < 1.0 43
sulfavent 42 75 47.0 < 1.0 43
sulfavent 43 75 5.4 < 1.0 43
17 Ionic liquids for hydrogen sulfide removall Ali Akbar Miran Beigi, et al
H2S from crude oil. Whereas both Sulfavent 32 and 43 had satisfactory results after an hour. It seems that this method, where to store crude oil before loading, is appropriate. In the second method, which was developed by RIPI, those of scavengers that had rapid reaction kinetics (less than 15 min) will be successful in reduction or elimination of H2S from crude oil.
3.2. Evaluation of Ionic Liquids
3.2.1 First method (Variable concentration)
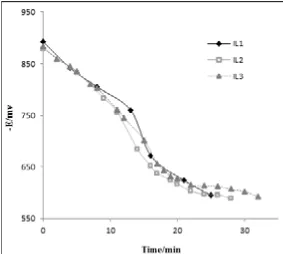
The basis of this method, as was explained in the case of scavengers, was based on gradual addition of ionic liquids and measuring and following potential variations of crude oil. First, the amount of H2S was measured in crude oil, then 20 ml of isopropyl alcohol and 30 ml of toluene was added to 50 g of crude oil that containing 100 ppm of H2S. At the beginning, electrode potential was read, then certain amount of ionic liquid (approximately 10 µl) was added to crude oil in the same time intervals and potential variations was recorded. Fig. 4 shows the potential variations versus time for three ionic liquids. Also, in this method, the required volume
of ionic liquid to minimize concentration to less than 15 ppm of H2S was determined. When the electrode potential shifted to less than -800 mV, H2S concentration was less than 15 ppm.
As can be seen in this chart, the ILs have been able to reduce H2S concentration to less than 1 ppm, in a short time (less than 30 minutes). Also, the mole ratio of [IL]/ [H2S] was 2.3, 1.3, and 2.5 for [HMIM][BF4], [EMIM][NTf2], and [BMIM] [MeSO4] respectively that these were equal to 75 µl, 48 µl and 76 µl of ionic liquids. These values were negligible in comparison to commercial scavengers. Also among the three ionic liquids, [EMIM] [NTf2] had a higher efficiency in H2S removal from crude oil. Since [EMIM] [NTf2] is lipophilic and its viscosity is closer to crude oil’s viscosity, it can be better H2S scavenger, moreover the consumed volume of IL2 is less than the others.
3.2.2. Second method (Constant concentration)
In this method, the H2S concentration was measured in 15 g of crude oil, then specific dosage or concentration of ionic liquid was added to the crude oil. In fact, according to the dynamic
method results and operating condition in crude oil terminals, the required time, temperature and dosage of ILs, were determined for H2S removal. Finally, after considering the conditions in crude oil terminals (crude oil temperature, scavenger dosage and duration the crude oil passes through pipeline) and according to dynamic method results, it can be concluded that the required amount of ILs to remove H2S should be selected from 1 to 3 [IL]/ [H2S] mole ratio, the reaction time from 25 min to 35 min and the temperature from 20° C to 50° C, should be selected. After identifying these factors design of experiment was performed for each IL, using Design Expert software.
3.2.3. Design of experiment
As mentioned, the effective parameters or factors on H2S concentration was detected by using dynamic method. Then design of experiment was performed using Expert design software that
contained 20 runs or tests for each IL and various conditions such as dosage, temperature and reaction time, was applied separately for each run. The results are given in Table. 5. As can be seen in this table, first the concentration of H2S was 100 ppm and after applying various conditions, such as dosage, time and temperature, H2S concentration was reduced even less than 1 ppm. Columns 5 to 8 were normalized, because in some cases, H2S concentration was more than 100 ppm, therefore all results were normalized to 100 ppm. It is obvious that if IL dosage, time and temperature was grater, H2S concentration was lower.
Runs 4 and 14 for IL2 and crude oil sample without using ionic liquids are briefly reviewed in Table 6. H2S concentration at the beginning was 113.27 ppm that was normalized to 100 ppm after 35 min stirring at 30 oC. The electrode potential shifted to -675 mV indicated that H2S concentration was reached to less than 1 ppm. Also after run 14, H2S
Run
Order Temp/ oC Time /min Dose [IL]/[H2S] ppm H2
S before
treatment ppm H2S IL1 ppm H2S IL2 ppm H2S IL3
1 35 30 2 100 21.3 27.3 14.82
2 20 25 1 100 78.5 32.5 62.95
3 35 30 2 100 17.2 22.46 19.63
4 50 35 1 100 <1.0 <1 <1
5 20 35 3 100 <1.0 9.3 17.51
6 50 25 3 100 <1.0 4.02 <1
7 35 30 2 100 19.0 20.79 19.85
8 35 30 4 100 <1.0 7.3 3.1
9 35 30 0.4 100 38.5 48.9 27.46
10 11 30 2 100 32.3 41.83 26.27
11 35 30 2 100 18.4 18.55 19.04
12 60 30 2 100 <1.0 3.93 <1
13 35 22 2 100 21.4 30.47 35.79
14 35 38 2 100 <1.0 8.2 4.34
15 35 30 2 100 20.7 21.41 17.69
16 35 30 2 100 19.2 19.10 15.60
17 20 35 1 100 6.1 11.1 38.25
18 50 35 3 100 <1.0 <1 <1
19 50 25 1 100 8.4 11.3 <1
20 20 25 3 100 23.3 14.32 24.55
19 Ionic liquids for hydrogen sulfide removall Ali Akbar Miran Beigi, et al
Fig. 6(b). The electrode potential versus volume of silver nitrate for H2S measurement in crude oil that contains IL2
Fig. 6(a). The electrode potential versus volume of silver nitrate for H2S measurement in crude oil that contains IL2.
Fig. 5. The electrode potential versus volume of silver nitrate for H2S measurement in crude oil.
Table 5. Continue of Design of experiment for three ionic liquids.
weight consumption of Volume AgNO3
Initial potential
(mV)
H2S (ppm)
Condition Time
(min) Temperature (oC) Dose [IL]/[H2S]
Crude oil 10.2 7.2 -1100 113.3 - -
-IL2 (Run 4) 15.0 - -670 <1.0 35 50 1
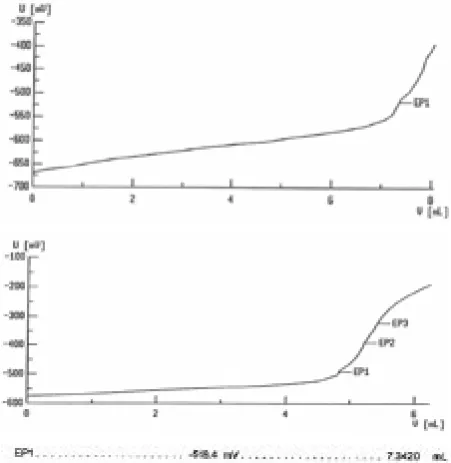
concentration was decreased from 113.27 ppm to less than 1 ppm. The potentiometric curves for crude oil, runs 4 and 14 are presented respectively in figure 5.
The first chart showed H2S concentration before addition of ionic liquids and the second one showed H2S concentration after addition of ionic liquids in a special time and temperature. The electrode potential versus volume of silver nitrate was shown in Fig.5 and H2S concentration can be calculated before and after of ILs addition, according to the following formula.
H2S concentration before Run 4 and Run 14 for [EMIM][NTf2] was 116.66 ppm as shown in figure 6a and 6b. H2S concentration was diminished to less than 10 ppm after the Runs 4 and 14. figure 7 and 8 showed the electrode potential versus volume consumption of silver nitrate for runs 4 and 14 respectively. The EP3 (third equivalent point) for run 4 and EP1 for run 14 showed the required volume consumption of silver nitrate that neutralized H2S amounts in crude oil.
Because the electrode potential was started with -675 mV, as a result H2S concentrations is less than 1 ppm.
We found that all three parameters had significant effect in H2S removal by obtained results of this software. Here a few charts are examined briefly in figure 8.
Fig. 7. The electrode potential versus volume of silver nitrate for H2S measurement in crude oil that contains IL2.
21 Ionic liquids for hydrogen sulfide removall Ali Akbar Miran Beigi, et al
These figures showed that at constant dosage, if temperature and time were grater, H2S concentration was less. Also [EMIM][NTf2] had better efficiency than the other ILs in H2S removal, because it reduced H2S concentration to less than 15 ppm in a short time.
4. Conclusions
The results showed that all three ionic liquids were chosen correctly, because all of them are suitable for H2S removal from crude oil. The investigation of chemical and physical properties of ionic liquids that all results were presented in our previous work, were indicated that some properties such as high thermal stability, pH, solubility, and wide electrochemical windows, defined them as a suitable scavenger to H2S removal. Using ionic liquids in the limited situation, and at low concentrations of H2S, is effective for crude oil sweetening. In comparison between commercial scavengers and ionic liquids and according to the obtained results from dynamic method and design of experiments, it is found by us that ILs is more effective than commercial scavengers because the volume consumption of ILs is less than the scavengers. Also, ILs could reduce H2S concentration to less than 1 ppm. In design of experiments, three parameters (dosage, time and temperature) were investigated which all of them are effective in H2S removal, and time is the most effective parameter. In addition, the results of dynamic method and design of experiment show that [EMIM][NTf2] has better performance; in addition, the lower dosage of it has been spent.
5. References
[1] H. Sakhaeinia, V. Taghikhani, A. H. Jalili, A. Mehdizadeh, A. A. Safekordi, Solubility of H2S
in 1-(2-hydroxyethyl)-3-methylimidazolium ionic liquids with different anions, Fluid Phase Equilibria, 298 (2010) 303–309.
[2] R.C. Sahu, R. Patel, B.C. Ray, Removal of hydrogen sulfide using red mud at ambient conditions, Fuel
Pro. Tech., 92 (2011) 1587–1592.
[3] N.N. Nassar, M.M. Husein, P. Pereira-Almao, Ultradispersed particles in heavy oil: part II, sorption of H2S (g), Fuel Pro. Tech. 91 (2010) 169–
174.
[4] N. Haimour, R. El-Bishtawi, A. Ali-Wahbi, Equilibrium adsorption of hydrogen sulfide onto CuO and ZnO, Desalination, 181 (2005) 145-152. [5] T.H. Ko, H. Chu, H.P. Lin, C.Y. Peng, Red soil as a
regenerable sorbent for high temperature removal of hydrogen sulfide from coal gas, J. Hazard. Mater., B136 (2006) 776–783.
[6] J.B. Chung, J.S. Chung, Desulfurization of H2S using
cobalt-containing sorbents at low temperatures, Chem. Eng. Sci., 60 (2005) 1515–1523.
[7] A.H. Jalili, A. Mehdizadeh, M. Shokouhi, A. N. Ahmadi, M. Hosseini-Jenab, F. Fateminassab, Solubility and diffusion of CO2 and H2S in the ionic
liquid 1-ethyl-3-methylimidazolium ethyl sulfate, J. Chem. Thermodyn., 42 (2010) 1298–1303. [8] Y. Duan, Y. Xiang, D. Xia, Removal of hydrogen
sulfide from light oil with solid base, Fuel Pro. Technol., 86 (2004) 237–244.
[9] M.A. Sayyadnejad, H.R. Ghaffarian, M. Saeidi, Removal of hydrogen sulfide by zinc oxide nanoparticles in drilling fluid, Int. J. Environ. Sci. Tech., 5 (2008) 565-569.
[10] M.B. Shiflett, A. Yokozeki, Separation of CO2 and
H2S using room temperature ionic liquid [bmim] [PF6], Fluid Phase Equilibria, 294 (2010) 105–113. [11] W. Quan, X. Wang, C. Song, Selective removal
of H2S from biogas using solid amine-based
“molecular basket” sorbent, Energy Fuels, 31 (2017) 9517–9528.
[12] R. T. Driessen, M. J. Bos, D. W. F. Brilman, A multistage fluidized bed for the deep removal of sour gases: proof of concept and tray efficiencies, Ind. Eng. Chem. Res., 57(2018) 3866–3875. 13] J. Li, Z. Dai, M. Usman, Z. Qi, L. Deng. CO2/
H2 separation by amino-acid ionic liquids
[14] A.S. Rewar, S.V. Shaligram, U.K. Kharul, Polybenzimidazole based polymeric ionic liquids possessing partial ionic character: effects of anion exchange on their gas permeation properties, J. Membrane Sci., 497 (2016) 282-288.
[15] M.d. Sakinul Islam, K. N. Dhanavath, N. Kao, P. K. Bhattacharjee, B. Si-Ali, R.Yusoff, Carbon dioxide induced degradation of diethanolamine during absorption and desorption processes, Chinese J. Chem. Eng., 26 (2018) 293–302.
[16] S. Yar-Khan, M. Yusuf, A. Malani, Selection of amine in natural gas sweetening process for acid gases removal: A review of recent studies, petrol. petrochem. Eng. J., 1 (2017)1-7.
[17] F. L. Bernard, F. Dalla Vecchia, M. F. Rojas, R. Ligabue, M. O. Vieira, E. M. Costa, Vitaly V. Chaban, S. Einloft, Anticorrosion Protection by Amine–Ionic Liquid Mixtures: Experiments and Simulations, J. Chem. Eng. Data, 61 (2016) 1803– 1810.
[18] H. Lü, C. Deng, W. Ren, X. Yang, Oxidative desulfurization of model diesel using [(C4H9)4N]6Mo7O24 as a catalyst in ionic liquids,
Fuel Process. Technol., 119 (2014) 87–91.
[19] Y. Nie, C.X. Li, H. Meng, Z.H. Wang, N,N-dialkylimidazolium dialkylphosphate ionic liquids: their extractive performance for thiophene series compounds from fuel oils versus the length of alkyl group, Fuel Process. Technol., 89 (2008) 978–983. [20] A.A. Miran Beigi, M. Abdouss, M. Yousefi, S.M.
Pourmortazavi, A.Vahid, Investigation on physical and electrochemical properties of three imidazolium based ionic liquids (1-hexyl-3-methylimidazolium tetrafluoroborate, 1-ethyl-3-methylimidazolium bis(trifluoromethylsulfonyl) imide and 1-butyl-3-methylimidazolium methylsulfate), J. Mol. Liq., 177 (2013) 361–368.
[21] L. Wang, Y. Xu, Z. Li, Y. Wei, J. Wei, CO2/CH4 and
H2S/CO2 selectivity by ionic liquids in natural gas
sweetening, Energy Fuels, 32 (2018) 10−23. [22] F. Billeci, F. D. Anna, H. Q. Nimal Gunaratne,
N. V. Plechkova, K. R. Seddon, Ionic liquid gels:
materials for sweetening of fuels, Green Chem., 20 (2018) 4260-4276.
[23] Y. Zhao, H. Gao, X. Zhang, Y. Huang, D. Bao, S. Zhang, Hydrogen Sulfide Solubility in Ionic Liquids (ILs): An Extensive Database and a new ELM model mainly established by imidazolium-based ILs, J. Chem. Eng., 61 (2016) 3970-3978. [24] J.X. Zhou, J.B. Mao, S.G. Zhang, Calculations of
the interaction between thiophene and ionic liquids, Fuel Process. Technol., 89 (2008) 1456–1460 [25] Cecilia Devi Wilfred, Chong Fai Kiat, Zakaria
Man, M. Azmi Bustam, M. Ibrahim M. Mutalibb, Chan Zhe Phak, Extraction of dibenzothiophene from dodecane using ionic liquids, Fuel Process. Technol., 93 (2012) 85–89
[[27] W. Zhu, W. Huang, H. Li, M. Zhang, W. Jiang, G. Chen, C. Han, Polyoxometalate-based ionic liquids as catalysts for deep desulfurization of fuels, Fuel Process. Technol., 92 (2011) 1842–1848.
[28] D. Zhao, Y. Wang, E. Duan, J. Zhang, Oxidation desulfurization of fuel using pyridinium-based ionic liquids as phase-transfer catalysts, Fuel Process. Technol., 91 (2010) 1803–1806
[29] H. Shirkhanloo, Sara Davari Ahranjani, A lead analysis based on amine functionalized bimodal mesoporoussilica nanoparticles in human biological samples by ultrasoundassisted-ionic liquid trap-micro solid phase extraction, J. Pharm. Biomed. Anal., 157 (2018) 1–9
[30] A. Faghihi-Zarandi, H. Shirkhanloo, C. Jamshidzadeh, A new method for removal of hazardous toluene vapor from air based on ionic liquid-phase adsorbent, Int. J. Environ. Sci. Tech., Accepted: 16 August 2018, Doi.org/10.1007/ s13762-018-1975-5.
Research Article, Issue 1
Analytical Methods in Environmental Chemistry Journal Journal home page: www.amecj.com/ir
AMECJ
---Ali Asghar Pasbana* and Behrouz Nonahala a Research Institute of Petroleum Industry, Tehran, Iran
the pollution of the crude oil transportation route may also be somewhat effective. The presence of salts in crude oil in addition to corrosion causes the following problems.
During the production of crude oil, due to the minor evaporation of the associated water happens in the effect of pressure drop between the bottom and the top of the well, causing the chloride to settle sodium is at the entrance to the well wall and the diameter of the well decreases.
To cater for such issues, fresh water well is injected to the well. In refineries, the existence of salt along with other factors such as wax and asphaltene causes the formation of deposits inside the exchanger tubes.
The Investigation of precision of analytical methods for
determination of salt content in Iranian crude oils
1. Introduction
Existing salt content in crude oils can lead to serious problems during petroleum production, refining process, transportation, and also some related chemical and petroleum engineering processes. [1]. Sodium, magnesium, and calcium chlorides are almost always present in crude oils. Moreover, calcium cement and calcium carbonate should also be mentioned. The amount of mineral salts in crude oil depends on the formation pattern of crude oil and can reach up to 200000 ppm [2-3]. In addition,
* Corresponding author email: [email protected]
https://doi.org/10.24200/amecj.v1.i01.33
A R T I C L E I N F O: Received 20 Aug 2018 Revised form 24 Oct 2018 Accepted 30 Oct 2018 Available online 31 Oct 2018
Keywords: Salt content crude oil
electrometric method extraction
volumetric titration
A B S T R A C T
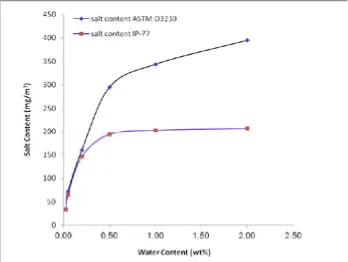
In crude oil analysis, the determination of salt content is one of the most important parameters especially for refining and exporting industries. In this study, extraction followed by volumetric titration and electrometric procedure are performed for determining salt content for several Iranian crude oils. Also, the effects of disturbing agents such as increasing associated water for determining salt in crude oil were investigated for both methods. The results show when water content in crude oil is less than 0.05 weight percent, both methods are equally accurate for determining salt content, but when there is an increase in associated water content in crude oil, the electrometric method followed by volumetric titration method shows more accurate results in comparison with the extraction procedure.
Analytical methods in salt of crude oils; Ali Asghar Pasban, et al
Consequently, the formation of deposits inside the exchanger tubes reduces the heat transfer; moreover, the formation of deposits (or sedimentation) in furnace tubes will produce coke [4].
Also, the presence of water and salt in some crudes and heavy crudes will cause an increase in the acidity number. In order to control and reduce the effect of water and salt on the acidity number, water washing process (dehydration) is employed prior to the desalter unit [5-7].
In order to control the corrosion caused by salt, its content should be less than 4 ppm or 2 pounds in 1000 bpd of the crude oil [8]. In crude oil sales contracts, salt content is one of the important parameters whose permissible amount is mentioned in the contract, and the seller is obliged to control it when producing and exporting. Therefore, in the laboratory of exporting terminals, the salt content is determined, and if it exceeds the permissible limit, the cargo will not be shipped to the oil tanker. Also, if the buyer finds a discrepancy in the amount of salt received, inform the seller should be informed. Moreover, if the buyer’s claim is confirmed, the seller will be obligated to pay compensation on the basis of the contract. It should be noted that a salt content increase in crude oil exports could be detrimental to the reputation of the exporting company in the oil market.
With reference to the above, standard salt content determination during production, transportation, storage, and exportation to a petroleum company are important. Crude oil producing company has to control this parameter in equipped laboratories. Oil companies can monitor the amount of salt along with other key parameters such as API grade, water and sediment, hydrogen sulfide, and sulfur on a daily basis [10-11]. In addition to controlling the quality of production of its subsidiaries, they can well defend the interests of participating in necessary situations and avoid unnecessary losses as much as possible. The National Iranian Oil Company (NIOC) has also created a hardware infrastructure and the necessary software in this field, and its experts try to carry out the necessary research and update the present standards. They use the best internationally accepted
methods to control the quality of crude oil exports. For the time being, many of the production areas and exporting terminals use extraction and volumetric titration methods. Also, recently, it was stipulated or stated that volumetric titration method should be gradually replaced by the electrometric method. The purpose of this research is to study the current methods of salt determination in petroleum laboratories and investigate comparative advantages and disadvantages of each method in conjunction with the project performed on “Salt content determination of Iran’s crude oils at the Research Institute of Petroleum Industry in 2018”.
2. Experimental Procedure
2.1. Material and Methods
In the laboratory investigation, crude oils with different characteristics for salt determination were selected to obtain a better comparison of the performance of standard methods at different conditions.
For this purpose, 6 samples of crude oils produced by National Iranian South Oil Company (NISOC) were selected. NISOC is regarded as one of the largest crude oil producers in the world and produces 85 percent of crude oil in Iran. The specifications of selected crudes are shown in Table 1.
25 Analytical methods in salt of crude oils; Ali Asghar Pasban, et al
based on the ASTM D6560 which is equivalent to the standard IP 143 [15].
Also, a titration apparatus manufactured by Metrohm (805 Titrando model ) is used to determine the estimate the effect of salt on the acidity number of the selected crudes. Moreover, the titration apparatus manufactured by Metrohm is equipped with a combination of a silver glass electrode and silver chloride (Ag/AgCl) as reference electrode surrounded by the same electrode [16].
The acidity number is the amount of consumed hydroxides for neutralization of one gram of sample mgKOH/gram oil. The results obtained in this study showed that the crude oils used in this study had low acidity numbers and did not cause much disorder in the performance of desalting units [17].
2.2. Salt content determination by standard method IP 77
In this method, salt content in the crude oil is separated by a glass system manufactured by Petrotest which is designed based on the standard IP 77 [14]. In this extraction method, the sample is heated by an electric heater in a glass flask with the volume of 55 cm3. About 155 ml of crude oil with 155 ml of distilled water are poured inside the flask. After mixing, 100 milligrams of toluene and then 20 ml of acetone were added to the mixture. The flask is heated by the electric heater to the boiling point of the mixture, and the resulting vapors are cooled and returned to the flask by a vertical condenser mounted on top of the flask. This operation lasts for at least 45 minutes. To make sure that full salt extraction can be performed at a greater time. After completion of the extraction stage, the contents of the cooled water phases and organics are separated
and discharged through the valve embedded under the flask, and then the water phase is separated, and chlorine ion content in the water phase is neutralized by a mohair volumetric titration method. In this way, by using normal 0.01 silver nitrate, chloride ions are titrated in the presence of a few drops of potassium dichromate solution with a concentration of 50 gram. At the end of the neutralization of chlorine ions, the ambient color changes from yellow to light red. In this way, the concentration of chlorine ion is obtained in milligrams per cubic meter from Equation 1.
X = [VA/(V1-VB/V2)].N.58500.VE/VS (1) where, VA is the volume of silver nitrate solution used for the titration extraction in ml, VB is the volume of silver nitrate used as the titration witness, V1 is the volume of consumed extraction used in titration, V2 is the volume used as witness in the titration process, VE is the total volume of the extract, VS is the sample volume of crude oil used, and N is the normality of the silver nitrate solution.
2.3. Salt content determination by ASTM method D3230
To determine salt content by the above method, a digital analyzer (694-SICT Model) is used which is manufactured by Kohler Corporation. This apparatus measures the electrical current passing through the crude oil solved in a beaker of solution mixture of alcohols with the aid of an electrode based on the electrometric measurement method [17]. With respect to standard calibration curve of the apparatus, the passing flow is reported in terms of Micro Siemens to milligrams which is directly converted to cubic meter and displayed on the monitor. The electrode used consists of two platinum
Table 1. The specification of crude oils.
Asphaltene wt.% Acidity No. mgKOH/gr
Water and Sediments Vol.% Water Vol.%
API Crude oil No.
plates with the dimensions of 25 mm × 50 mm which are placed in parallel facing each other.
The spacing between the plates is 2 mm, and the maintaining material which holds the plates next to each other is insulated. For calibration of the system, according to ASTM D3230, standardization of apparatus solution has been carried out through a mixture of alcohols that were diluted in a mixture of sodium, magnesium, and calcium solution chlorides of 70%, 20% and 10% respectively. The purpose of dilution is to prepare salts mixtures with a concentration of 0.1 g/m3. The mixture of alcohols contains 37 % vol. of pure ethanol in isobutanol, for any liter of which, 3ml of distilled water is added. At this stage, a quantity of about 10 ml of an oil cut like paraffin was thoroughly dissolved in 40 ml of an organic solvent such as Xylene. Then 50 ml of alcohol mixture was added to this mixture and severely stirred. Then the final solution was poured inside a clean beaker and its conductivity was measured. This result is in fact, the amount of conductivity of the control solution. Then to completely cover measuring range of the apparatus (0-430 mg/cm3), standard solutions were used to match the table presented in ASTM standard D-3230 containing 50 ml of solution of mixture of alcohols with a suitable amount of salt mixtures. During each step, the conductivity was recorded on the apparatus. In this way, there are about 10 points to plot the calibration curve.
After calibration of the apparatus, salt content of crude samples were determined. To do this, 10 ml of each crude oil sample was dissolved in an organic solution containing xylene and 50cc of alcohol mixtures. At this stage, the mixture was stirred for 90 seconds by hand. Then the sample remains constant for 5 minutes. Finally, the content was poured in the special beaker, and the salt content was measured.
3. results and discussion
Salt content of samples of crude oils were measured using extraction and volumetric method (IP 77). In addition, the electrical conductivity measurement method (ASTM D3230) reported in Table 1.
27 Analytical methods in salt of crude oils; Ali Asghar Pasban, et al
should be calculated and total salt amounts should be reported for desalting units, so, the technical section will be able to control the output salt content by optimizing of parameters in desalting unit.
4. Conclusions
In this study, the determination of salt content in crude oils was evaluated by two methods which was exported and transported to domestic Iranian refiners. This procedure, was carried out on six petroleum products, produced by NISOC (National Iranian Southern Oil Company) using extraction and volumetric methods by (IP 77) and ASTM method D 3230. The results show that the electrometric method has some advantages in comparison to the extraction method, outlined as follows:
a) With respect to the need for refiners the salt content of the crude oil as feed should be reduced to less than 3 ppm. For such scenarios, only the ASTM method D 3230 should be used because the lowest limit of measurement for the IP 77 method is about 20 ppm.
b) Due to the nature of the IP 77 method, only chlorine ions in crude oil can be measured and, in the case of presence of salts in the form of sulfates or bicarbonates in the crude oil, these compounds cannot be calculated. Therefore, the total salt content
of crude oil cannot be determined by this method. c) In the electrometric method, a smaller sample volume is needed compared to the time-consuming extraction method.
d) Repeatability and reproducibility of the results in the electrometric method are better than the extraction method and volumetric analysis.
e) It is recommended that the electrometric method for determining salt content be used when the amount of water in the crude oil is high. Therefore, in this method, the passing flow through the medium is used. Moreover, in this method, the concentration of total ions can be calculated, and thus a more accurate calculation of the inorganic salts can be achieved. This method also helps the utilization of optimized operation of existing oil installations against damages inflicted from corrosion and sediments.
5. Acknowledgments
The authors would like to thank National Iranian South Oilfield Company’s staffs for their contributions and guidance during the course of this research.
6. Refrences
[1] A. Kamari, A.Bahadori, and A.H.Mohammadi, On the Determination of Crude Oils Salt Content: Application of Robust Modeling Approaches, J. Taiwan Institute Chem. Eng., 44(2015)27-35. [2] A.A. Pasban, S. Sadeghpour, M. Masoumi, and
A.A.Miran Beigi, Acidity removal of Iranian heavy crude oils by nanofluid demulsifier: An experimental investigation, NanoAnalysis, 04 (2017) 112-118. [3] E. Elhaddad and M.E. Abdel-Raouf, New Model to
Eliminate Salts from Sarir Crude Oil: a Case Study, Int. J. Eng. Res. Sci. Technol., 2 (2013)182-189. Crude Sample
No. Chlorine Ion (mg dm
-3)
IP 77 Salt (mg dm
-3) ASTM D3230 1 2 3 4 5 6
33±2 65±1 146±5 194±7 203±6 207±12
34±1 72±3 160±2 295±5 344±4 395±9 Table 2. The results of salt determination in crude oils.
Sample
[4] U.B. Deshannavar, M.S,Rafeen, M.Ramasamy, and D,Subbarao, Crude oil Fouling:A Review, J. Appl. Sci., 10 (2010) 3167-3174.
[5] J.J. Sheng, Investigation of alkalineecrude oil reaction, Petroleum, 1 (2015) 31-39.
[6] C. Soltelo, A.Favela-Contreras,D. Sotelo,F. Beltran-Carajal, E.Cruz, Control Structure Design for Crude Oil Quality Improvement in a Dehydration and Desalting Process, Arab. J. Sci. Eng., 43 (2018) 6579-6594.
[7] H. Kiani, Study of a crude oil desalting plant of the national Iranian south oil company in Gachsaran by using artificial neural networks, Chem. Mol. Nucl. Mater. Metall. Eng., 7(12), (2013) 670–673.
[8] H.K Abdel-Aal., M.Aggour,M.A.Fahim,Petroleum and gas field processing, ASTM International, CRC Press, Florida, 2015.
[9] M.R Riazi-Aal., S.Eser, S.S. Agrawal, and J.L.Pena Diez, Petroleum refining and natural gas processing, 2nd ed., Taylor and francis, PA, USA, 2013.
[10] W. Y. Ayele, G. Juell-Skielse, A. Hjalmarsson, P. Johannesson, method for designing and refining digital Innovation contest measurement model, An Int. J. Inform. Technol., 11 (2018 ) 25-53.
[11] ASTM D4006, Standard test method for water
content in crude oil by distillation, Annual Book of ASTM standards, 05.01, USA, 2017.
[12] ASTM D4007, Standard test method for water and sediment in crude oil by centrifuge method, Annual Book of ASTM standards, 05.01, USA, 2017. [13] ASTM D4007, Standard test method for water
content in crude oil by potentiometric Karl Fischer method, Annual Book of ASTM standards, 05.01, USA, 2017.
[14] IP 77, Determination of salt content- extraction and volumetric method, 2015.
[15] ASTM D3230, Standard test method for salts in crude oil (electrometric method) Annual Book of ASTM standards, USA, 05.01, 2017.
[16] ASTM D6560, Standard test method for determination of asphaltenes (heptanes insoluble) in crude petroleum and petroleum products, Annual Book of ASTM standards, USA, 05.02, 2017. [17] ASTM D664, Standard test method for acid number
of petroleum products by potentiometric titration, Annual Book of ASTM standards, USA, 05.01, 2017.
Research Article, Issue 1
Analytical Methods in Environmental Chemistry Journal Journal home page: www.amecj.com/ir
AMECJ
---Amir Vahida*, Majid Abdousb, and Shahnaz Nayyerib a Research institute of petroleum industry, Tehran, Iran.
b Faculty of chemistry, Amirkabir University of Technology, Tehran, Iran.
at the center [5, 6].
One of the most important applications of MPCS has been in catalysis, including large-scale industrial processes. For instance, the Merox process, referred to as “sweetening” in the petroleum refining industry, involves catalytic oxidation of mercaptans in the presence of sulfonated cobalt phthalocyanines to remove a major part of sulfur from petrol [7]. The catalytic properties of MPCS depend on the metal and complex structure and can be tuned by appropriate structural modifications [8, 9]. This is the basis of the redox mechanism of catalytic oxidation of sulfur-containing compound.
Investigation of Adsorption of Cobalt-phthalocyanine from
Aqueous Waste Stream Using UVM-7/Ag
1. Introduction
Mercaptan and sulfur compounds present in the crude oil and petroleum cuts cause corrosion of pipes and different environmental pollutions[1]. There are various methods to remove mercaptan but the major one is the catalytic oxidation in the presence of caustic solution and air. phthalocyanine are effective catalysts for thiol and hydrosulfide oxidation by dioxygen[2-4]. Metal phthalocyanines (MPCS) are two dimensional (2D) organic macro cyclic molecular catalysts (MN4) with metal atoms
*Corresponding Author Email: [email protected]
https://doi.org/10.24200/amecj.v1.i01.34
A R T I C L E I N F O: Received 20 Aug 2018 Revised form 24 Oct 2018 Accepted 30 Oct 2018 Available online 31 Oct 2018
Keywords:
Adsorption
Aqueous
Dye
Isotherm
Mesoporous silica
Kinetics
A B S T R A C T
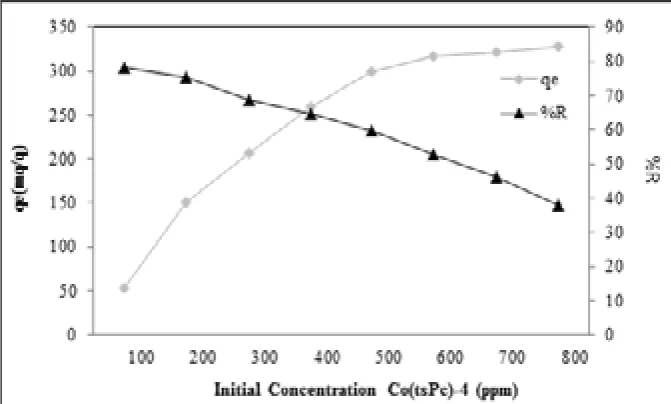
The effect adsorption of cobalt-phthalocyanine-3,4’,4”,4”’-tetrasulfonicacid tetrasodium salt [Co(tsPc)-4•4Na+] onto UVM-7/Ag mesoporous material was investigated. In addition, X-ray diffraction (XRD), scanning electron microscopy (SEM), and nitrogen adsorption-desorption measurement were used to examine the morphology and the microstructure of the obtained composite. Various parameters including solution adsorbent dosage, contact time, initial dye concentration and temperature were systematically studied. Equilibrium data fitted well the Langmuir models; moreover, the fitness suggests that the adsorption be monolayer and physical in nature. Kinetic studies showed that the adsorption process could be better described by the Lagergren pseudo-second-order models. Thermodynamic constant values (∆G < 0, ∆H< 0 and ∆S< 0) demonstrated that the adsorption reactions of Co(tspc)-4
onto UVM-7/Ag were feasible, spontaneous, and exothermic under the examined conditions.
Adsorption of cobalt-phthalocyanine by UVM-7/Ag; Amir Vahid, et al
These catalysts have found wide application in the catalytic oxidation of mercaptans in oil fraction as shown if Figure 1 [10].
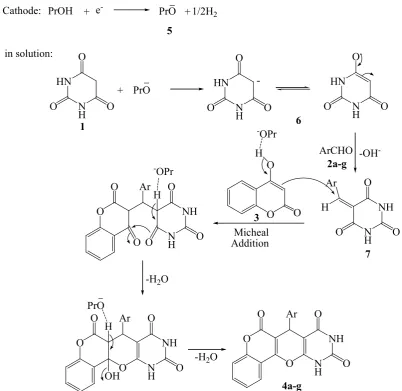
In many systems using transition metal compounds as catalysts, the mechanism suggested by Wallace et al.[11] is:
RSH + NaOH → RS- + H 2O RS- + CO+3 → CO+2 + RS●
2RS● → RSSR
O 2_2 + H
2O → 2OH- + 1/2 O2
CoPC has a low solubility in water , the substitution of CoPc with hydrophilic sulfonic groups [Co(tsPc)-4]
as shown if Figure 2, makes this derivative easily soluble in aqueous solution. sulfonated metal phthalocyanine (MSPC) complexes, highly water-soluble molecule and very well recognized for its unique physicochemical properties and wide range of applications ranging from catalysis to sensing and photocatalysis .
The Merox catalyst is a heterogeneous blue powder dissolved in water.
Merox catalyst of caustic solution creates problems that in this work, co (II) tetra sulfophthalo cyanine Co(TSPc)-4 catalyst removal from caustic solutions by using meso porous silica UVM-7 is studied. Functionalized with Ag and , γ-Alumina was prepared by sol-gel method and the synthesized nanoparticle was characterized by scanning electron microscopy (SEM) and X-ray diffraction (XRD).
Mesoporous materials can have large adsorption capacity, excellent selectivity and improved powder recoverability for removal of toxic compounds from aqueous solutions[12, 13]. The effects of adsorbent dosage, initial Co(tspc)-4 concentration and contact time were studied. The adsorption was fit to different adsorption isotherms and also to kinetics of the adsorption was studied. Parameters affecting the removal of Co(tspc)-4 from the aqueous solution was investigated and validated by Fig. 1. Schematic representation of Merox unit.