Performance of Selected Shares with Reference to Its
IPO Grading
Aabha S. Singhvi
Research scholar at PAHER, Udaipur Assistant. Professor
GIDC Rajju Shroff ROFEL Institute of Management Studies, Vapi
Ajit Patel
MBA Finance
Owner of H2A Enterprises, Vapi
ABSTRACT
An IPO is an invitation to ask investors to subscribe in their company. IPO grading is important and complex. According to SEBI it is important to grade an IPO before going for it. It was introduced on May 1st,2007 by SEBI. It is believed that the one with high rating has better performance. So this is a study to study the performance of IPO with reference to its IPO grade, this can help the investors in taking decision at the time of IPO. It becomes important to study the relationship between the IPO grading and other factors. The data has been collected of 283 companies for a period of five years from 2010 to 2015. Only those IPOs were selected that were graded by one of the rating agencies. The result is that there is no impact of grading done by institutions.
1. SEBI’s VIEW
SEBI believes that its primary role as a regulatory body is to safeguard the investors interest by disclosing the details of the firms who come for IPO offers and want funding from the equity market. India is one of the countries with transparency and efficient market in the world. Most of the investors do not read the prospectus. Hence SEBI believes that it is important to rate the equity offerings.
SEBI has the following grading agencies like CARE, CRISIL, ICRA.
♦
Credit Analysis & Research Ltd (CARE)♦
Credit Rating Information Services of India Limited (CRISIL)♦
ICRA LimitedThe issuing company then discloses the IPO grade on the prospectus that it files with the RoC (Registrar of Companies). Please see Exhibit 1 for an example of a prospectus with a disclosed IPO grade.
2. LITERATURE REVIEW
Alex A. A. Bruce and P. M. C. Thilakaratne, (2014), The researcher was trying to explain in this study that the IPOs performance volatility is inevitable as far as a real efficient market.
Bagher Shamszadeh Arezo Bakhtiari, (December 2015), In this study researcher studied the earnings management in the initial public offerings of corporate shares at Tehran Stock Exchange (TSE). The researcher used a sample of 47 companies listed on TSE from 2000 to 2009. The results showed that the manipulation was done before the admission to the Stock exchange.
Ishwara. P, (2012),Researcher examine at the performance of IPOs, 74 % of the total of 222 listed from 1-4-2007 to 31-3-2010 were trading below their issue price. So post performance of IPO was done. Almost 93% and above issues in 2010 were below their issue price. The study result shows that Issues with Grade 4 yielded high losses compared to other low grades. When on the listing day the issues with Grade 1 and Grade 3 proved to be beneficial to the investors marginally. Grade 2 and Grade 4 issues resulted in losses.
Djerbi Chiraz and Jarboui Anis, (2013), here the study of current accruals on the performance of French IPO companies has been done. It was a sample of 139 French IPO over the period of 1999 to 2007 which includes 38 failures. No evidence was found relating to the initial return being negatively related to current accruals.
Mani Jindal, (March 2016), The Initial Public Offering is the sale of shares to the public for the first time through stock exchanges. This research was done to analyze the IPO pricing performance from the first day of listing to different time frames short run and long run conducted during 2011 to 2013. The sample of 59 IPOs were taken for analyses whether it is overpriced and underpriced. To achieve the objective of this study, returns level, beta and three models were used to find out the return and risk simultaneously. The beta was also used to evaluate the risk measurement. The three measures were Sharpe‟s, Treynor‟s and Jensen‟s measures. It found that from the IPOs return calculations that the IPOs has underperformed.
Yakup Ergincan, Fatih Kiraz, (2016), This study examines that most of the 60 BIST (Borsa Istanbul) listed large industrial firms in this study have improved their relative ranks after their IPOs and when compared to their own large competitors most of which are not listed in BIST. These ranks are available in the Turkey’s TOP 1.000 Industrial Enterprises annual lists and they are officially assigned by the ICI (Istanbul Chamber of Industry) according to firms‟ sales revenue figures. Thus, they provide us with the single and clear window to observe.
PROBLEM STATEMENT
An IPO is the financial instrument by which a company offers stocks to the general public to
formally becomes a publicly traded company. As per SEBI
‟
s requirement, a company
planning to get its issue graded before offering it to the general public. IPO grading shows the
fundamentals of IPOs and contains five point scales ranging from 1 to 5. This scale shows
score indicating stronger or weaker fundamentals of company which is going for IPO.
3. RATIONAL OF THE STUDY
4. RESEARCH VARIABLES
Dependent Variables:
LIQUIDITY – Turnover Ratio
UNDERPRICE – Initial Excess Return PERFORM – Price performance of Issue Independent Variables
IPO‐GRADE‐IPO Grade
ISSUE SIZE – IPO issue size in Rs. Crore (Rs. 10 million)
PRICE TO BOOK – Price to book ratio (Ratio of listed share price to book value of share reported in the company balance sheet)
5.RESEARCH OBJECTIVES AND HYPOTHESIS FOR CORRELATION & REGRESSION
Table 1: FOR Under-Pricing
Objectives Null Hypothesis Alternative Hypothesis
1. To study the relationship between IPO-Grade, Issue Size and
Price to Book on Under-Pricing of shares.
H0: There is no significant relationship between
IPO- Grade, Issue Size and Price to
Book on
Under-Pricing of shares.
H1: There is significant relationship between IPO-Grade, Issue Size and Price to Book on Under-Pricing of shares.
2. To study the significant impact between IPO-Grade, Issue Size
and Price to Book on Under-Pricing of shares.
H0: There is no significant impact between IPO-Grade, Issue Size and Price to Book on Under-Pricing of shares.
H1: There is significant impact between IPO-Grade, Issue Size and
Price to Book On Under-Pricing of shares.
Model 2: For Price-Performance
Objectives Null Hypothesis Alternative Hypothesis
1. To study the relationship between Ipo-Grade, Issue Size and
Price to Book on Price-Performance of IPO Scrpits.
H0: There is no significant
relationship between Ipo-Grade, Issue Size and PricetoBook
on Price-Performance of IPO Scrpits.
H1: There is significant relationship between Ipo- Grade, Issue Size And Price to Book on Price-Performance of IPO Scrpits.
2. To study the significant impact between Ipo-Grade , Issue Size
and PricetoBook on Price-Performance of IPO Scrpits.
H0: There is no significant impact between Ipo-Grade , Issue Size and PricetoBook on Price-Performance of IPO Scrpits.
H1: There is significant impact between Ipo - Grade , Issue Size
and PricetoBook on Price-Performance of IPO Scrpits.
6. RESEARCH DESIGN
Sampling Design
In this study we have included all data of those companies which have issued its IPO through book building method from year 2010 to 2016 (103 companies).
Data collection method
Secondary method
Data collection Instrument
Company websites
Data analysis tool
Correlation and Regression
Correlation
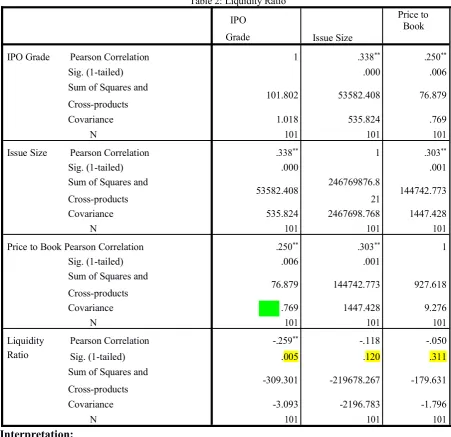
Table 2: Liquidity Ratio IPO
Grade Issue Size
Price to Book
IPO Grade Pearson Correlation 1 .338** .250**
Sig. (1-tailed) .000 .006
Sum of Squares and
Cross-products 101.802 53582.408 76.879
Covariance 1.018 535.824 .769
N 101 101 101
Issue Size Pearson Correlation .338** 1 .303**
Sig. (1-tailed) .000 .001
Sum of Squares and
Cross-products 53582.408
246769876.8
21 144742.773
Covariance 535.824 2467698.768 1447.428
N 101 101 101
Price to Book Pearson Correlation .250** .303** 1
Sig. (1-tailed) .006 .001
Sum of Squares and
Cross-products 76.879 144742.773 927.618
Covariance .769 1447.428 9.276
N 101 101 101
Liquidity Pearson Correlation -.259** -.118 -.050
Ratio Sig. (1-tailed) .005 .120 .311
Sum of Squares and
Cross-products -309.301 -219678.267 -179.631
Covariance -3.093 -2196.783 -1.796
N 101 101 101
Interpretation:
➢
There is no significant relationship between liquidity ratio and price to book,
issue size so hypothesis H0 is accepted.
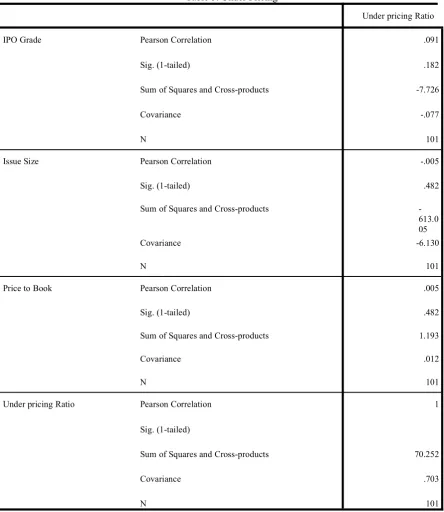
Table 3: Under Pricing
Under pricing Ratio
IPO Grade Pearson Correlation .091
Sig. (1-tailed) .182
Sum of Squares and Cross-products -7.726
Covariance -.077
N 101
Issue Size Pearson Correlation -.005
Sig. (1-tailed) .482
Sum of Squares and Cross-products
-613.0 05
Covariance -6.130
N 101
Price to Book Pearson Correlation .005
Sig. (1-tailed) .482
Sum of Squares and Cross-products 1.193
Covariance .012
N 101
Under pricing Ratio Pearson Correlation 1
Sig. (1-tailed)
Sum of Squares and Cross-products 70.252
Covariance .703
N 101
Interpretation
➢
There is no relationship between underpricing, IPO grade, issue size and price to
book.
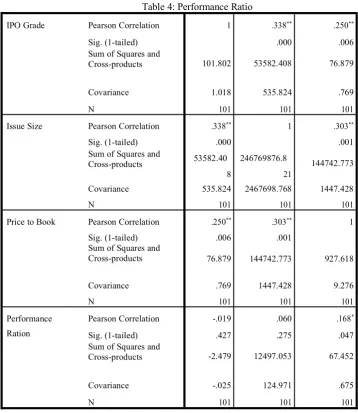
Table 4: Performance Ratio
IPO Grade Pearson Correlation 1 .338** .250**
Sig. (1-tailed) .000 .006
Sum of Squares and
Cross-products 101.802 53582.408 76.879
Covariance 1.018 535.824 .769
N 101 101 101
Issue Size Pearson Correlation .338** 1 .303**
Sig. (1-tailed) .000 .001
Sum of Squares and
Cross-products 53582.40 8
246769876.8
21 144742.773 Covariance 535.824 2467698.768 1447.428
N 101 101 101
Price to Book Pearson Correlation .250** .303** 1
Sig. (1-tailed) .006 .001
Sum of Squares and
Cross-products 76.879 144742.773 927.618
Covariance .769 1447.428 9.276
N 101 101 101
Performance Pearson Correlation -.019 .060 .168*
Ration Sig. (1-tailed) .427 .275 .047
Sum of Squares and
Cross-products -2.479 12497.053 67.452
Covariance -.025 124.971 .675
N 101 101 101
Interpretation
➢
There is no relationship between IPO grade and performance ratio so hypothesis
Ho is accepted.
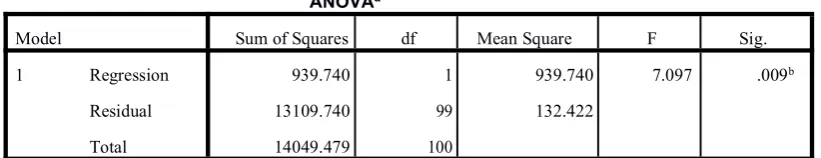
7. REGRESSION ANALYSIS
Table 5: IPO Grade on Liquidity Ratio
ANOVAa
Model Sum of Squares df Mean Square F Sig.
1 Regression 939.740 1 939.740 7.097 .009b
Residual 13109.740 99 132.422
Total 14049.479 100
Table 6:Price to Book On Performance Ratio
Regression
Model Summary ANOVA
Model Sum of Squares df Mean Square F Sig.
1 Regression 5.225 1 5.225 3.092 .082b
Residual 169.007 100 1.690
Total 174.232 101
8. FINDINGS
•
The coefficient associated with IPO grade has an negative sign, so on that basis it can be conclude that IPO grade is negatively(strongly) correlated with liquidity ratio. However there may be negative relation between them because of high grade could allow companies to demand a better premium which adversely reducing the demand in the market.•
There is a positive relation between IPO grade and under pricing ratio. From result it can be conclude that higher the grade, higher will be under pricing ratio. Reason may be because of high grade, demand for the shares of that company high which increases the listing price and result in under pricing of shares. Another reason may be companies are unable to predict what investors are ready to pay for shares issued by them.•
IPO grade has negative correlation with price performance ratio. Here price performance ratio is calculated on the basis of price of share after 30 days of listing. From negative correlation, it may be conclude that higher IPO grade will result in negative after 30 days of listing.•
Issue size has negative correlation with Price performance ratio which means when the Issue size is large, price performance ratio is not much good as when issue size is small. When IPO size is large, Price performance ratio is poor and vice-versa.•
As the IPO grade does not recommend whether to buy, sell or hold the securities, it might not be appropriate drawing a correlation between the grade and the market performance of the securities.9. CONCLUSION
agencies to company before an issue of IPO are not that much of sufficient to predict future performance of stocks or shares one can measure liquidity of based upon IPO grading but not performance of shares. It is not that much good for investors to take decision on basis of IPO grade of new company.
10. BIBLIOGRAPHY
1. Alberto dell’acqua, Emanuele Tetia (2015) IPO Underpricing and aftermarket performance in Italy, Journal of Economic & Financial Studies, 03(03), 1-14
3. Ambily, Gayatri Krishna, Aswathy K and Deepa Balakrishnan, A study on Performance of Ipo’s under NSE from issue price to last trading price in the year 2013-2015, Global Journal of Finance and Management. ISSN 0975-6477 Volume 8, Number 1 (2016), pp. 43-48 © Research India Publications
http://www.ripublication.com
3. Aharony, J., C.J. Lin and M.P. Loeb. (1993). “Initial public offerings, accounting choices and earnings management.” Contemporary Accounting Research 10(1):pp.61-81.
4. Armstrong, C.S., Foster, G. and Taylor, D.J., (2009). Earnings Management around Initial Public Offerings: Working paper, available atSSRN:http://ssrn.com/abstract=1147328
5. Bagher Shamszadeh, Earnings Management and Initial Public Offerings (IPOs) at Tehran Stock Exchange (TSE), ISSN 2039-9340, Vol 6 No 6 S6
6. Copeland, R.M. (1968) Income smoothing. Journal of accounting Research, Empirical Research in Accounting, Selected Studies
7. Noravesh, Iraj. Sepasi, S. and Nikbakht, MR.(2005) "Earnings management at companies listed in Tehran Stock Exchange" Journal of Humanities and Social Sciences, University of Shiraz (43)
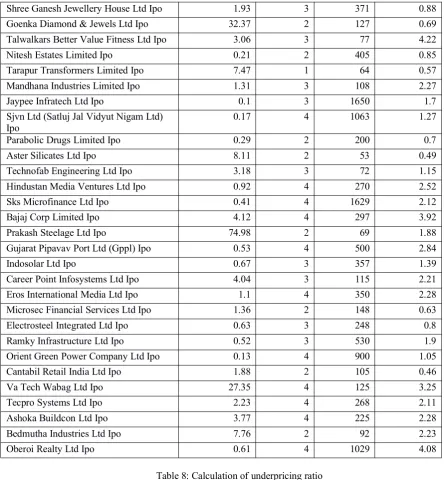
Table 7: Annexure
Issuer Company(2010-2016) Liquid ratio IPO grade Issue
Size PRICETO
BOOK
Infinite Computer Solutions India Ltd Ipo 1.42 2 190 2.49
Jubilant Foodworks Ltd Ipo 1.4 3 329 18.16
Aqua Logistics Ltd Ipo 27.56 3 150 1.01
Thangamayil Jewellery Limited Ipo 2.25 3 29 2.25
Syncom Healthcare Limited Ipo 3.48 2 56 0.74
Vascon Engineers Limited Ipo 0.55 3 178 1.14
D B Realty Limited Ipo 0.65 2 1500 0.86
Emmbi Polyarns Limited Ipo 6.6 2 39 0.46
Arss Infrastructure Projects Ltd Ipo 5.03 2 103 1.75
Hathway Cable & Datacom Ltd Ipo 1.13 3 666 1.65
Texmo Pipes & Products Ltd Ipo 6.74 2 45 0.58
Man Infraconstruction Ltd Ipo 14.67 3 142 1.41
United Bank Of India Ipo 0.57 3 325 1.03
Pradip Overseas Limited Ipo 2.21 2 117 0.89
Shree Ganesh Jewellery House Ltd Ipo 1.93 3 371 0.88
Goenka Diamond & Jewels Ltd Ipo 32.37 2 127 0.69
Talwalkars Better Value Fitness Ltd Ipo 3.06 3 77 4.22
Nitesh Estates Limited Ipo 0.21 2 405 0.85
Tarapur Transformers Limited Ipo 7.47 1 64 0.57
Mandhana Industries Limited Ipo 1.31 3 108 2.27
Jaypee Infratech Ltd Ipo 0.1 3 1650 1.7
Sjvn Ltd (Satluj Jal Vidyut Nigam Ltd)
Ipo 0.17 4 1063 1.27
Parabolic Drugs Limited Ipo 0.29 2 200 0.7
Aster Silicates Ltd Ipo 8.11 2 53 0.49
Technofab Engineering Ltd Ipo 3.18 3 72 1.15
Hindustan Media Ventures Ltd Ipo 0.92 4 270 2.52
Sks Microfinance Ltd Ipo 0.41 4 1629 2.12
Bajaj Corp Limited Ipo 4.12 4 297 3.92
Prakash Steelage Ltd Ipo 74.98 2 69 1.88
Gujarat Pipavav Port Ltd (Gppl) Ipo 0.53 4 500 2.84
Indosolar Ltd Ipo 0.67 3 357 1.39
Career Point Infosystems Ltd Ipo 4.04 3 115 2.21
Eros International Media Ltd Ipo 1.1 4 350 2.28
Microsec Financial Services Ltd Ipo 1.36 2 148 0.63
Electrosteel Integrated Ltd Ipo 0.63 3 248 0.8
Ramky Infrastructure Ltd Ipo 0.52 3 530 1.9
Orient Green Power Company Ltd Ipo 0.13 4 900 1.05
Cantabil Retail India Ltd Ipo 1.88 2 105 0.46
Va Tech Wabag Ltd Ipo 27.35 4 125 3.25
Tecpro Systems Ltd Ipo 2.23 4 268 2.11
Ashoka Buildcon Ltd Ipo 3.77 4 225 2.28
Bedmutha Industries Ltd Ipo 7.76 2 92 2.23
Oberoi Realty Ltd Ipo 0.61 4 1029 4.08
Table 8: Calculation of underpricing ratio
Issuer Company(2010-2016) Un
der pric ing Rat io
IPO
grade IssueSize PRICETO BOOK
Infinite Computer Solutions India Ltd 0.092 2 190 2.49
Jubilant Foodworks Ltd Ipo 0.103 3 329 18.16
Aqua Logistics Ltd Ipo 0.025 3 150 1.01
Thangamayil Jewellery Limited Ipo -0.075 3 29 2.25
Syncom Healthcare Limited Ipo 0.138 2 56 0.74
Vascon Engineers Limited Ipo 0.02 3 178 1.14
D B Realty Limited Ipo -0.033 2 1500 0.86
Emmbi Polyarns Limited Ipo 0.013 2 39 0.46
Hathway Cable & Datacom Ltd Ipo 0.024 3 666 1.65
Texmo Pipes & Products Ltd Ipo 0.115 2 45 0.58
Man Infraconstruction Ltd Ipo 0.252 3 142 1.41
United Bank Of India Ipo 0.144 3 325 1.03
Pradip Overseas Limited Ipo 0.097 2 117 0.89
Il&Fs Transportation Networks Ltd Ipo 0.095 4 700 2.56
Persistent Systems Limited Ipo 0.225 4 168 1.97
Shree Ganesh Jewellery House Ltd Ipo 0.008 3 371 0.88
Goenka Diamond & Jewels Ltd Ipo -0.042 2 127 0.69
Talwalkars Better Value Fitness Ltd Ipo 0.103 3 77 4.22
Nitesh Estates Limited Ipo -0.083 2 405 0.85
Tarapur Transformers Limited Ipo 0.004 1 64 0.57
Mandhana Industries Limited Ipo -0.048 3 108 2.27
Jaypee Infratech Ltd Ipo -0.089 3 1650 1.7
Sjvn Ltd (Satluj Jal Vidyut Nigam Ltd) Ipo 0.078 4 1063 1.27
Parabolic Drugs Limited Ipo 0.003 2 200 0.7
Aster Silicates Ltd Ipo 0.069 2 53 0.49
Technofab Engineering Ltd Ipo 0.097 3 72 1.15
Hindustan Media Ventures Ltd Ipo 0.029 4 270 2.52
Sks Microfinance Ltd Ipo 0.171 4 1629 2.12
Bajaj Corp Limited Ipo 0.043 4 297 3.92
Prakash Steelage Ltd Ipo 0.106 2 69 1.88
Gujarat Pipavav Port Ltd (Gppl) Ipo -8.282 4 500 2.84
Indosolar Ltd Ipo 0.189 3 357 1.39
Career Point Infosystems Ltd Ipo 0.019 3 115 2.21
Eros International Media Ltd Ipo 0.332 4 350 2.28
Microsec Financial Services Ltd Ipo 0.184 2 148 0.63
Electrosteel Integrated Ltd Ipo 0.124 3 248 0.8
Ramky Infrastructure Ltd Ipo 0.107 3 530 1.9
Orient Green Power Company Ltd Ipo -0.002 4 900 1.05
Cantabil Retail India Ltd Ipo -0.031 2 105 0.46
Va Tech Wabag Ltd Ipo -0.017 4 125 3.25
Tecpro Systems Ltd Ipo 0.231 4 268 2.11
Ashoka Buildcon Ltd Ipo 0.104 4 225 2.28
Bedmutha Industries Ltd Ipo 0.019 2 92 2.23
Oberoi Realty Ltd Ipo 0.098 4 1029 4.08
Prestige Estates Projects Ltd Ipo 0.069 3 1200 2.01
Gyscoal Alloys Ltd Ipo 0.026 2 55 0.26
Coal India Limited Ipo 0.062 5 15199 12.31
Gravita India Ltd Ipo 0.162 3 45 8.18
Rpp Infra Projects Ltd Ipo 0.403 2 49 1.83
Claris Lifesciences Limited Ipo -0.003 3 300 0.77
A2Z Maintenance & Engineering
Services Ltd -0.002 4 675 1.82
Punjab & Sind Bank Ipo -0.028 4 471 0.67
C Mahendra Exports Ltd Ipo 0.184 2 165 2.65
Omkar Speciality Chemicals Ltd 0.017 3 79 1.1
Sudar Garments Ltd Ipo 0.02 1 70 1.1
Acropetal Technologies Ltd Ipo -0.04 3 170 0.19
Lovable Lingeries Ltd Ipo -0.045 3 93 3.78
Ptc India Financial Services Ltd Ipo 0.302 3 439 0.8
Shilpi Cable Technologies Ltd Ipo 0.22 1 56 0.28
Muthoot Finance Ltd Ipo 0.006 4 901 1.61
Paramount Printpackaging Ltd Ipo 0.112 2 46 0.25
Future Ventures India Ltd Ipo 0.04 3 750 0.86
Innoventive Industries Ltd Ipo -0.005 3 220 1.53
Servalakshmi Paper Ltd Ipo -0.055 2 60 5.05
Vaswani Industries Ltd Ipo -0.055 2 115 0.23
Sanghvi Forging & Engineering Ltd Ipo 0.023 3 37 1.08
Timbor Home Limited Ipo -0.446 1 23 0.59
Rushil Decor Ltd Ipo -0.015 2 41 4.31
Readymade Steel India Ltd Ipo 0.119 2 35 1.74
Bharatiya Global Infomedia Ltd Ipo 0.026 2 55 0.12
Inventure Growth & Securities Ltd Ipo 0.13 2 82 4.07
L&T Finance Holdings Limited Ipo 0.019 5 1245 2.47
Tree House Education & Accessories Ltd Ipo 0 3 114 2.79
Brooks Laboratories Ltd Ipo -0.044 2 63 0.29
Srs Limited Ipo -0.036 3 203 0.79
Td Power Systems Ltd Ipo 0.093 4 227 1.98
Pg Electroplast Limited Ipo -0.061 3 121 2.31
Prakash Constrowell Ltd Ipo -0.015 2 60 1.32
Rdb Rasayans Ltd Ipo -0.06 2 36 0.33
Onelife Capital Advisors Ltd Ipo 0.035 1 37 8.8
Taksheel Solutions Ltd Ipo 0.071 2 83 0.12
Flexituff International Ltd Ipo 0.035 3 105 1.93
Indo Thai Securities Limited Ipo 0.056 2 30 0.29
Multi Commodity Exchange Of India Ltd Ipo -0.008 5 663 3.68
Olympic Cards Ltd Ipo -0.057 1 25 2.57
National Buildings Construction
Corporation 0.074 4 127 1.54
Mt Educare Limited Ipo -0.041 4 35 3.11
Tribhovandas Bhimji Zaveri Ltd Ipo 0.015 3 200 3.73
Speciality Restaurants Ltd Ipo 0.019 4 176 2.71
Vks Projects Ltd Ipo 0.05 1 55 4.3
Credit Analysis & Research Ltd Ipo -0.004 2 540 5.39
Pc Jeweller Ltd Ipo -0.096 3 609 1.46
Bharti Infratel Limited Ipo 0.024 4 4156 1.89
V-Mart Retail Ltd Ipo 0.104 3 94 3.03
Just Dial Ltd Ipo 0.238 5 919 20.4
Wonderla Holidays Ltd Ipo 0.374 4 181 4.14
Snowman Logistics Ltd Ipo -0.018 4 197 3.38
TeamLease Services Ltd IPO 0.015 4 423.68 10.18
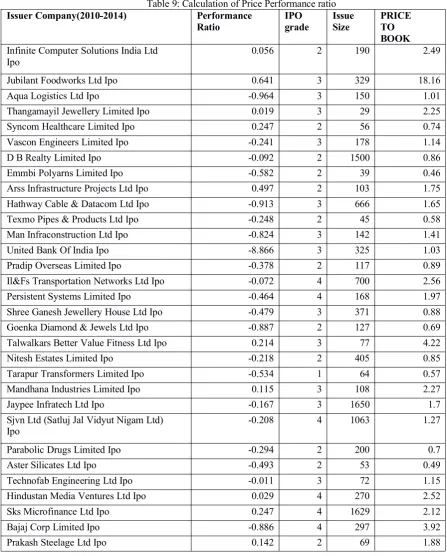
Table 9: Calculation of Price Performance ratio
Issuer Company(2010-2014) Performance
Ratio IPOgrade IssueSize PRICETO BOOK
Infinite Computer Solutions India Ltd
Ipo 0.056 2 190 2.49
Jubilant Foodworks Ltd Ipo 0.641 3 329 18.16
Aqua Logistics Ltd Ipo -0.964 3 150 1.01
Thangamayil Jewellery Limited Ipo 0.019 3 29 2.25
Syncom Healthcare Limited Ipo 0.247 2 56 0.74
Vascon Engineers Limited Ipo -0.241 3 178 1.14
D B Realty Limited Ipo -0.092 2 1500 0.86
Emmbi Polyarns Limited Ipo -0.582 2 39 0.46
Arss Infrastructure Projects Ltd Ipo 0.497 2 103 1.75
Hathway Cable & Datacom Ltd Ipo -0.913 3 666 1.65
Texmo Pipes & Products Ltd Ipo -0.248 2 45 0.58
Man Infraconstruction Ltd Ipo -0.824 3 142 1.41
United Bank Of India Ipo -8.866 3 325 1.03
Pradip Overseas Limited Ipo -0.378 2 117 0.89
Il&Fs Transportation Networks Ltd Ipo -0.072 4 700 2.56
Persistent Systems Limited Ipo -0.464 4 168 1.97
Shree Ganesh Jewellery House Ltd Ipo -0.479 3 371 0.88
Goenka Diamond & Jewels Ltd Ipo -0.887 2 127 0.69
Talwalkars Better Value Fitness Ltd Ipo 0.214 3 77 4.22
Nitesh Estates Limited Ipo -0.218 2 405 0.85
Tarapur Transformers Limited Ipo -0.534 1 64 0.57
Mandhana Industries Limited Ipo 0.115 3 108 2.27
Jaypee Infratech Ltd Ipo -0.167 3 1650 1.7
Sjvn Ltd (Satluj Jal Vidyut Nigam Ltd)
Ipo -0.208 4 1063 1.27
Parabolic Drugs Limited Ipo -0.294 2 200 0.7
Aster Silicates Ltd Ipo -0.493 2 53 0.49
Technofab Engineering Ltd Ipo -0.011 3 72 1.15
Hindustan Media Ventures Ltd Ipo 0.029 4 270 2.52
Sks Microfinance Ltd Ipo 0.247 4 1629 2.12
Gujarat Pipavav Port Ltd (Gppl) Ipo -0.03 4 500 2.84
Indosolar Ltd Ipo -0.182 3 357 1.39
Career Point Infosystems Ltd Ipo 0.021 3 115 2.21
Eros International Media Ltd Ipo -0.123 4 350 2.28
Microsec Financial Services Ltd Ipo -0.431 2 148 0.63
Electrosteel Integrated Ltd Ipo -0.127 3 248 0.8
Ramky Infrastructure Ltd Ipo -0.887 3 530 1.9
Orient Green Power Company Ltd Ipo -0.122 4 900 1.05
Cantabil Retail India Ltd Ipo -0.441 2 105 0.46
Va Tech Wabag Ltd Ipo -0.793 4 125 3.25
Tecpro Systems Ltd Ipo 0.012 4 268 2.11
Ashoka Buildcon Ltd Ipo -0.658 4 225 2.28
Bedmutha Industries Ltd Ipo 0.049 2 92 2.23
Oberoi Realty Ltd Ipo -0.051 4 1029 4.08
Prestige Estates Projects Ltd Ipo -0.103 3 1200 2.01
Gyscoal Alloys Ltd Ipo 0.113 2 55 0.26
Coal India Limited Ipo 0.151 5 15199 12.31
Gravita India Ltd Ipo -0.013 3 45 8.18
Rpp Infra Projects Ltd Ipo -0.229 2 49 1.83
Claris Lifesciences Limited Ipo -0.157 3 300 0.77
Moil Limited Ipo -0.163 5 1238 3.11
Ravi Kumar Distilleries Ltd Ipo -0.466 2 74 0.95
A2Z Maintenance & Engineering
Services Ltd -0.172 4 675 1.82
Punjab & Sind Bank Ipo -0.153 4 471 0.67
C Mahendra Exports Ltd Ipo -0.053 2 165 2.65
Omkar Speciality Chemicals Ltd -0.703 3 79 1.1
Sudar Garments Ltd Ipo 0.513 1 70 1.1
Acropetal Technologies Ltd Ipo -0.663 3 170 0.19
Lovable Lingeries Ltd Ipo 0.13 3 93 3.78
Ptc India Financial Services Ltd Ipo -0.225 3 439 0.8
Shilpi Cable Technologies Ltd Ipo -0.789 1 56 0.28
Muthoot Finance Ltd Ipo -0.033 4 901 1.61
Paramount Printpackaging Ltd Ipo -0.31 2 46 0.25
Future Ventures India Ltd Ipo -0.023 3 750 0.86
Innoventive Industries Ltd Ipo -0.123 3 220 1.53
Servalakshmi Paper Ltd Ipo -0.646 2 60 5.05
Vaswani Industries Ltd Ipo -0.478 2 115 0.23
Sanghvi Forging & Engineering Ltd Ipo -0.416 3 37 1.08
Timbor Home Limited Ipo -0.476 1 23 0.59
Rushil Decor Ltd Ipo 0.403 2 41 4.31
Readymade Steel India Ltd Ipo -0.844 2 35 1.74
Bharatiya Global Infomedia Ltd Ipo -0.716 2 55 0.12
L&T Finance Holdings Limited Ipo 0.041 5 1245 2.47 Tree House Education & Accessories Ltd
Ipo 0.304 3 114 2.79
Brooks Laboratories Ltd Ipo -0.765 2 63 0.29
Srs Limited Ipo -0.679 3 203 0.79
Td Power Systems Ltd Ipo 0.077 4 227 1.98
Pg Electroplast Limited Ipo 0.038 3 121 2.31
Prakash Constrowell Ltd Ipo -0.921 2 60 1.32
Rdb Rasayans Ltd Ipo -0.946 2 36 0.33
Onelife Capital Advisors Ltd Ipo 1.446 1 37 8.8
Taksheel Solutions Ltd Ipo -0.849 2 83 0.12
Flexituff International Ltd Ipo 0.623 3 105 1.93
Indo Thai Securities Limited Ipo -0.817 2 30 0.29
Multi Commodity Exchange Of India
Ltd Ipo -0.099 5 663 3.68
Olympic Cards Ltd Ipo 0.003 1 25 2.57
National Buildings Construction
Corporation -0.828 4 127 1.54
Mt Educare Limited Ipo 0.119 4 35 3.11
Tribhovandas Bhimji Zaveri Ltd Ipo -0.061 3 200 3.73
Speciality Restaurants Ltd Ipo 0.31 4 176 2.71
Vks Projects Ltd Ipo -1.007 1 55 4.3
Tara Jewels Limited Ipo -0.046 3 183 0.5
Credit Analysis & Research Ltd Ipo -0.069 2 540 5.39
Pc Jeweller Ltd Ipo 0.133 3 609 1.46
Bharti Infratel Limited Ipo -9.324 4 4156 1.89
V-Mart Retail Ltd Ipo -0.168 3 94 3.03
Just Dial Ltd Ipo 0.113 5 919 20.4
Wonderla Holidays Ltd Ipo 0.762 4 181 4.14
Snowman Logistics Ltd Ipo 0.173 4 197 3.38