Iranian Chemical Society
Anal. Bioanal. Chem. Res., Vol. 5, No. 1, 143-157, June 2018.
Removal of Methylene Blue, Malachite Green and Rhodamine B in a Ternary
System by Pistachio Hull; Application of Wavelet Neural Network Modeling and
Doehlert Design
Reza Tabaraki*, Ashraf Nateghi
Department of Chemistry, Ilam University, Ilam, Iran (Received 2 October 2017, Accepted 15 January 2018)
Most of previous papers in the field of dye removal used one dye or dyes with nearly separate spectra simplifying dyes concentration determination by Beer's law at different λmaxs. In many real situations, dyes with highly overlapped spectra exist and their concentrations
can be determined by multivariate analysis methods. In this study, principal component-wavelet neural network (PC-WNN) was used for concentration determination of rhodamine B (RB), methylene blue (MB) and malachite green (MG) in ternary solutions. Biosorption of dyes by pistachio hull was selected as model. The effects of operating parameters were studied by Doehlert experimental design. The maximum uptake capacity of pistachio hull for cationic dyes was 0.682 mmol g-1. It was found that the overall biosorption data was described by the pseudo second-order kinetic model. Nine isotherm models were nonlinearly fitted to experimental data and Redlich-Peterson and Radke-Prausnitz isotherm models had the best fit for biosorption equilibrium data.
Keywords: Cationic dyes, Nonlinear fitting, Doehlert design, Wavelet neural network, Isotherm
INTRODUCTION
Dyes are synthetic organic compounds used as colorants in textile, leather, plastic and paper industries [1]. There are more than 100,000 commercial dyes with an estimated production of 7 × 10⁵-1 × 10⁶ tons/year worldwide. It is estimated that 10-20% of dyes are lost during the manufacturing and dyeing processes and produce large amounts of containing wastewater [2,3]. The dye-containing wastewater can adversely affect the aquatic environment by impeding light penetration. Moreover, most of the dyes are toxic, carcinogenic and harmful for human health [4]. Therefore, the treatment of dye wastewaters and
finding dye-removal efficient methods have been
challenging problems among environmental technologies [5].
Biosorption has received more attention because of its
*Corresponding author. E-mail: [email protected]
potential advantages over the traditional methods. Various
types of biosorbents such as bacteria, fungi, algae, active sludge, agricultural and industrial wastes have been tested for their biosorption abilities under different experimental conditions [6]. Different agricultural wastes such as peat [7], deoiled soya and rice bran [8], wheat bran [9], skin almond waste [10] and banana peel [11] have been used for biosorption process.
absorption spectra in dye mixture limit the use of traditional spectrophotometric techniques. This problem can be solved by separation steps or chemometrics methods.
Different mathematical methods are used in multivariate data analysis. Data matrix can be reduced by principal component analysis to independent and orthogonal components. Linear and nonlinear methods are also used for modeling. Artificial neural network (ANN) and wavelet neural networks are nonlinear methods. In wavelet neural network, wavelet theory and feed-forward neural network
principles are combined. For spectrophotometric
determinations, nonlinear modeling systems such as principal component-artificial neural network (PC-ANN) and principal component-wavelet neural network (PC-WNN) have been used [16-18]. The dimensional reduction by principal component analysis (PCA) before model construction has advantages such as increasing stability of model and reducing the amount of co-linearity between variables.
Biosorption factors in a batch system include solution pH, mass of biosorbent, dye concentration, contact time, and solution temperature [19]. Thus, several factors should be optimized. Many statistical experimental design methods have been employed in optimization. Among them, Doehlert designs offer the following advantages: 1) It needs fewer experiments; 2) the number of levels is not the same for all variables, which allows flexibility to assign a large or a small number of levels to the selected variables. Generally it is preferable to choose the variable with the stronger effect as the variable with maximum levels in order to obtain maximum information of the system; 3) Doehlert design is more efficient than central composite design or Box-Behnken design (efficiency of any experimental design is defined as the number of coefficients of the model divided by the number of experiments); 4) Doehlert designs are also more efficient in mapping space: adjoining hexagons can fill a space completely and efficiently, since the hexagons fill space without overlaping [20,21].
In this work, different agriculture wastes are proposed as economical, available and highly effective dye biosorbent. Concentration of each dye in ternary system is determined by principal component-wavelet neural network. Dohelert design and response surface methodology (RSM) are used
to optimize the removal of dyes in aqueous solutions. The kinetics, isotherms and thermodynamics of biosorption of these dyes are also evaluated.
EXPERIMENTAL
Reagents, Biosorbent and Instruments
All chemicals including NaOH, HCl, methylene blue (MB), malachite green (MG) and rhodamine B (RB) were obtained from Merck (Darmstadt, Germany). The stock dye solutions were prepared by dissolving an appropriate
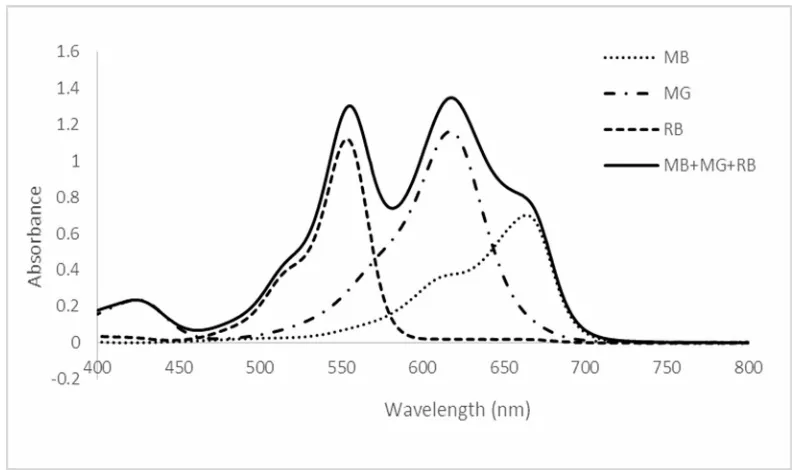
amount of dye in double distilled water and the desired concentrations of test solutions were prepared by diluting the stock solution. Absorption spectra of MB, RB and MG in single and ternary solutions (initial dye concentration of 10-5 M for each dye) are shown in Fig. 1.
Raw pistachio was obtained from the Semnan, Iran. Fruits were manually dehulled and collected hulls were then rinsed with distilled water. The hulls were dried in an oven (Memmert, GmbH + Co. KG, DIN 40050, Germany) with air circulation at 40 ºC, and they were finely ground in a laboratory grinder (Pars Co., Iran). The ground sample was sieved and 0.106-0.250 mm fraction was used for experiments.
The mixture absorption spectra were recorded by UV-Vis spectrophotometer (Varian 300 Bio, Australia) and the pH-meter (Metrohm, model-780, Switzerland, Swiss) was used for pH adjustment. The morphology of the pistachio hull was observed by scanning electron microscopy (SEM) (Hitachi S-4160) under an acceleration voltage of 10 kV.
Determination of the Zero Point Charge pH
(pH
ZPC)
The zero point of charge (pHZPC) for the pistachio hull
was determined by the pH drift method. In this method, the pH was adjusted in the range of 1-7 by addition of HCl and/or NaOH and pistachio hull was added to 50 ml of solution and stirred for 24 h. Difference in final and initial pH of the solution was calculated and plotted against initial solution pH. The surface is neutral when pH = pHZPC. The
surface is negatively charged at pH values greater than pHZPC and positively charged at pH values lower than pHZPC
Fig. 1. Absorption spectra of MB, RB and MG in single and ternary solutions (initial dye concentration of 10-5 M for each dye).
Table 1. Doehlert Experimental Design
X1 X2 X3 m
(g l-1)
pH t
(min)
q
(mmol g-1)
0 0 0 0.25 6.50 40 0.345
0 1 0 0.25 8.00 40 0.431
0.866 0.5 0 0.40 7.25 40 0.544
0.289 0.5 0.816 0.30 7.25 70 0.682
0 -1 0 0.25 5.00 40 0.325
-0.866 -0.5 0 0.10 5.75 40 0.350
0.866 -0.5 0 0.40 5.75 40 0.362
-0.866 0.5 0 0.10 7.25 40 0.349
-0.289 -0.5 -0.816 0.20 5.75 10 0.272
0.289 -0.5 0.816 0.30 5.75 70 0.458
-0.289 0.5 -0.816 0.20 7.25 10 0.282
-0.577 0 0.816 0.15 6.50 70 0.561
Biosorption Test
The batch sorption experiments were carried out in 100 ml Erlenmeyer flasks, where 0.01-0.04 g of the pistachio
hull and 100 ml of the dye solutions (10-4 M) were added following pH adjustment. Experimental solutions were
obtained by successive dilutions. The pH of the dye solutions was adjusted by NaOH/HCl (0.1 M). The Erlenmeyer flasks were subsequently capped and agitated
for 10-70 min at room temperature to achieve equilibrium.
At the end of the equilibrium period, the solutions were filtered to separate the pistachio hull and the residual concentrations of MB, MG and RB in the filtrate were
quantified by spectrophotometric and chemometrics
methods. The data obtained from adsorption tests were used
to calculate the adsorption capacity, qe (mg g-1):
qe = V (Co - Ce)/m (1)
where Co and Ce are the initial and equilibrium
concentrations of dyes in solution (mM), V is the volume of
dye solution (l), qe is the amount of dyes adsorbed per unit
of biosorbent mass (mmol g-1), and m is the mass of
biosorbent (g).
Experimental Design and Statistical Analysis
Different operating conditions (pH, biosorbent dosage and time) were optimized using response surfacemethodology based on a Doehlert experimental design. The levels of the variables were selected according to the
preliminary studies. To study the effect of these three variables, Doehlert experimental design based on 13
combinations of the three variables was studied. The equally spaced values of each independent variable and the
combination between them were adopted and coded. The interrelationship between dependent and operational variables was established by a model including linear,
interaction and quadratic terms. A quadratic polynomial model was constructed for the description of the measured
response as functions of the process variables:
2 3 2 2 22 2 1 11 3 2 23 3 1 13 2 1 12 3 3 2 2 1 1 0 X X b X b X X b X X b X X b X b X b X b b Y
(2)
where X1, X2 and X3 are the values of the three factors
(biosorbant dosage, pH and time), expressed as coded variables; b denotes the regression coefficients (calculated from experimental data by the least-squares method) and Y represents the experimental responses measured (q).
The coded and real values are shown in Table 1. Results were analyzed using Minitab 16 (Minitab Inc., State College, PA, USA) software and fitted to a second-order polynomial regression model. The significances of all terms in the polynomial were analyzed statistically by computing the F-value at a probability (p) of 0.001, 0.01 or 0.05.
Determination of Dye Concentrations in Mixture
and Wavelet Neural Network Optimization
To cover the entire dye concentration range and avoid correlation between them, fifty solutions containing different amounts of all three dyes (at pH of 7) were prepared. Concentration of dyes in 50 solutions were 1 × 10⁻⁶-2 × 10⁻⁵ M, 1 × 10⁻⁶-1.6 × 10⁻⁵ M and 1 × 10⁻⁶-1.6 × 10⁻⁵ M for methylene blue, malachite green and rhodamine B, respectively. They were in linear range in calibration curve of each dye.Thirty, ten and ten solutions were used as calibration, prediction and validation sets, respectively. Calibration, prediction and validation sets were used to optimize the network parameters, to prevent over-fitting and evaluation of the performance of the model, respectively. The absorption spectra of the solutions were recorded from 451 nm to 700 nm in 1 nm intervals. Since 250 data points were recorded for each solution, the response data of the calibration set was a matrix with 30 × 250 dimensions. The calibration data matrix was subjected to principal
component analysis (PCA) using singular value
decomposition (SVD). The scores were selected as input nodes in wavelet neural network. The PC-WNN architectures were different for each dye. The number of PCs as an input layer, the number of nodes in hidden layer and other parameters, except the number of iterations, were optimized simultaneously.
Kinetic Experiments
adjusted to 7 before adding the pistachio hull. At given intervals, samples were taken, filtered, and the filtrate was used to determine dyes concentrations. All of the experiments were carried out three times and the experimental results were expressed as mean.
In order to investigate the kinetic of biosorption, dye biosorption process was analyzed using the pseudo first-order and pseudo-second-first-order kinetic models [24,25]:
ln (qe - qt) = ln qe – k1 t (3)
e e t q t q k q t 2 2
1 (4)
where k1 and k2 show rate constant of the pseudo-first order
and pseudo-second-order rate constants, qt and qe are the
amount of dye adsorbed at time t andsaturation (mmol g-1), respectively.
The constant k2 is used to calculate the initial sorption
rate (h) at t→0 as follows:
2
2qe k
h (5)
Biosorption Isotherm
In this study, several isotherms (Langmuir, Freundlich, Dubinin-Radushkevich, Redlich-Peterson, Hill, Sips, Koble-Corrigan and Radke-Prausnitz isotherms) were used to correlate the results of dye adsorption by pistachio hull [26]. Nonlinear regression method was used to fit equilibrium biosorption data. It was suggested that fitting of nonlinear models are preferred because linearization of the isotherm equations changes the original error distribution [27]. The adsorption equilibrium data for MB, MG and RB in single and ternary systems by pistachio hull were analyzed by
non-linear curve fitting analysis implemented in the
Mathematica 8 software.
Langmuir isotherm refers to homogeneous adsorption, in which each molecule possesses constant enthalpies and sorption activation energy, with no transmigration of the adsorbate in the plane of the surface. All sites possess equal affinity for the adsorbate. The Langmuir model is:
e L e L e C K C K Q q 1
0 (6)
where Ce is the equilibrium concentration of adsorbate
(mg l-1), qe denotes the adsorbate adsorbed per gram of the
adsorbent at equilibrium (mg g-1), Q0 represents the
monolayer coverage capacity (mg g-1) and KL is the
Langmuir isotherm constant (l mg-1).
Freundlich isotherm describes non-ideal and reversible adsorption, not restricted to the formation of monolayer. This empirical model can be applied to multilayer adsorption, with non-uniform distribution of adsorption heat and affinities over the heterogeneous surface:
n
e f e K C q
1
(7)
where Ce (mg l-1) is the aqueous-phase equilibrium
concentration, qe (mg g-1) is the solid-phase equilibrium
concentration, and Kf and n are the Freundlich sorption
coefficient and the Freundlich exponent, respectively. Dubinin-Radushkevich is an empirical model applied to express the adsorption mechanism with a Gaussian energy distribution onto a heterogeneous surface. The Dubinin-Radushkevich equation defined by the following equation:
qe= Qm exp (-Kε2) (8)
where K is the Dubinin-Radushkevich isotherm constant
related to the adsorption energy (mol2 kJ-2), Qm is the
theoretical isotherm saturation capacity (mg g-1), ε is the Polanyi potential, calculated from Eq. (9):
ln(1 1)
e
C
RT
(9)
Redlich-Peterson isotherm is a hybrid isotherm featuring
both Langmuir and Freundlich isotherms incorporating three parameters into an impirical equation. It represents adsorption equilibrium over a wide concentration range that can be applied either in homogeneous or heterogeneous systems due to its versatility:
g e RP e RP e C a C K q 1 (10)
(l g-1), aRP is the Redlich-Peterson model constant (mg l-1);
g is theRedlich-Peterson model exponent.
Hill isotherm was used to describe the binding of different species onto homogeneous substrates assuming that adsorption is a cooperative phenomenon, with the ligand binding ability at one site on the macromolecule, that may influence different binding sites on the same macromolecule: H H n e D n e sH e C K C q q
(11)
where sH
q is the Hill isotherm maximum uptake saturation
(mg l-1), KD is the Hill constant, nH is the Hill cooperativity
coefficient of the binding interaction.
By identifying the problem of continuing increase in the adsorbed amount with an increase in concentration in the Freundlich equation, Sips proposed an equation similar in form to the Freundlich equation, but it has a finite limit when the concentration is sufficiently high:
ms e s ms e s ms e C K C K q q 1 (12)
where qms is the Sips maximum adsorption capacity (mg/g),
Ks is the Sips equilibrium constant (l mg-1)ms and ms is the
Sips model exponent, limited from 0 to 1.
Koble-Corrigan model is the three-parameter empirical model based on the combination of both the Langmuir and Freundlich isotherm equations representing in one non-linear equation of the equilibrium adsorption data. The model is commonly expressed by Eq. (13):
n e n e e C b aC q 1 (13)
where a (ln mg1-n g-1), b (l mg-1)n and n are the Koble-Corrigan parameters. This model is generally applied for heterogeneous sorbent surface.
The three isotherms of Radke and Prausnitz model can be represented as:
RPII RPII m e RPII e RPII m e C K C K q q 1 (14) 1 1 RPIII RPIII RPIII m e RPII m e RPIII m e C K C K q
q (15)
where qmRPI, qmRPII and qmRPIII are the Radke-Prausnitz
maximum adsorption capacities (mg g-1), KRPI , KRPII and
KRPIII are the Radke-Prausnitz equilibrium constants, and
mRPI, mRPII and mRPIII are the Radke-Prausnitz model
exponents [26,28].
An error function is defined to enable the optimization process to determine and evaluate the fit of the isotherm equation to the experimental data. In the current work, several mathematically rigorous error functions were examined. Error functions were discussed in detail in Rangabhashiyam paper [28].
Thermodynamic Study
Temperature effects were investigated at three different temperatures 20, 30, 40 and 50 °C. For this purpose, dried biomass was added to 250 ml dye solution in 500-ml Erlenmeyer flasks (each dye concentration of 10-5 M, biosorbent dosage of 0.3 g l-1 and pH = 7.25). The flasks were placed in a thermostatic water bath on a shaker with constant shaking. After 70 min, the concentrations of each dye in the filtrates were determined. The value Cad,eq (mM)
is the amount of each dye on the biosorbent at equilibrium and Ceq (mM) is the dye concentration remaining in solution
at equilibrium conditions. The Cad, eq was determined as the
difference of initial and remaining dye concentration in solution at equilibrium conditions. These concentrations were used for calculation of the equilibrium constant (KC =
Cad,eq/Ceq).
RESULTS AND DISCUSSION
Biosorbent
tendency to form agglomerates.
Biosorption in a Single System
Effect of pH. At low pH, as a result of protonation of the functional groups, surface gets positively charged and the strong repulsive forces between the cationic molecules and surface lead to significant decrease in the dye removal. The increase in the initial pH lead to deprotonation of the active adsorption sites on surface and electrostatic interaction and/or hydrogen bonding adsorbs the dye molecule. The pHZPC value of the pistachio hull was found
to be 5.0. The surface of the pistachio hull is neutral when pH of the aqueous solution is equal to pHZPC (Fig. 3). At pH
> pHPZC, the adsorbent surface is negatively charged due to
deprotonation of its functional group that causes an increase in the adsorption percentage.
The initial pH of the aqueous solution affects dye aqueous chemistry and surface binding sites of the biosorbents. Generally, a shift in UV-Vis spectra of dyes or a change in absorbance is associated with a wide change in pH. In single dye systems, different calibrations were prepared for each pH. The effect of initial pH on the MB, MG and RB removal was studied in the pH range of 2-8 with initial dye concentration of 10-5 M and biosorbent dose
of 0.05 g. The experiments were conducted for 30 min of contact time at room temperature and the respective results are presented in Fig. 4a. The initial pH significantly affects the extent of biosorption of MB, MG and RB on the pistachio hull and the maximum uptake is significantly increased at higher pH values. As can be seen, the maximum uptake of MB, MG and RB is highest at pH values of 7.0, 5.0 and 5.0, respectively.
Effect of biosorbent dose. The maximum uptake of MB, MG and RB decreases with increase in biosorbant dose (Fig. 4b). At constant dye concentration, dye removal capacity decreased by biosorbent dose increase (due to increase in biosorbent mass, Eq. (1)). The sorption of Direct Blue 71 by wheat shells from aqueous solution occurred at low biosorbent doses [29]. Similar behavior on peanut hull was observed [30].
is observed that MB, MG and RB biosorption on pistachio hull occurs relatively rapid and approaches to equilibrium within 30 min at room temperature [31].
Determination of Dye Concentration in a Ternary
System and an Experimental Design
Figure 1 shows absorbance spectra of the single and ternary solutions of MB, MG and RB (10-5 M for each dye). The simplest and the most common method is a top-down variable selection where the PCs are ranked in the order of
decreasing eigenvalue. The PC with the highest eigenvalue is considered as the most significant one, and, subsequently, the PCs are introduced into the WNN model one after the other. WNN models were developed using different numbers of the PCs in input layer. The WNN variables consisted of the number of PCs as an input layer, the number of nodes in the hidden layer, the learning rate, the momentum and the number of epochs, which optimized for each dye separately. The optimized variable parameters for each dye are given in Table 2.
Table 2. The Optimized Parameters of PC-WNN Models
Parameters RB MB MG
Input neurons 3 3 3
Hidden neurons 2 2 2
Output neurons 1 1 1
Learning rate 0.058 0.067 0.051
Momentum 0.87 0.22 0.20
Number of iterations 1000 3000 2000
Hidden transfer function Morlet Morlet Morlet
Output transfer function Linear Linear Linear
Table 3. First-order and Second-order Kinetic Constants of MB, MG and RB Dyes in Single and Ternary Systems
Pseudo-first-order Pseudo-second-order
System Dye K1 qe1 R2 K2 qe2 R2 qexp
Single MB 0.1374 0.0083 0.876 27.03 0.017 0.999 0.0162
MG 0.099 0.0065 0.936 29.41 0.015 0.999 0.0143
RB 0.1933 0.0099 0.989 34.48 0.017 0.999 0.0162
Ternary MB 0.0574 0.0066 0.989 15.15 0.011 0.996 0.0098
MG 0.0384 0.006 0.915 21.28 0.012 0.994 0.0114
Table 4. Comparison of Different Isotherms Based on Error Functions
Model Single Ternary
MB MG RB MB MG RB
Langmuir
SSE 4.6 × 10⁻⁵ 3.11 × 10⁻⁵ 1.32 × 10⁻⁴ 9.95 × 10⁻⁵ 7.65 × 10⁻⁵ 1.82 × 10⁻⁵
ARE 16.19 5.32 80.56 38.09 133.46 10.07
2 adj
R 0.9954 0.9858 0.959 0.9653 0.942 0.9863
Freunndlich
SSE 3.71 × 10⁻⁴ 2.06 × 10⁻⁴ 3.58 × 10⁻⁴ 2.09 × 10⁻⁴ 1.57 × 10⁻⁴ 1.72 × 10⁻⁵
ARE 64.43 16.34 210.13 86.24 281.09 16.03
2 adj
R 0.963 0.9062 0.8883 0.927 0.8809 0.9871
Dubinin-Radushkevich
SSE 5.93 × 10⁻⁵ 5.63 × 10⁻⁵ 1.88 × 10⁻⁴ 1.05 × 10⁻⁴ 9.22 × 10⁻⁵ 1.87 × 10⁻⁵
ARE 6.82 7.19 89.49 23.48 114.36 11.8
2 adj
R 0.9941 0.9743 0.9413 0.9633 0.9302 0.9859
Redlich-Peterson
SSE 1.46 × 10⁻⁶ 1.78 × 10⁻⁵ 1.78 × 10⁻⁵ 1.11 × 10⁻⁵ 1.02 × 10⁻⁵ 1.44 × 10⁻⁵
ARE 5.34 3.55 43.57 14.9 78.74 6.51
2 adj
R 0.9999 0.9909 0.9942 0.9959 0.9918 0.9871
Hill
SSE 3.14 × 10⁻⁶ 2.1 × 10⁻⁵ 5.6 × 10⁻⁵ 1.93 × 10⁻⁵ 1.57 × 10⁻⁴ 1.39 × 10⁻⁵
ARE 5.46 3.35 8.6819 24.27 281.09 8.76
2 adj
R 0.9997 0.9892 0.9818 0.9928 0.8729 0.9891
Sips
SSE 3.14 × 10⁻⁶ 2.1 × 10⁻⁵ 4.83 × 10⁻⁵ 1.93 × 10⁻⁵ 1.49 × 10⁻⁵ 1.39 × 10⁻⁵
ARE 5.48 3.35 9.07 24.27 18.86 8.76
2 adj
R 0.9997 0.9892 0.9843 0.9928 0.9879 0.9891
Koble-Corrigan
SSE 3.14 × 10⁻⁶ 2.1 × 10⁻⁵ 4.83 × 10⁻⁵ 1.93 × 10⁻⁵ 1.49 × 10⁻⁵ 1.39 × 10⁻⁵
ARE 5.48 3.35 9.07 24.27 18.86 8.76
2 adj
R 0.9997 0.9892 0.9843 0.9928 0.9879 0.9891
Radke-Prausnitz(II)
1.46 × 10⁻⁶ 2.75 × 10⁻⁴ 1.83 × 10⁻⁴ 2.2 × 10⁻⁵ 1.22 × 10⁻⁴ 1.44 × 10⁻⁵
ARE 5.34 14.81 58.28 19.18 108.45 6.51
2 adj
R 0.9998 0.8588 0.9907 0.9918 0.9012 0.9887
Radke-Prausnitz(III)
SSE 1.46 × 10⁻⁶ 1.78 × 10⁻⁵ 1.78 × 10⁻⁵ 1.11 × 10⁻⁵ 1.02 × 10⁻⁵ 1.44 × 10⁻⁵
ARE 5.34 3.55 43.57 14.91 78.74 6.51
2 adj
R 0.9998 0.9909 0.9942 0.9959 0.9918 0.9910
Table 5. Thermodynamic Parameters for Biosorption of MB, MG and RB in Single and Ternary Systems
Dye T
(K)
∆Gº
(kJ mol-1)
∆Hº
(kJ mol-1)
∆Sº
(J mol-1)
Single MB 293 -8.28 12.69 72.4
303 -9.6
313 -10
323 -10.56
MG 293 -8.95 12.5 39.4
303 -9.38
313 -9.81
323 -10.12
RB 293 -7.33 10.63 60.8
303 -7.66
313 -8.25
323 -9.16
Ternary MB 293 -6.13 5.29 39
303 -6.41
313 -6.77
323 -7.45
MG 293 -6.35 8.94 51.8
303 -6.6
313 -7.22
323 -7.87
RB 293 -6.67 9.71 55.7
303 -7.06
313 -7.67
A surface response methodology based on a Doehlert experimental design was applied to study the effects of pH, biosorbent concentration and time on biosorption capacity
of dye (MB, MG and MB) in ternary system (Table 1). A full quadratic model containing ten coefficients was used to describe the response observed to fit Eq. (2). Second-order polynomial model for q (mmol g-1) was:
q (mmol g-1) = 0.345 + 0.043 X1* + 0.078 X2*+ 0.141
X3* + 0.048 X12 + 0.033 X22+ 0.065 X32 + 0.092 X1 X2*
+ 0.0006 X1X3 + 0.077 X2 X3 R2 = 0.977 (16)
The significances of all terms were analyzed statistically by computing the F-value at a probability (p) of 0.05 and significant terms identified by star. It is important to find
out the optimal conditions using developed mathematical model. The optimized conditions were initial solution pH 7.25, contact time 70 min and adsorbent dosage 0.3 g l-1. At this condition, biosorption capacity was 0.682 mmol g-1.
Kinetic Modeling
Table 3 lists pseudo first-order and pseudo second-order rate constants for MB, MG and RB in single as well as ternary systems. The correlation coefficient (R2) for the pseudo second-order adsorption model was relatively high, and the adsorption capacities calculated by the model were
also close to those determined by experiments. However, the values of R2 for the pseudo first-order model were not satisfactory. Therefore, it has been concluded that the pseudo second-order adsorption model was more suitable to
describe the biosorption kinetics of MB, MG and RB. In addition, the initial bisorption rate, h = k2qe2, has been
widely used for evaluation of the biosorption rates [32]. In
the present study, the values of initial bisorption rate decreased as follows: 0.01 mmol g-1 min-1 RB > 0.008 mmol g-1 min-1 MB > 0.0067 mmol g-1 min-1 MG > 0.0038 mmol g-1 min-1 RB (MB-MG-RB) > 0.0029 mmol g-1 min-1 MG
(MB-MG-RB) > 0.0017 mmol g-1 min-1 MB (MB-MG-RB)
indicating that pistachio hull can adsorb RB more rapidly than MB and MG from aqueous solutions. The overall order of biosorption is dependent upon the
characteristics of the dyes as well as the nature of
biosorbent.
Biosorption Isotherm Models
The adsorption equilibrium data for MB, MG and RB in single and ternary systems were analyzed by non-linear curve fitting analysis for two-parameter (Langmuir,
Freundlich and Dubinin-Radushkevich) and three-parameter (Redlich-Peterson, Hill, Sips, Koble-Corrigan and Radke-Prausnitz) isotherm models. Table 4 shows the values of average relative error (ARE), sum of squares or the error (SSE), and adjusted determination coefficient ( 2
adj
R ) used to
check the validity of the isotherm models. It was concluded that the three-parameter models of Redlich-Peterson and
Radke-Prausnitz had the best correlation.
Thermodynamic Study
The value of thermodynamic parameters (free energy, enthalpy and entropy changes) as criterion for evaluation of feasibility and the spontaneous nature of the process were
evaluated from the following equation [33]:
∆G° = -RT lnKC (17)
where ∆Go, R, KC and T are the free energy change
(kJ mol-1), universal gas constant (8.314 J mol-1 K-1),
equilibrium constant and absolute temperature (K),
respectively. The slope and intercept of Van’t Hoff plot (ln KDvs. 1/T) were used to evaluate ∆H° and ∆S°:
RT H R
S
Kc
ln (18)
where R is the universal gas constant (8.314 J mol-1 K-1), KC, the thermodynamic equilibrium constant and T is the
absolute temperature (K). The thermodynamic parameters (Table 5) such as negative ∆G° values confirm the
CONCLUSIONS
Some crucial implications of this study are listed below:
1. Multivariate analysis methods such as principal component-wavelet neural network were successfully used for determination of dyes with overlapped spectra in ternary
solutions.
2. In single and ternary systems, the Redlich-Peterson and
Radke-Prausnitz models showed a better fit with the following sorption order: RB > MG > MB.
3. The biosorption performance of pistachio hull for dyes was fairly good with biosorption capacity of 0.682
mmol g-1.
4. Thermodynamically, the biosorption of MB, MG, RB
dyes bypistachio hull from single and ternary solutions was spontaneous (∆G° < 0) and endothermic (∆H° > 0) with
high preference of dyes towards the biomass surface (∆S° > 0).
ACKNOWLEDGEMENTS
The authors are grateful to the Ilam University Research Council for financing the project.
REFERENCES
[1] F.C. Wu, R.L. Tseng, J. Hazard. Mater. 152 (2008) 1256.
[2] M. Arami, N.Y. Limaee, N.M. Mahmoodi, N.S.
Tabrizi, J. Hazard. Mater. 135 (2006) 171.
[3] L. Brinza, C.A. Nygard, M.J. Dring, M. Gavrilescu, L.G. Benning. Bioresour. Technol. 100 (2009) 1727.
[4] V. Vimonses, B. Jin, C.W.K. Chow. J. Hazard. Mater.
157 (2010) 472.
[5] A.N. Soon, B.H. Hameed. Desalination 269 (2011) 1.
[6] T. Akar, S. Arslan, S.T. Akar. Ecol. Eng. 58 (2013)
363.
[7] S.J. Allen, G. Mckay, J.F. Porter. J. Colloid Interf. Sci. 280 (2004) 322.
[8] A. Mittal, J. Mittal, A. Malviya, D. Kaur, V.K. Gupta,
J. Colloid Interf. Sci. 343 (2010) 463.
[9] X.S. Wang, X. Liu, L. Wen, Y. Zhou, Y. Jiang, Z. Li,
Sep. Sci. Technol. 43 (2008) 3712.
[10] F. Atmani, A. Bensmaili, N.Y. Mezenner, J. Environ. Sci. Technol. 2 (2009) 153.
[11] K. Amel, M.A. Hassena, D. Kerroum, Energy
Procedia 19 (2012) 286.
[12] F. Sánchez Rojas, C. Bosch Ojeda, Anal. Chim. Acta 635 (2009) 22.
[13] M. Kucharska, J. Grabka, Talanta 80 (2010) 1045. [14] A. Peláez-Cid, S. Blasco-Sancho, F. Matysik, Talanta
75 (2008) 1362.
[15] A.H. Alghamdi, Arabian J. Chem. 3 (2010) 1.
[16] A.A. Ensafi, T. Khayamian, R. Tabaraki, Talanta 71
(2007) 2021.
[17] P.J. Gemperline, J.R. Long, V.G. Gregoriou, Anal.
Chem. 63 (1991) 2313
[18] T. Khayamian, A.A. Ensafi, R. Tabaraki, M. Esteki.
Anal. Lett. 38 (2005) 1477.
[19] E.C. Lima, B. Royer, J.C.P. Vaghetti, J.L. Brasil, N.M.
Simon, A.A. dos Santos Jr, F.A. Pavan, S.L.P. Dias, E.V. Benvenutti, E.A. da Silva, J. Hazard. Mater. 140
(2007) 211.
[20] S.L.C. Ferreira, W.N.L. dos Santos, C.M. Quintella, B.B. Neto, J.M. Bosque-Sendra, Talanta 63 (2004)
1061.
[21] P. Vanloot, J.L. Boudenne, L. Vassalo, M. Sergent, B.
Coulomb, Talanta 73 (2007) 237.
[22] E. Kiefer, L. Sigg, P. Schosseler, Environ. Sci.
Technol. 31 (1997) 759.
[23] B.K. Nandi, A. Goswami, M.K. Purkait, J. Hazard.
Mater. 161 (2009) 387.
[24] T.K. Sen, S. Afroze, H.M. Ang, Water Air Soil Pollut.
218 (2011) 499.
[25] M. Mohammad, S. Maitra, N. Ahmad, A. Bustam,
T.K. Sen, B.K. Dutta, J. Hazard. Mater. 179 (2010) 363.
[26] K.Y. Foo, B.H. Hameed, Chem. Eng. J. 156 (2010) 2.
[27] Y.S. Ho, W.T. Chiu, C.C. Wang, Bioresour. Technol.
96 (2005) 1285.
[28] S. Rangabhashiyam, N. Anu, M.S. Giri Nandagopal, N. Selvaraju, J. Environ. Chem. Eng. 2 (2014) 398.
[30] R. Gong, Y. Sun, J. Chen, H. Liu, G. Yang, Dyes
Pigments 67 (2005) 175.
[31] J.F. Gao, Q. Zhang, K. Su, J.H. Wang, Bioresour.
Technol. 101 (2010) 5793.
[32] S. Dawood, T. Kanti Sen, Water Res. 46 (2012) 1933.