73 Iranian Journal of Chemical Engineering
Vol. 6, No. 4 (Autumn), 2009, IAChE
Research note
Simultaneous Effects of Ionic Surfactant and Salt on
Drop-Interface Coalescence
A. Bozorgian, P. Khadiv-Parsi, M. A. Moosavian
School of Chemical Engineering, University College of Engineering, University of Tehran, Iran. PoBox: 11155-4563
Abstract
In this research, the effect of mixed salts together with mixed ionic surfactants on drop- interface coalescence time was studied for the system of water (d) / toluene(c) as a model system. Sodium dodecyl sulfate (SDS) and cetyl trimethyl ammonium bromide (CTAB) as anionic and cationic surfactants were used. Sodium chloride (NaCl) and magnesium sulfate were used as salts. In the first stage of experiments, the system of water and toluene was influenced separately with SDS+NaCl, SDS+MgSO4, CTAB+NaCl and CTAB+MgSO4. It was observed that drop size increased with SDS+NaCl and also with SDS+MgSO4. Partial coalescence times increased for all systems. Overall, this increase of coalescence time was more obvious when CTAB was applied. Also reduction in drop size was observed. In the case of mixed surfactants with single salt, it was observed that partial coalescence was suppressed for the system with (SDS+CTAB)+MgSO4. On the other hand, drop size decreased and total coalescence time increased. This may be due to the difference between the anions and cations of the two salts. For the case of mixed surfactants with mixed salts, drop size and coalescence time decreased.
Keywords: drop coalescence; mixed surfactants; continuous phase; salt; partial
coalescence
Corresponding author: [email protected] Introduction
Drop coalescence phenomena including binary drop and drop-interface coalescence occurs naturally in liquid-liquid dispersions. The main variables that influence this phenomenon are drop size, physical properties of the chemical system and distance between drops or between drop and interface. The major part of the process which takes more time in the range of seconds is the drainage time of the
stabilize the drops against coalescence, rather than their ability to reduce the interfacial tension. It was observed earlier that ionic surfactant reduced drop size together with the time coalescence increase, which was vigorous for mixed surfactants [5-8].
It has been proved that mixtures of surfactants can provide better performance than pure or single surfactant. Mixed surfactants show synergism in the dispersion which can be defined like a situation where they act better because of providing minimum energy for the system and they are widely used in research and industry. The hydrophilic-lipophilic properties of the surfactants are varied by mixing [7, 9-11]. Moreover, the presence of any salt such as sodium chloride (NaCl) causes critical micelle concentration of the surfactant to be reduced, because it may reduce the hydrophilic tendency of water-soluble surfactants. The salt increases the degree of coalescence for low surfactant concentration and causes instability in emulsions produced in food industries with protein surfactants [12,13].
It was also concluded that salts have little effect on the coalescence in a system with ionic or nonionic surfactants and, irrespective to lowering the interfacial tension due to the use of mixed surfactants, does not effect the drop size [5, 14, 15]. It was seen that at a higher concentration of NaCl, the shelf life of the emulsion increased due to electrostatic repulsion forces [16].
In this research, we studied the effect of mixed ionic surfactant and salt on the drop-interface coalescence.
Materials and Method Materials
Selection of chemicals was based primarily on the recommended systems for liquid-liquid extraction [17]. Distilled water was used in all experiments as the dispersed phase. Continuous phase was toluene provided from Merck (purity>99.0 %) with a density of 862.1 kg/m3, viscosity of 0.6689 mPa.s and interfacial tension of 36.2 mN/m. It was used as received. The surface active agents of sodium dodecyl sulfate (SDS) and cetyl trimethyl ammonium bromide (CTAB) used were also provided from Merck. Purities of anionic and cationic surfactants were above 85.0 % and 90.0 % respectively. Both surfactants were in the form of white powder and were soluble in water.
Also, salts of sodium chloride (NaCl) and Magnesium sulfate (MgSO4) with purities
above 90.0% were provided from Merck.
Apparatus
All the experiments were conducted in a coalescence cell which was designed and constructed earlier [7] based upon the initial design attributed to Charles and Mason [2]. Fig. 1 shows the experimental apparatus and Fig. 2 illustrates the equipment in greater detail.
Iranian Journal of Chemical Engineering, Vol. 6, No. 4 75 Figure 1. Photo of experimental coalescence cell [7]
Method and procedure
Before each run, it was necessary to saturate the two immiscible phases with each other. It was done by mixing them in a clean separate beaker for approximately 15 minutes and then left undisturbed to separate from each other. To eliminate any contingency of naturally occurring contaminants, all parts of the cell and experimental devices were submerged in a freshly made 10% (v/v) chromic acid, then washed with acetone and warm distilled water followed by drying in an oven. Care must be taken in handling and assembling all parts of the cell together. No lubricant was used for valves or joints. To examine possible leakage, the cell was filled with distilled water and then discharged.
Figure 2. Experimental coalescence cell; (a)main body
(50 cm height, 8.5 cm inside diameter); (b) microburette; (c,d) continuous and dispersed phase reservoirs (each 240 ml); (e) capillary (0.4 -1.5 mm inside diameter); (f) drop receiver cup (4.0 cm inside diameter); (g) drainage valve, (h) outlet way for trapped air or chemical vapor
(a) (b)
(c)
(d)
Figure.3. Capillaries of coalescence cell, a: nozzle
with conical tip; b: nozzle with flat tip c: experimental nozzles; d: formation of drop at the tip of nozzle
Time interval between successive detached drops from the nozzle tip was adjusted from 2.0 to 3.0 minutes to suppress any disturbance and corrugation that might be produced inevitably at the interface due to drop coalescence.
Coalescence time was measured by a stopwatch having a precision of 0.01 seconds.
For each chemical system the drop size was determined by counting a definite number of successive detached drops from the capillary tip, followed by measuring the total volume of the consumed dispersed phase from the microburette. This trend was repeated for various rates of drop formation and also each size of nozzle by adjusting the valve of the microburette.
Coalescence time, including the time interval between the detachment of drop from nozzle tip towards the interface and entire coalescence with it was measured. It was named the first step of coalescence time. Upon completion of the first step of the process, the overall time of subsequent steps was measured separately as partial coalescence time [18]. The sum of these two amounts gave the total coalescence time. Order of experiments was as follows:
a) pure system of water(d) / toluene(c) b) system with single surfactant and single
salt [water(d)/surfactant + salt / toluene(c)]
c) system with mixed (dual) surfactants and single salt [water(d)/ mixed (dual) surfactants + salt / toluene(c)]
Iranian Journal of Chemical Engineering, Vol. 6, No. 4 77
After several experiments, it was found that
the best basis for surfactant was 8*10-3 gr., as
the critical micelle concentration of ionic
surfactants are around 10-3 mol/lit. On the
other hand, below this concentration there is no difference between a pure system and a surfactant containing system. Also, for uniformity in calculation the basis of salt
amount was chosen 8*10-3 gr. For the case of
mixed surfactants or salts, the second constituent was added in weigh percents of 20, 40, 60 and 80 with respect to the first one. The values were selected in such a manner to resemble the best weigh percent increment [ 7, 8].
Result and Discussion
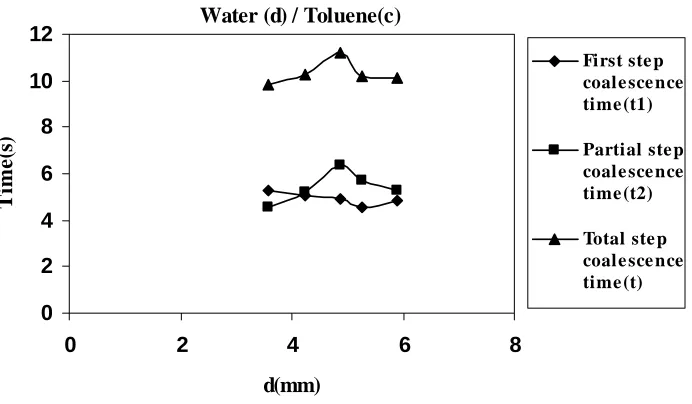
a) System of water and toluene:
Fig. 4 illustrates the results of the first step
(t1), partial step (t2) and total step
coalescence time (t) versus drop size for the
system of water (d) / toluene(c).
As seen from this figure, partial coalescence time increased with drop size up to approximately 5.0 mm and then reduced. Total time obeyed this trend as well.
However, first coalescence time decreased with drop size and then increased.
As a whole, coalescence time increased with drop sizes as observed in this work and those were obtained earlier [7, 8].
b) System with mixture of surfactant and salt: Four systems were studied as follows: b-1) water (d) /SDS+NaCl / toluene(c)
b-2) water (d) /SDS+MgSO4 / toluene(c)
b-3) water (d) /CTAB+NaCl / toluene(c)
b-4) water (d) /CTAB+MgSO4 / toluene(c)
It was found that in these experiments the best value for the amount of surfactant and salt was 0.008 gr [ 7, 8].
The results are shown in Figs.5 to 7.
Water (d) / Toluene(c)
0 2 4 6 8 10 12
0 2 4 6 8
d(mm)
Tim
e
(s
)
First ste p coale sce nce time (t1)
Partial ste p coale sce nce time (t2)
Total ste p coale sce nce time (t)
Figure 4. First step, partial step and total steps coalescence times for system of
0 5 10 15 20 25 30
0 2 4 6 8
d(mm)
t1
(s
)
Wate r(d) /Tol ue ne (c)
SDS+NaC l
SDS+MgSo4
C TAB+NaC l
C TAB+MgSo4
Figure 5. First coalescence time for system containing mixture of surfactant and salt
0 10 20 30 40 50 60 70
0 2 4 6 8
d(mm)
t2
(s
)
W ate r (d) / Tolue n e (c)
SDS+NaC l
SDS+MgS o4
C TAB+NaCl
C TAB+MgSo4
Figure 6. Partial coalescence time for system containing mixture of surfactant and salt.
0 10 20 30 40 50 60 70 80 90 100
0 2 4 6 8
d(mm)
t(
s)
W ate r (d) / Tolu e n e (c)
SDS+NaC l
SDS+MgS o4
C TAB+NaC l
C TAB+MgS o4
Iranian Journal of Chemical Engineering, Vol. 6, No. 4 79 The results could be better explained on the
average basis as shown in Table.1.
It was observed that addition of SDS and NaCl to the pure system caused increases of mean drop size, partial and total coalescence times, while the first time decreased. Mixture of SDS and MgSO4 had also shown this
behavior.
This trend was also obtained for CTAB and NaCl, but the mean drop size decreased [6]. For the case of CTAB and MgSO4, time increase was very high.
It was concluded that:
- Increasing the ionic strength of salt caused drop size decrease which in turn increased
average partial and total coalescence times.
c) System with mixture of two surfactants and one salt:
Since it was seen experimentally that CTAB was more effective than SDS, we added it gradually to two systems containing SDS+NaCl and SDS+MgSO4, respectively.
The amounts of CTAB which were added to SDS were 20, 40, 60 and 80 percent by weight, respectively.
c-1) System with mixture of surfactants of SDS+CTAB and salt NaCl
The results of coalescence times as functions of drop sizes are shown in Figs.8 to 10.
Table 1. Results of coalescence times for system containing mixture of surfactant and salt. Ave. total coalescence
time (s) Ave. partial
coalescence time (s) Ave. first
coalescence time (s) Mean drop
size (mm) Chemical system
10.32 5.41
4.91 4.76
Water (d) / Toluene(c)
11.62 8.14
3.48 5.40
Water (d) / SDS+NaCl / Toluene(c)
11.51 7.19
4.32 5.00
Water (d)/SDS+MgSO4/ Toluene(c)
38.17 29.35
8.82 4.61
Water (d)/CTAB+NaCl / Toluene(c)
65.71 44.71
21.00 4.52
Water(d)/CTAB+MgSO4/Toluene(c
CTAB in Water (d) / Toluene(c)+SDS+NaCl
0 2 4 6 8 10 12 14 16 18
0 2 4 6 8
d(mm)
t1
(s
)
Water (d) / Toluene(c) SDS+NaCl
20% w/w CTAB 40% w/w CTAB 60% w/w CTAB 80% w/w CTAB
Figure 8. First coalescence time for system with mixed surfactant (SDS+CTAB) and single
CTAB in Water (d) / Toluene(c)+SDS+NaCl
0 2 4 6 8 10 12 14
0 2 4 6 8
d(mm)
t2
(s
)
Water (d) / Toluene(c) SDS+NaCl 20% w /w CTAB 40% w /w CTAB 60% w /w CTAB 80% w /w CTAB
Figure 9. Partial coalescence time for system with mixed surfactant (SDS+CTAB) and single
salt (NaCl) versus drop size and weigh percent of second surfactant (CTAB).
CTAB in water (d) / Toluene(c)+SDS+NaCl
0 2 4 6 8 10 12 14 16 18
0 2 4 6 8
d(mm)
t(
s
)
w ater (d) / Toluene(c) SDS+NaCl 20% w /w CTAB 40% w /w CTAB 60% w /w CTAB 80% w /w CTAB
Figure 10. Total coalescence time for system with mixed surfactant (SDS+CTAB) and single
salt (NaCl) versus drop size and weigh percent of CTAB.
In Table 2, mean drop size and average coalescence times are compared with each other. For weigh percents of 20 and 40 of CTAB, drop size increased in comparison to the system of water/toluene and system with single surfactant and salt. For other weigh percents, drop sizes decreased. It might be due to the reduction of interfacial tension as a result of a much higher amount of CTAB.
Also, partial coalescence was suppressed. For all weigh percents of CTAB, average total coalescence time was obviously decreased. Increase of first step coalescence time was for a weigh percent of 80.
Iranian Journal of Chemical Engineering, Vol. 6, No. 4 81
Table 2. Coalescence times for systems with mixed surfactant (SDS+CTAB) and single salt (NaCl) Ave. total coalescence
time (s) Ave. partial
coalescence time (s) Ave. first
coalescence time (s) Mean drop
size (mm) Chemical system
10.32 5.41
4.91 4.76
Water (d) / Toluene(c)
11.62 8.14
3.48 5.40
Water (d) / Toluene(c) +SDS+NaCl
6.66 2.53
4.13 5.70
Water (d )/ Toluene(c)+ SDS+(20% w/w CTAB)+NaCl
1.90
1.90 5.50
Water (d )/ Toluene(c)+ +SDS+(40% w/w CTAB)+NaCl
2.50
2.50 4.54
Water (d )/ Toluene(c)+
+SDS+(60% w/w CTAB)+NaCl
8.65
8.65 4.30
Water (d )/ Toluene(c)+ +SDS+(80% w/w CTAB)+NaCl
CTAB in water (d) / Toluene(c)+SDS+MgS04
0 2 4 6 8 10 12
0 2 4 6 8
d(mm)
t1
(s
)
Water (d) / Tolue ne(c) SDS+MgSo4 20% w /w CTAB 40% w /w CTAB 60% w /w CTAB 80% w /w CTAB
Figure 11. First coalescence time for system with mixed surfactant (SDS+CTAB)
and single salt (MgSO4) versus drop size and weigh percent of CTAB.
CTAB in Water (d) / Toluene(c)+SDS+MgSo4
0 5 10 15 20 25
0 2 4 6 8
d(mm)
t2
(s
)
Water (d) / Toluene(c) SDS+MgSo4
20% w /w CTAB 40% w /w CTAB 60% w /w CTAB 80% w /w CTAB
Figure 12. Partial coalescence time for system with mixed surfactant (SDS+CTAB)
CTAB in Water (d) / Toluene(c)+SDS+MgSo4
0 5 10 15 20 25 30
0 2 4 6 8
d(mm)
t(
s
)
Water (d) / Toluene(c) SDS+MgSo4
20% w /w CTAB 40% w /w CTAB 60% w /w CTAB 80% w /w CTAB
Figure 13. Total coalescence time for system with mixed surfactant (SDS+CTAB)
and single salt (MgSO4) versus drop size and weigh percent of CTAB.
As observed in Table 3, for 80%(w/w) of CTAB, the first step coalescence time increased compared to the system of water and toluene and also the system with (SDS+MgSO4). For this amount of CTAB,
partial coalescence did not occur. For other weigh percents, partial coalescence also decreased, which was more obvious for
40%(w/w).Total coalescence time was decreased for percents of 20, 40 and 80 which was more obvious at 40 weigh percent. Overall, the comparison between Tables 2 and 3 revealed that drop size was decreased soundly for the system containing MgSO4 and
total coalescence time was increased as well.
Table 3. Coalescence times for system with mixed surfactant (SDS+CTAB) and single salt (MgSO4)
Ave. total coalescence
time (s) Ave. partial
coalescence time (s) Ave. first
coalescence time (s) Mean drop
size (mm) Chemical system
10.32 5.41
4.91 4.76
Water (d) / Toluene(c)
11.51 7.19
4.32 5.00
Water(d)/Toluene(c)+SDS+MgO4
8.35 4.94
3.41 5.59
Water (d) / Toluene(c)
+SDS+(20% w/w CTAB)+ MgSO4
5.00 2.54
2.46 4.63
Water (d) / Toluene(c)
+SDS+(40% w/w CTAB) + MgSO4
23.11 19.32
3.79 4.63
Water (d) / Toluene(c)
+SDS+(60% w/w CTAB) + MgSO4
6.59
6.59 4.14
Water (d) / Toluene(c)
Iranian Journal of Chemical Engineering, Vol. 6, No. 4 83 d) System with mixture of two surfactants and
two salts:
As seen in previous sections, it was observed that CTAB behaved more actively with respect to SDS, so did MgSO4 in comparison
to NaCl. For the previously examined system containing SDS and MgSO4, we add
simultaneously CTAB and NaCl, each one with weigh percent ratios of 20, 40, 60 and 80 with respect to the first surfactant or first salt.
The initial amounts of both SDS and MgSO4
were 0.008 gr.
Table 4 explains the results. Adding CTAB
and NaCl reduced drop sizes compared to the system containing SDS & MgSO4 and also the
pure system of water and toluene.
Also, all coalescence times including first, partial and overall steps were reduced at weigh ratios of 0.2, 0.4 and 0.6.
It was concluded that CTAB reduced droplet diameter together with rigidifying it, which increased coalescence time at high weigh percent (80 %). This result is supported by those expressed in Table 2 regarding NaCl as the second salt. The results are shown in Figs. 14 to 16.
Table 4. Coalescence times for system with mixed surfactant (SDS+CTAB) and mixed salts (MgSO4+NaCl)
Ave. total coalescence time
(s) Ave. partial
coalescence time (s) Ave. first
coalescence time (s) Mean drop
size (mm) Chemical system
10.32 5.41
4.91 4.76
Water (d) / Toluene(c)
11.51 7.19
4.32 5.00
Water(d)/SDS+MgSO4/Toluene(c)
8.56 5.03
3.53 4.57
Water (d) / SDS+MgSo4+20%w/w
CTAB+20% w/w NaCl / Toluene(c)
8.96 5.12
3.84 4.66
Water (d) / SDS+MgSo4+40% w/w
CTAB+40% w/w NaCl / Toluene(c)
6.93 4.65
2.28 4.62
Water (d) / SDS+MgSo4+60% w/w
CTAB+60% w/w NaCl / Toluene(c)
19.96 12.02
7.94 4.29
Water (d) / SDS+MgSo4+80% w/w
CTAB+80% w/w NaCl / Toluene(c)
NaCl and CTAB in Water and Tolue ne +SDS+M gSo4
0 2 4 6 8 10 12
0 2 4 6 8
d(mm)
t1
(s
)
Wate r (d) / Tolue ne (c) SDS+MgSo4 20% w /w (NaCl & CTAB)
40% w /w 60% w /w 80% w /w
Figure 14. First coalescence time versus drop size for system water (d) /
NaCl and CTAB in Water and Toluene+SDS+MgSo4
0 5 10 15 20 25
0 2 4 6 8
d(mm)
t2
(s
)
Water (d) / Toluene(c) SDS+MgSo4 20% w /w (NaCl & CTAB) 40% w /w 60% w /w 80% w /w
Figure 15. Partial coalescence time versus drop size for system water (d) /
(SDS + CTAB) + (MgSO4 + NaCl) / toluene(c).
NaCl and CTAB in Water and Tolue ne+SDS+MgSo4
0 5 10 15 20 25 30 35
0 2 4 6 8
d(mm)
t(
s
)
Water (d) / Toluene(c) SDS+MgSo4 20% w /w (NaCl & CTAB) 40% w /w 60% w /w
80% w /w
Figure 16. Total coalescence time versus drop size for system water (d) /
(SDS + CTAB) + (MgSO4 + NaCl) / toluene(c).
Conclusion
It was observed that the nature of surfactant and salt influenced the drop diameter and coalescence time in the water (d) / toluene(c) system as a model system. The results are as follows:
- Drop size increased for the system with SDS+ NaCl and SDS + MgSO4 contrary
to the system with CTAB+NaCl and CTAB + MgSO4. This trend was
Iranian Journal of Chemical Engineering, Vol. 6, No. 4 85
cationic CTAB relative to anionic SDS.
- For the case of mixed surfactants, with single salt, it was observed that partial coalescence was suppressed in the
system containing (SDS+CTAB) +
MgSO4 in comparison to the case of
NaCl.
On the other hand, drop size decreased and total coalescence time increased. It may be due to the difference between anions and cations of the two salts.
- For mixed surfactants and mixed salts, drop size and coalescence time decreased.
References
[1] Lin, C. Y., Slattery, J. C., “Thinning of a liquid film as a small drop or bubble approaches fluid-fluid interface”, AIChE J., 28, 786, (1982).
[2] Davies, G.A., in: J.D.Thornton (Ed.), Science and Practice of Liquid- Liquid Extraction, Vol. 1, Oxford, London, (1992).
[3] Ban, T., Kawaizumi, F., Nii, S., Takahashi, K., “Study of drop coalescence behavior for liquid-liquid extration operation”, Chem. Eng. Sci, 55, 5385, (2000).
[4] Narsimhan, G., Goel, P., “Drop coalescence during emulsion formation in a high-pressure homogenizer for tetradecane-in-water emulsion stabilized by sodium dodecyl sulfate”, J. Colloid Interface Sci., 238, 420, (2001).
[5] Lobo, L., Svereika, A., “Coalescence during emulsification:2. role of small molecule surfactants”, J. Colloid Interface Sci., 261, 498, (2003).
[6] Tadros, T. F., Applied Surfactants, Principles and Applications, Wiley VCH, Weinheim, (2005).
[7] Khadbiv-Parsi, P., Ph.D.Thesis, “Suggestion and analysis of new correlation in the
drop-interface coalescence and the Droplet dispersion bed phenomena”, University of Tehran (2001).
[8] Khadiv-Parsi, P., Moosavian, M.A.,
“Suggestion of new correlation for drop/interface coalescence phenomena in the absence and presence of single surfactant”, Iran. J. Chem. & Chem. Eng., 23, 79, (2004).
[9] Porras, M., Solans, C., Gonzalez, C. Martinez, A., Guinart, A. Gutierrez, J. M.,
“Studies of formation of W/O nano-dmulsion”, Colloids Surfaces A: Physicochemcal Eng. Aspects, 249, 115, (2004).
[10] Izquierd, P. I, Feng, J., Esquena, J., Tadros, T. F., Dederen, J. C., Garcia, M. J., Azemar, N. A., Solans, C., “Role of surfactant mixing ratio on nano-emulsion formation and stability”, J. Colloid Interface Sci., 285, 388, (2005).
[11] Khadiv-Parsi, P., Moosavian, M. A., “The influence of bicomponent mixed surfactants on drop/interface coalescence”, Iran. J. Chem & Chem. Eng., 23, 89, (2004).
[12] Palazolo, G. G., Sorgentini, D. A., Wagner, J. R., “Coalescence and flocculation in O/W emulsions of native and denatured whey soy proteins in comparison with soy protein isolates”, Food HydroColloids, 19, 595, (2005).
[13] Urum, K., Pekdemir, T., Ross, D., Grigson, S., “Crude oil contaminated soil washing in air sparging assisted stirred tank reactor using biosurfactants”, Chemo-sphere, 60,334, (2005).
[14] Priyadarsini, K. I., Mohan, H., “Effect of NaCl on the spectral and kinetic properties of cresyl violet (CV)- sodium dodecyl sulphate (SDS) complex”, J. Chem. Sci. 115, 299, (2003).
[15] Urbina-Villalba, G., Garcia-Sucre, M.,
stability of oil/water emulsion towards flocculation and coalescence”, Colloids surfaces A: Physicochemical Eng. Aspects, 190, 111, (2001).
[16] Koh, A., Gillies, G., Gore, J., Saunders, B. R., “Flocculation and coalescence of oil - in - water poly (dimethylsiloxane) emulsions”, J. Colloid Interface Sci., 227, 390, (2000). [17] Bart, H.-J., Berger, R., Misek, T., Slater, M.
J., ShrÖter, J., Wachter, B., in: J.C. Godfrey, M.J. Slater(Eds.), Liquid-Liquid Extraction Equipment, John Wiley and Sons, New York, (1994).