Research Article
Increasing Operating Room Profits and
Decreasing Wait Lists by Use of a Data-Driven
Overbooking Model
© 2018 Sadeghzadeh et al; licensee Iran University of Medical Sciences. This is an open access article distributed under a Creative Commons Attribution-NonCommercial 3.0 Unported License (http://creativecommons.org/licenses/by/3.0), which allows unrestricted use, distribution, and reproduction in any medium, as long as the original work is cited properly.
Background and Objectives
Operating rooms (ORs) are precious resources in hospitals, as they generate more than 40% of the hospital revenues.1 As such, surgical cancellations are very costly to hospitals.
The literature has documented varying degrees of cancellations both prior and on the day of the surgery.2-7 Reasons for same-day surgery cancellations are varied and include lack of beds, lack of theatre time, staffing issues, list transfer, equipment issues, patient not turning up, patient medical reason, patient not ready, change in surgical plan, insufficient pre-operative work-up, surgeon being overbooked, surgery running late, patient refusing the surgery, or relatives of patient not available.5,7-9
Some elective surgeries may be cancelled for various
*Corresponding Author:Somayeh Sadat, Cancer Care Ontario, In-formatics Department, Ontario, Canada, Tel: +982182884378, Fax: +987153232844, E.mail: [email protected]
Hajar Sadeghzadeh
1, Somayeh Sadat
2*1Health Systems Engineering, Faculty of Industrial and Systems Engineering, Tarbiat Modares University, Tehran, Iran. 2Cancer Care Ontario, Informatics Department, Ontario, Canada.
Background and Objectives: Operating rooms (ORs) are precious resources in hospitals, as they constitute more than 40% of the hospital revenues. As such, surgical cancellations are very costly to hospitals. Same-day surgery cancellations or no-shows were found to be the main contributing factor to underutilization of ORs in a public-sector hospital despite the existence of long surgical wait lists.
Methods: To demonstrate the feasibility of overbooking surgical procedures, a Monte-Carlo simulation model to predict unused OR time was built and validated using 6 months of historical data. We first fitted statistical distributions to the random parameters, using Easyfit© software. Then, a surgical case-mix optimization problem was formulated to prescribe the surgeries for overbooking that maximize the profits over the predicted unused OR time. The optimization model was solved both deterministically based on average historical surgery durations using Lingo software package and heuristically by taking into account the random nature of surgical durations using Risk Solver Platform© add-on to Microsoft Excel.
Findings: We conducted simulation-optimization of the stochastic model for the three selected dates. Results show significant improvements over the base case of no overbooking. The increases in the average surgical profits due to overbooking on three randomly selected dates were 89%, 36%, 93%.
Conclusions: To the best of our knowledge, this study is the first applied demonstration of descriptive, predictive, and prescriptive analytics to improve surgical operations through overbooking. The analysis shows significant opportunities in generating surgical profits (36%-93% on randomly selected validation dates) and reducing average wait times (by 4.16 weeks) without risking OR overtime.
Keywords: Case-Mix problem, No-shows, Surgical Overbooking, Monte Carlo Simulation, Wait times
Abstract
reasons prior to the scheduled day of surgery (up to the day before). These cancellations are referred to as
in-advance cancellations throughout the rest of this paper.
There are also same-day elective surgery cancellations with no prior notification because the patient does not show up (i.e. no-shows) or the patient is not clinically or otherwise suite for the surgery anymore (e.g. due to deterioration of health or the realization that certain medicines the patient is still taking should have been discontinued prior to the surgery), or less commonly due to the fact that the patient has recovered to the point that the surgery is not required anymore.
Typically, there are also a number of same-day
add-on completed surgeries which have not been scheduled
beforehand by the scheduling clerk. These are completed with no prior notification of the scheduling clerk and are coordinated directly through the surgeon. In fact, from the perspective of the scheduling clerk, these are similar to
Int J Hosp Res 2018, Volume 7, Issue x
Descriptive Data Analytics
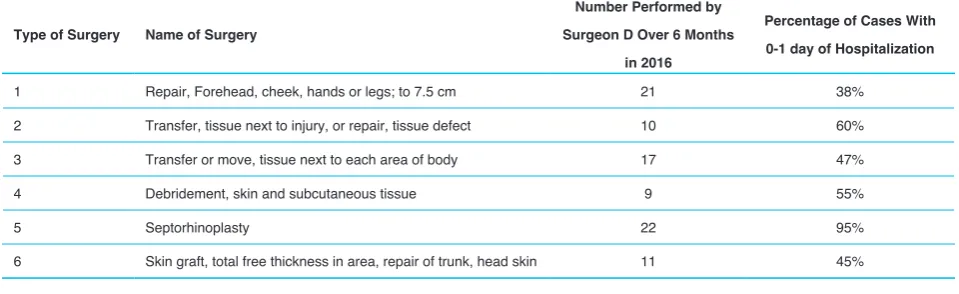
The first analysis we conducted was on the wait list data. Using aggregate levels of the number of surgeries performed by each surgeon, we were able to estimate the average wait times of patients on each surgeon’s wait list by using equation 1 (with the terms in bracket showing the unit of measurement):
Our analysis of average wait times showed significant variations among the surgeons, with the wait times ranging from 0 week to 35 weeks, with an average wait time of 6.9 weeks among all surgeons (see Figure 2). This analysis allowed us to identify the surgeons whose wait lists are large enough that could potentially benefit best from overbooking, as they satisfy the condition of existing backlogged demand. Specifically, surgeons I and D were identified as potential candidates.
A detailed analysis of OR utilization throughout the day shift (using the start and end times of completed operations) was conducted for every day of the week over the course of 6 months. A utilization of 100% shows that all 6 ORs were used throughout the shift. Table 2 shows average OR utilization by day of the week based on the 6 months data received from the hospital. The hospital only performs elective operations 6 days per week.
outpatient clinics.
This study was motivated by underutilization of ORs in spite of long wait lists for elective surgeries in a public sector hospital. At the hospital under study, elective surgeries are typically scheduled by a scheduling clerk. The hospital has 6 ORs dedicated to elective surgeries and thirteen surgeons of various specialties who each perform elective surgeries on specific days of the week. Descriptive data analytics conducted on 6 months of data obtained from the teaching hospital under the study revealed high levels of same-day cancellations for some surgeons and days of the week, to the extent that could not be compensated by same-day add-on surgeries. It was noted by the scheduling clerk that these same-day cancellations are a pure result of patients not showing up or not needing or suitable for the surgery anymore, and not a result of organizational challenges such as a lack of beds for these patients; as these organizational challenges, if occurred, are dealt with the day before the day of the surgery at the latest and are captured under the in-advance surgical cancellations.
Our paper considers overbooking of electives surgeries as a potential solution to compensate for same-day cancellations or no-shows in a public sector teaching hospital. Overbooking has been a successful strategy in many industries, most notably the airline industry,10-17 and hotel/accommodation industry.18-21 Weatherford and Bodily provides a good review of overbooking.22
Generally, overbooking in healthcare is different from the transportation and hospitality industry and are relatively limited and mainly focused on studying overbooking scheduling in healthcare clinics to improve patient access.23-33
To the best of our knowledge, this is the first study that demonstrates the value of overbooking in the elective surgical domain to compensate the detrimental effects of same-day elective surgical cancellations. This study presents a novel data-driven analytics approach to compensate for same-day surgical cancellations at the hospital under study and increase surgical profits.
Methods
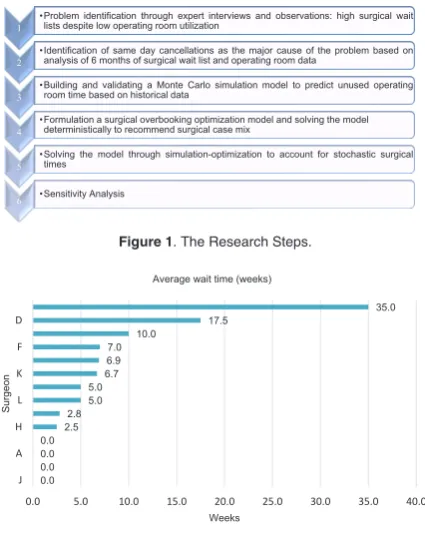
Figure 1 shows a schematic representation of our
research steps.
The Data
We received detailed data from four different sources within the hospital for a 6-month period from April to September 2016. Data types are summarized in the
following table (Table 1). 3 | P a g e
1 •Problem identification through expert interviews and observations: high surgical waitlists despite low operating room utilization
2 •Identification of same day cancellations as the major cause of the problem based onanalysis of 6 months of surgical wait list and operating room data
3 •Building and validating a Monte Carlo simulation model to predict unused operatingroom time based on historical data
4 •Formulation a surgical overbooking optimization model and solving the model deterministically to recommend surgical case mix
5 •Solving the model through simulation-optimization to account for stochastic surgicaltimes
6 •Sensitivity Analysis
Figure 1. The Research Steps.
5 | P a g e 0.0 0.0 0.0 0.0 2.5
2.85.0 5.06.7
6.9 7.0 10.0
17.5 35.0
0.0 5.0 10.0 15.0 20.0 25.0 30.0 35.0 40.0
J A H L K F D
Weeks
Surgeon
Average wait time (weeks)
Figure 2. Average Wait Time in Weeks by Surgeon.
6 | P a g e
Average Wait Time for Each Surgeon (Weeks) =
Length of the Wait List for Each Surgeon (person)
Int J Hosp Res 2018, Volume 7, Issue x The first analysis we conducted was on the composition
of surgeries performed and cancelled using the patient identifier information to merge the information from the various sources. Figure 3 shows the average daily number of each of the above four categories by day of the week over the course of the 6 months.
As shown in Figure 3, Weekday 1 and 2 have the highest average number of same-day cancellations which are not, on average, compensated by same-day add-on surgeries. As such, Weekday 1 and 2 were identified as days of the week potentially suited to benefit from overbooking to compensate same-day cancellations.
Out of surgeons D and I who had been identified (through the length of their wait lists, as per Figure 2) as potential candidates for overbooking, Surgeon D operates on Weekday 1 (but not Weekday 2), while surgeon I does not operate on either Weekday 1 or 2. While the overbooking approach can potentially be applied for other surgeons and other days of the week, we solved our model for Surgeon
D on Weekday 1 as an example to best demonstrate the value of our solution. Figure 4 shows average number of surgeries by surgeon D on Weekday 1, demonstrating that same-day cancellation volumes on average were not compensated by same-day add-on surgeries.
Out of all the possible surgeries to overbook for a surgeon, the ideal ones have the following characteristics: i) there is a backlog demand for that surgery (waitlist) by that surgeon, ii) the surgeon is experienced in performing the specific type of surgery, iii) the patient is unlikely to need overnight hospitalization to minimize chances of surgery cancellation due to lack of beds caused from overbooking. Since our wait list information did not include the type of surgery the patient was waiting for, we did an analysis
Table 1. Data types
No. Data type
1 The wait list data for each surgeon
2 The OR booking records of the scheduling clerk
3 Data on completed surgeries over the same 6-month period of time
4 Detailed insurance billing records
Table 2: Average OR Utilization by Day of the Week
Day of Week Average OR Utilization
Weekday 1
Weekday 2
Weekday 3
Weekday 4
Weekday 5
Weekday 6
67.3%
70.0%
65.0%
71.0%
60.8%
58.5%
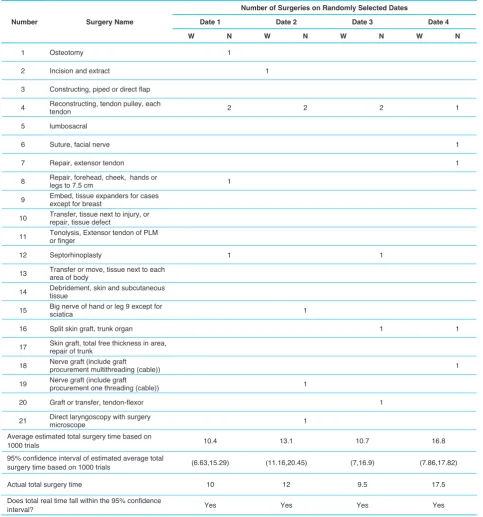
Table 3. Candidate Surgeries for Overbooking on Weekday 1s for Surgeon D
Type of Surgery Name of Surgery
Number Performed by Surgeon D Over 6 Months
in 2016
Percentage of Cases With 0-1 day of Hospitalization
1 Repair, Forehead, cheek, hands or legs; to 7.5 cm 21 38%
2 Transfer, tissue next to injury, or repair, tissue defect 10 60%
3 Transfer or move, tissue next to each area of body 17 47%
4 Debridement, skin and subcutaneous tissue 9 55%
5 Septorhinoplasty 22 95%
6 Skin graft, total free thickness in area, repair of trunk, head skin 11 45%
11 | P a g e
3 1
0 2
0 1 2 3 4 5 6 7
Surgeon D
Average Daily Volume of Performed and Cancelled Surgeries by Surgeon D on Weekday 1
Same-Day Cancellations
In-Advance Cancellation
Same-day Add-on Completed Surgeries
Pre-Scheduled Completed Surgeries
Figure 4. Average Daily Volume of Performed and Cancelled Surgeries by Surgeon D on Weekday 1.
8 | P a g e
13 14 14 13 12 12 28
5 6 6 6 6 7
12
1 2 3 2 1 1
4
6 7 4 4 4 3
12
0 10 20 30 40 50 60
Weekday
1 Weekday2 Weekday3 Weekday4 Weekday5 Weekday6 Total
Average Daily Volume of Surgeries by Day of Week
Same-Day Cancellations In-Advance Cancellations Same-Day Add-on Completed Surgeries Pre-scheduled completed surgeries
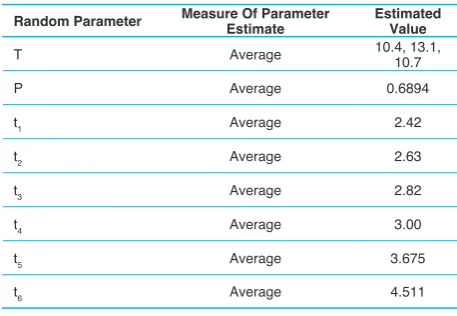
Int J Hosp Res 2018, Volume 7, Issue x Table 4. Model Validation against Historical Data for four Randomly Selected Weekday 1s
Number Surgery Name
Number of Surgeries on Randomly Selected Dates
Date 1 Date 2 Date 3 Date 4
W N W N W N W N
1 Osteotomy 1
2 Incision and extract 1
3 Constructing, piped or direct flap
4 Reconstructing, tendon pulley, each tendon 2 2 2 1
5 lumbosacral
6 Suture, facial nerve 1
7 Repair, extensor tendon 1
8 Repair, forehead, cheek, hands or legs to 7.5 cm 1
9 Embed, tissue expanders for cases except for breast
10 Transfer, tissue next to injury, or repair, tissue defect
11 Tenolysis, Extensor tendon of PLM or finger
12 Septorhinoplasty 1 1
13 Transfer or move, tissue next to each area of body
14 Debridement, skin and subcutaneous tissue
15 Big nerve of hand or leg 9 except for sciatica 1
16 Split skin graft, trunk organ 1 1
17 Skin graft, total free thickness in area, repair of trunk
18 Nerve graft (include graft procurement multithreading (cable)) 1
19 Nerve graft (include graft procurement one threading (cable)) 1
20 Graft or transfer, tendon-flexor 1
21 Direct laryngoscopy with surgery microscope 1
Average estimated total surgery time based on
1000 trials 10.4 13.1 10.7 16.8
95% confidence interval of estimated average total
surgery time based on 1000 trials (6.63,15.29) (11.16,20.45) (7,16.9) (7.86,17.82)
Actual total surgery time 10 12 9.5 17.5
Does total real time fall within the 95% confidence
interval? Yes Yes Yes Yes
of the historical surgeries performed by surgeon D to identify the high volume ones, and assumed those are the ones in demand (and as such wait listed) to check for the first condition. These surgeries also satisfied the second condition above, as the surgeon was experienced in performing them. We conducted another descriptive analysis that looked at the percentage of patients who required zero or one day of hospitalization in total for each type of surgery, to further narrow down the types of surgeries to those that satisfied the third condition above.
Table 3 shows the list of surgeries that were selected for Surgeon D, and confirmed by the surgeon as potential
good candidates for overbooking.
The Model
We need to determine the case mix of surgeries to overbook. Our goal is to maximally incentivize the surgeon financially, while not running the OR longer than the OR maximum unused time. We formulate the problem as follows:
11 | P a g e
Max ∑ (𝑆𝑆𝑆𝑆 ∗ (𝑅𝑅𝑆𝑆 − 𝐶𝐶𝑆𝑆)) − 𝑀𝑀 ∗ 𝑀𝑀𝑀𝑀𝑀𝑀(∑ 𝑆𝑆𝑆𝑆 ∗ 𝑡𝑡𝑆𝑆𝑧𝑧𝑗𝑗=1 𝑗𝑗 − 𝑀𝑀, 0) (2)
Subject to:
𝑆𝑆𝑆𝑆 = 𝑂𝑂𝑆𝑆 ∗ 𝑃𝑃
Int J Hosp Res 2018, Volume 7, Issue x The objective function seeks to maximize the profit
gained from overbooked surgeries, without letting the surgical time surpass the unused OR time (). denotes the type of surgery out of a subset of surgery types ( types of surgeries) deemed appropriate for overbooking. Selection criteria for the subset of surgeries deemed appropriate for overbooking were explained earlier and the subset of surgeries for Surgeon D was shown in Table 3. denotes the number of surgeries of type that are overbooked and can take only positive integer values. denotes fraction of pre-scheduled surgeries that are performed (i.e. one minus the fraction of same-day cancellations). denotes the number of surgeries of type that are overbooked and completed (i.e. not cancelled). denotes the revenue (i.e. tariff) from surgery type and denotes the costs of performing surgery type , which are, according to the hospital, 40% of the surgical tariff. Finally, is the duration of surgery type and is a large number to ensure that overbooked surgeries together do not take longer than the unused OR time. In other words, by assuming a large the model does not let the OR to go overtime.
As a first step of scheduling overbooked surgeries, we need to estimate unused OR time. Given the list of pre-scheduled surgeries of a day for any given surgeon (excluding in-advance cancellations) as provided by the OR scheduling clerk, the total surgery time can be calculated as:
13 | P a g e
𝑇𝑇 = 𝑃𝑃 ∗ 𝑇𝑇𝑁𝑁+ 𝑇𝑇𝑊𝑊 (3)
𝑇𝑇𝑁𝑁= ∑ 𝑡𝑡𝑖𝑖 𝑁𝑁
𝑖𝑖=1
(4)
Where is the total surgery time for a given surgeon on a given day, is the fraction of pre-scheduled surgeries that are performed (i.e. one minus the fraction of same-day cancellations), is the total surgery time for the scheduled surgeries (stands for the number of scheduled surgeries), is the total expected surgery time for all same-day add-on patients ( stands for walk-in, which is the equivalent term
to same-day add-on cases in surgery), and is the duration of surgery . Note that all time parameters include cleaning up and preparing the OR for surgeries.
To calculate T, we first fitted statistical distributions to the lengths of surgery by type of the surgery () that were performed by Surgeon D based on the 6-month data (25 Saturday comprising a total of 124 surgical cases for surgeon D), we had received from the hospital, using
EasyFit© software package. We also fitted statistical distributions to the total daily surgical time spent for add-on surgeries () performed by Surgeadd-on D, as well as the fraction of pre-scheduled surgeries that are performed (), using the same software package. The first ranked distribution for each parameter, based on the Kolmogorov-Smirnov goodness of fit test provided by EastyFit© was selected.
We, then, conducted a Monte-Carlo simulation using the Risk Solver Platform© add-on to Microsoft Excel to calculate T for four randomly selected weekday 1s over the 6-month period. We varied the number of trials and visually inspected that variations in average T stabilize around 1000 trials, as demonstrated in Figure5.
As such, we conducted 1000 trials for the four randomly selected weekday 1s to calculate the average and 95th percentile confidence interval of for each day. Given that we had the actual for each day as well (based on our historical data), we were able to validate the Monte-Carlo simulation model by confirming that the actual fell into the 95th percentile confidence interval predicted by our Monte Carlo Simulation using the fitted statistical distributions for surgery duration by type and total daily add-on surgery time.
Table4 shows the details of our model validation, where shows the number of walk-in surgeries (same-day add-on completed surgeries) and shows the number of pre-scheduled surgeries (pre-pre-scheduled completed surgeries) observed on each day.
Unused time in OR is calculated as:
15 |
P a g e
ǣ
𝐴𝐴 = 𝑈𝑈 − 𝑇𝑇 (5)
Where is the unused time available for additional surgeries to be overbooked, is the maximum allowable time in the OR, and is the total surgery time for a given surgeon on a given day as calculated in Equation 2. For the parameter , upon consultation with the OR manager and surgeon D, it was decided to set it to 16 hours, as each surgeon is supervising the operations (conducted by fellows and residents) in two ORs simultaneously, and as such has twice the duration of the shift (8 hours) in each shift available. Since T is a random parameter, would be a random parameter as well.
Table 5. Parameter Estimates Used in the Deterministic Optimization Model
Random Parameter Measure Of Parameter Estimate Estimated Value
T Average 10.4, 13.1, 10.7
P Average 0.6894
t1 Average 2.42
t2 Average 2.63
t3 Average 2.82
t4 Average 3.00
t5 Average 3.675
Int J Hosp Res 2018, Volume 7, Issue x
function, separately and by keeping other parameters constant. To analyze the sensitivity, we examine the effect of the changing two definite parameters of the model (U and M) by giving different values to each of them. Table 9 below analyzes the sensitivity of the model to the different values of these 2 parameters.
As it can be seen in Table 9, on all three dates, with an increase/decrease in U and M, % increase in average surgical profits due to overbooking also increases/ decreases, which is quite logical. We found that the model is more sensitive to the U parameter value compared to the M parameter value.
Discussion
The case study presented in this paper demonstrates the potential of increasing profits from surgery (36%-93% on randomly selected validation dates) and decreasing surgical wait lists through overbooking (by 4.16 weeks) without risking OR overtime.
Our approach does not aim to interfere with the operations or judgment of the surgeon or the OR scheduling clerk, as the surgeries scheduled by them are treated as given and used to estimate T. We only suggest the addition of some overbooked cases to compensate for potential same-day cancellations.
Since we aimed to show the potential of this approach, we used the readily available data to estimate various parameters. We also used the historical data to identify surgeries that may require a short hospitalization (0 or 1 days). In reality, the surgeon is very knowledgeable about the patients on his/her wait list and does not need to depend on this list of surgeries identified through our descriptive analysis. The surgeon should be able to assess which patients waiting for which surgeries are more likely to not need overnight stays and as such create a waiting list of “candidates for overbooking” that can be used instead of the few types of surgeries we have selected. In this way, the OR scheduling clerk should be able to enquire about available hospital beds and as such, in times of existing vacant beds, even patients with expected overnight stays may be candidates for overbooking. As such, our estimates of increased surgical profits should be treated as underestimates, because in reality there may be a larger pool of surgery types and patients appropriate for overbooking, which could result in a higher value of the objective function.
Finally, we see our solution as an inexpensive temporary solution to compensate for the high number of same-day cancellations. A more fundamental (though likely costly) solution is to look into the root causes that drive such high number of cancellations and try to improve the process To solve the model (2), we first used the average of
each of the random parameters based on a 1000 trials of the Monte-Carlo simulation model (as per Table 5) and solved the deterministic optimization model using Lingo software package for the three of the previously randomly selected Weekday 1s that had average estimated total surgery time based on 1000 trials of less than 16 hours (as per Table 4).
Table 6 shows the results of solving the model deterministically for the three selected Weekday 1s.
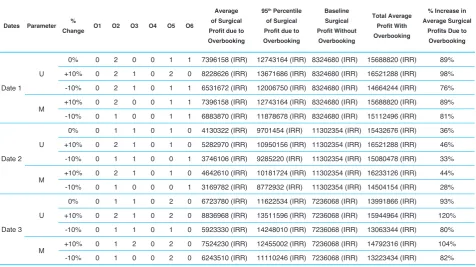
Simulation-Optimization of the Stochastic Model
We next conducted a simulation-optimization of the stochastic optimization model using the statistical distributions fitted to the random parameters of surgery durations (as per Table 7) in a Monte-Carlo simulation model run for 1000 trials. The simulation model requires values for the decision variables and since an indefinite combination of values could have been tested, we used the values obtained from the deterministic optimization model as the base values and applied a heuristic where each value was changed by minus or plus one surgery at a time.
Results
We conducted simulation-optimization of the stochastic model for the three selected Weekday 1s. The results are shown in Table 8. Results show significant improvements over the base case of no overbooking.
Since we had no detailed information on the wait list (i.e. our data lacked the type of surgery the patient is waiting for), it was difficult to fully assess the impact on the waiting list. Naturally, we assume that performing more operations would decrease the size of the waiting list. Based on the sample of the four random weekday 1s, an average total of 5 surgeries may be overbooked (using the deterministic model results). Assuming a month consists of four weekday 1s and overbooking is only implemented on weekday 1s, this results in an average of 1.25 surgeries overbooked per week. Using equation 1, we roughly estimate that this increase in the volume of performed surgeries could result in an average wait time of 13.3 weeks for surgeon D, or a 4.16 weeks of decrease in average wait times. This is of course a conservative estimate, as using the heuristic approach even more overbooked surgeries may be scheduled.
Sensitivity Analysis
Int J Hosp Res 2018, Volume 7, Issue x
Table 7. Statistical Distribution Fitted to the Random parameters of Surgery Durations
Parameters Signs: Parameters Definition Probability Distribution Function
t1 Duration of "repair, forehead, cheek; hand or legs to 7.5 cm" Gamma (12.23,0.198287)
t2 Duration of "Transfer or move, tissue next to each area of body " Gamma (9.587,0.383347)
t3
Duration of "Skin graft, Total free thickness in area, repair of trunk, head
skin; upper limb or lower limb" Gamma (19.36,0.135531)
t4
Duration of "Exploration (without repair surgery) or release artery; carotid
artery" Gamma (3.0224,1.0152)
t5 Duration of "Transfer, tissue next to injury, or repair, tissue defect" Gamma (13.256,0.34)
t6 Duration of "Septorhinoplasty" Gamma (6.62,0.4265)
Tw Total walk-in surgeries duration in a day Gamma (2.364,2.9366)
T Total surgeries duration in a day ( for calculating U) Gamma (7.1,2.26)
P Show-up percentage of pre-scheduled surgeries Weibull (5.109,0.75)
Table 6: Optimal Values of Decision Variables in the Deterministic Model
Parameter Date 1 Date 2 Date 3
Number of surgery type 1 (O1) 0 0 0
Number of surgery type 2 (O2) 0 0 0
Number of surgery type 3 (O3) 0 0 0
Number of surgery type 4 (O4) 0 0 0
Number of surgery type 5 (O5) 1 1 2
Number of surgery type 6 (O6) 1 0 0
Surgical profit due to overbooking (value of objective function) 6755798 (IRR) 3304240 (IRR) 6563690 (IRR)
Base surgical profit (no overbooking) 8324680 (IRR) 11302354 (IRR) 7236068 (IRR)
% Increase in surgical profits due to overbooking 81% 29% 91%
Note: The profits are based on the Iranian currency (Rial).
Table 8: Results of the simulation-optimization model
Date O1 O2 O3 O4 O5 O6
Average of Surgical
Profit Due to
Overbooking
95% Percentile of
Surgical Profit due to
Overbooking
Baseline Surgical
Profit without
Overbooking
Total Average Profit
With Overbooking
% Increase in
Average Surgical
Profits Due to
Overbooking
Date 1 0 2 0 0 1 1 7396158 (IRR) 12743164 (IRR) 8324680 (IRR) 15688820 (IRR) 89%
Date 2 0 1 1 0 1 0 4130322 (IRR) 9701454 (IRR) 11302354(IRR) 15432676 (IRR) 36%
Date 3 0 1 1 0 2 0 6723780 (IRR) 11622534 (IRR) 7236068(IRR) 13991866 (IRR) 93%
15 |
P a g e
0 2 4 6 8 10 12 14 16 18 20 22 24
1 10 50 100 200 300 400 500 600 700 800 900 1000
Av
erage
Total S
urger
y
Tim
e
(T
)
Number of Trials
Int J Hosp Res 2018, Volume 7, Issue x
Table 9. The Model Sensitivity Analysis
Dates Parameter %
Change O1 O2 O3 O4 O5 O6
Average of Surgical
Profit due to
Overbooking
95th Percentile
of Surgical
Profit due to
Overbooking
Baseline Surgical
Profit Without
Overbooking
Total Average
Profit With
Overbooking
% Increase in Average Surgical
Profits Due to
Overbooking
Date 1 U
0% 0 2 0 0 1 1 7396158 (IRR) 12743164 (IRR) 8324680 (IRR) 15688820 (IRR) 89%
+10% 0 2 1 0 2 0 8228626 (IRR) 13671686 (IRR) 8324680 (IRR) 16521288 (IRR) 98%
-10% 0 2 1 0 1 1 6531672 (IRR) 12006750 (IRR) 8324680 (IRR) 14664244 (IRR) 76%
M +10% 0 2 0 0 1 1 7396158 (IRR) 12743164 (IRR) 8324680 (IRR) 15688820 (IRR) 89%
-10% 0 1 0 0 1 1 6883870 (IRR) 11878678 (IRR) 8324680 (IRR) 15112496 (IRR) 81%
Date 2 U
0% 0 1 1 0 1 0 4130322 (IRR) 9701454 (IRR) 11302354 (IRR) 15432676 (IRR) 36%
+10% 0 2 1 0 1 0 5282970 (IRR) 10950156 (IRR) 11302354 (IRR) 16521288 (IRR) 46%
-10% 0 1 1 0 0 1 3746106 (IRR) 9285220 (IRR) 11302354 (IRR) 15080478 (IRR) 33%
M +10% 0 2 1 0 1 0 4642610 (IRR) 10181724 (IRR) 11302354 (IRR) 16233126 (IRR) 44%
-10% 0 1 0 0 0 1 3169782 (IRR) 8772932 (IRR) 11302354 (IRR) 14504154 (IRR) 28%
Date 3 U
0% 0 1 1 0 2 0 6723780 (IRR) 11622534 (IRR) 7236068 (IRR) 13991866 (IRR) 93%
+10% 0 2 1 0 2 0 8836968 (IRR) 13511596 (IRR) 7236068 (IRR) 15944964 (IRR) 120%
-10% 0 1 1 0 1 0 5923330 (IRR) 14248010 (IRR) 7236068 (IRR) 13063344 (IRR) 80%
M +10% 0 1 2 0 2 0 7524230 (IRR) 12455002 (IRR) 7236068 (IRR) 14792316 (IRR) 104%
-10% 0 1 0 0 2 0 6243510 (IRR) 11110246 (IRR) 7236068 (IRR) 13223434 (IRR) 82%
in order to minimize such instances. Such root cause analysis and process improvement is the main area of future research that we see appropriate to deal with this problem.
Conclusion
This study showed a demonstration of data-driven informatics to solve the real-world problem of underutilization of ORs in spite of long wait lists in a public sector teaching hospital. Descriptive analytics was performed to reveal same-day surgery cancellations as a contributing factor to low utilization of ORs. Predictive Monte-Carlo simulation was performed to predict unused OR time based on 6 months of historical data. Prescriptive deterministic case-mix optimization problem as well as a stochastic model solved by a simulation-optimization heuristic were performed to select the surgeries for overbooking that maximize the profits over the predicted unused OR time and minimize the OR waiting lists. While overbooking services in different industries has been vastly studied, to the best of our knowledge, this is the first of such study in the elective surgical domain (and one of the few studies in health delivery settings).
The advantage of our approach over other wait time reduction approaches is a simultaneous reduction of wait times and increase in surgical profits. Our analysis showed significant opportunities in generating surgical profits and reducing average wait times for a sample surgeon in a public sector teaching hospital. Our approach can
easily be customized to other settings by fitting statistical distributions to the random parameter of the model based on other surgeons’ historical surgical data in this or other similar hospitals.
Abbreviation
(OR): operating room.
Competing Interest
The authors declare no competing interests.
Authors Contributions
The study was jointly designed by HS. SS,contributed to interpretation of results. HS was the principal researcher; however SS was the assistant professor and her guidance helped a lot. Both authors read and approved the final manuscript.
Acknowledgments
We gratefully acknowledge the employees of the hospital that the study was conducted at. We also appreciate the feedback we received in the review process that helped enhance the quality of this manuscript.
References
Int J Hosp Res 2018, Volume 7, Issue x 2. Perroca MG, Jericó Mde C, Facundin SD. Surgery
cancelling at a teaching hospital: implications for cost management. Rev Lat Am Enfermagem. 2007;15(5):1018-1024. doi:10.1590/s0104-11692007000500021
3. Argo JL, Vick CC, Graham LA, Itani KM, Bishop MJ, Hawn MT. Elective surgical case cancellation in the Veterans Health Administration system: identifying areas for improvement. Am J Surg. 2009;198(5):600-606. doi:10.1016/j.amjsurg.2009.07.005
4. Boudreau SA, Gibson MJ. Surgical cancellations: a review of elective surgery cancellations in a tertiary care pediatric institution. J Perianesth Nurs. 2011;26(5):315-322. doi:10.1016/j.jopan.2011.05.003
5. Dimitriadis PA, Iyer S, Evgeniou E. The challenge of cancellations on the day of surgery. Int J Surg. 2013;11(10):1126-1130. doi:10.1016/j.ijsu.2013.09.002 6. Smith MM, Mauermann WJ, Cook DJ, Hyder JA, Dearani
JA, Barbara DW. Same-day cancellation of cardiac surgery: a retrospective review at a large academic tertiary referral center. J Thorac Cardiovasc Surg. 2014;148(2):721-725. doi:10.1016/j.jtcvs.2014.03.002
7. Karnalkar A. Cancellation of Elective Operations on the Day of Surgery: Three Years Study. J Evid Based Med Healthc. 2015;44:7847-7852.
8. Kumar R, Gandhi R. Reasons for cancellation of operation on the day of intended surgery in a multidisciplinary 500 bedded hospital. J Anaesthesiol Clin Pharmacol. 2012;28(1):66-69. doi:10.4103/0970-9185.92442
9. Kaddoum R, Fadlallah R, Hitti E, El-Jardali F, El Eid G. Causes of cancellations on the day of surgery at a Tertiary Teaching Hospital. BMC Health Serv Res. 2016;16:259. doi:10.1186/s12913-016-1475-6
10. Amaruchkul K, Sae-Lim P. Airline overbooking models with misspecification. Journal of Air Transport Management. 2011;17(2):143-147.
11. Chen L, Homem-de-Mello T. Re-solving stochastic programming models for airline revenue management. Ann Oper Res. 2010;177(1):91-114. doi:10.1007/s10479-009-0603-7
12. Lindenmeier J, Tscheulin DK. The effects of inventory control and denied boarding on customer satisfaction: The case of capacity-based airline revenue management. Tour Manag. 2008;29(1):32-43. doi:10.1016/j.tourman.2007.04.004 13. Klophaus R, Pölt S. Airline overbooking with dynamic
spoilage costs. Journal of Revenue and Pricing Management. 2007;6(1):9-18. doi:10.1057/palgrave.rpm.5160059
14. Suzuki Y. The net benefit of airline overbooking. Transportation Research Part E: Logistics and Transportation Review. 2006;42(1):1-19.
15. Chatwin RE. Continuous-time airline overbooking with time-dependent fares and refunds. Transp Sci.
1999;33(2):182-191. doi:10.1287/trsc.33.2.182
16. Belobaba PP. Survey Paper—Airline yield management an overview of seat inventory control. Transp Sci. 1987;21(2):63-73. doi:10.1287/trsc.21.2.63
17. Rothstein M. OR Forum—OR and the airline overbooking problem. Oper Res. 1985;33(2):237-248. doi:10.1287/ opre.33.2.237
18. Toh RS, Dekay F. Hotel room-inventory management: an overbooking model. Cornell Hotel Restaur Adm Q. 2002;43(4):79-90. doi:10.1016/S0010-8804(02)80044-1 19. Hwang J, Wen L. The effect of perceived fairness toward
hotel overbooking and compensation practices on customer loyalty. Int J Contemp Hosp Manag. 2009;21(6):659-675. doi:10.1108/09596110910975945
20. Noone BM, Lee CH. Hotel overbooking: The effect of overcompensation on customers’ reactions to denied service. J Hosp Tour.Res. 2011;35(3):334-357. doi:10.1177/1096348010382238
21. Jencková J, Abrhám J. Smart overbooking in the accommodation facilities in the Czech Republic. Journal of International Studies. 2016;9(1):265-275.
22. Weatherford LR, Bodily SE. A taxonomy and research overview of perishable-asset revenue management: Yield management, overbooking, and pricing. Oper Res. 1992;40(5):831-844. doi:10.1287/opre.40.5.831
23. Kim S, Giachetti RE. A stochastic mathematical appointment overbooking model for healthcare providers to improve profits. IEEE Transactions on Systems, Man, and Cybernetics-Part A: Systems and Humans. 2006;36(6):1211-1219. doi:10.1109/TSMCA.2006.878970
24. Salemi Parizi M, Ghate A. Multi-class, multi-resource advance scheduling with no-shows, cancellations and overbooking. Comput Oper Res. 2016;67:90-101. doi:10.1016/j.cor.2015.09.004
25. LaGanga LR, Lawrence SR. Clinic overbooking to improve patient access and increase provider productivity. Decis Sci. 2007;38(2):251-276. doi:10.1111/j.1540-5915.2007.00158.x 26. LaGanga LR, Lawrence SR. Appointment overbooking
in health care clinics to improve patient service and clinic performance. Prod Oper Manag. 2012;21(5):874-888. doi:10.1111/j.1937-5956.2011.01308.x
27. Huang YL. Redefining Policies to Reduce the Negative Effects of Patient No-Show. IIE Annual Conference. Proceedings. Institute of Industrial and Systems Engineers (IISE); 2011.
28. Kros J, Dellana S, West D. Overbooking increases patient access at East Carolina University’s student health services clinic. Interfaces. 2009;39(3):271-287. doi:10.1287/ inte.1090.0437
Int J Hosp Res 2018, Volume 7, Issue x 2008;40(9):820-837. doi:10.1080/07408170802165823
30. Daggy J, Lawley M, Willis D, et al. Using no-show modeling to improve clinic performance. Health Informatics J. 2010;16(4):246-259. doi:10.1177/1460458210380521 31. Fan Z, Xie X, Sanchez RA, Zhong X. Overbooking for
Specialty Clinics with Patient No-Shows: A Queueing Approach. IEEE 14th International Conference on Automation Science and Engineering (CASE); 2018;20:20-24. doi:10.1109/COASE.2018.8560573
32. May FP, Reid MW, Cohen S, Dailey F, Spiegel BM. Predictive overbooking and active recruitment increases uptake of endoscopy appointments among African American patients. Gastrointest Endosc. 2017;85(4):700-705. doi:10.1016/j. gie.2016.09.001
33. Parente CA, Salvatore D, Gallo GM, Cipollini F. Using overbooking to manage no-shows in an Italian healthcare center. BMC Health Serv Res. 2018;18(1):185. doi:10.1186/ s12913-018-2979-z
Please cite this article as: