Ann. Geophys., 26, 4031–4049, 2008 www.ann-geophys.net/26/4031/2008/ © European Geosciences Union 2008
Annales
Geophysicae
Solar wind control of plasma number density in the near-Earth
plasma sheet: three-dimensional structure
D. Nagata1, S. Machida1, S. Ohtani2, Y. Saito3, and T. Mukai3 1Department of Geophysics, Kyoto University, Kyoto 606-8502, Japan
2Applied Physics Laboratory, Johns Hopkins University, Laurel, MD 20723, USA
3Institute of Space and Astronautical Science, Japan Aerospace Exploration Agency, Sagamihara, Kanagawa 229-8510, Japan Received: 30 March 2008 – Revised: 8 October 2008 – Accepted: 17 November 2008 – Published: 11 December 2008
Abstract. The plasma number density in the near-Earth plasma sheet depends on the solar wind number density and the north-south component of interplanetary magnetic field (IMFBz) with time lag and duration of several hours. We
ex-amined the three-dimensional structure of such dependences by fitting observations of plasma sheet and solar wind to an empirical model equation. Analyses were conducted sepa-rately for northward and southward IMF conditions. Effects of solar wind speed and IMF orientation were also exam-ined by further subdivision of the dataset. Based on obtaexam-ined results, we discuss (i) the relative contribution of the iono-sphere and solar wind to plasma sheet mass supply, (ii) the entry mechanisms for magnetosheath particles, and (iii) the plasma transport in the plasma sheet. We found that solar wind number density dependence is weaker and IMFBz
de-pendence is stronger for faster solar wind with southward IMF, which suggests the contribution of ionospheric parti-cles. Further from the Earth, different interplanetary condi-tions result in different structures of solar wind dependence, which indicate different solar wind entry mechanisms: (1) southward IMF results in a strong dependence on solar wind number density in the flank high-latitude region, (2) slow so-lar wind with northward IMF leads to lower-latitude peaks of solar wind number density dependence in the flank region, (3) fast solar wind with northward IMF results in a strong de-pendence on solar wind number density at the down-tail dusk flank equator, and (4) solar wind number density dependence is stronger in the downstream of quasi-parallel bow shock. These features are attributable to (1) low-latitude dayside re-connection entry, (2) high-latitude dayside rere-connection en-try, (3) entry due to decay of Kelvin-Helmholtz vortices, and (4) diffusive entry mediated by kinetic Alfven waves, respec-tively. Effect of IMFBzand its time lags show plasma sheet
reconfiguration associated with enhanced convective
trans-Correspondence to: D. Nagata
port under southward IMF. Duration of IMFBzeffect under
northward IMF is interpreted in terms of turbulent diffusive transport.
Keywords. Magnetospheric physics (Magnetotail boundary layers; Plasma sheet; Solar wind-magnetosphere interac-tions)
1 Introduction
The sources of particles for the terrestrial plasma sheet are the fast flowing interplanetary medium, solar wind, and the terrestrial ionosphere. Both sources are known to be able to supply sufficient amount of particles to the plasma sheet (e.g. Chappell, et al., 1987; Walker et al., 2003; Moore et al., 2005). The study of mass transport in the plasma sheet from these two sources to the inner magnetosphere is a major topic in solar-terrestrial physics.
As for the ionospheric source, ion outflow from the high-latitude ionosphere strongly depends on flux of solar UV and solar wind parameters (e.g. Cully et al., 2003b). Subsequent supply of thermal ions from the high-latitude ionosphere to the central plasma sheet was estimated by particle tracing in a model electromagnetic field and in situ observations at low altitudes (e.g. Cully et al., 2003a). On the other hand, it is dif-ficult to directly observe and evaluate ion supply from solar wind to the plasma sheet. Instead, correlation between solar wind parameters and plasma sheet number density has been examined for the various solar wind conditions to examine the solar wind particle supply.
Two solar wind parameters are known to correlate with the plasma sheet number density. One is the solar wind number density and the other is the north-south component of inter-planetary magnetic field (IMFBz). The plasma sheet
20 10 0 -10 -20 Y [RE]
-30 -25 -20 -15 -10 -5 0
X [R
E
] 1000
1000
2000
2000
3000 4000
Northward IMF
(a)
Z=0R
E
20 10 0 -10 -20
Y [RE] -30
-25 -20 -15 -10 -5 0
X [R
E
] 1000
2000
30004000
Southward IMF
(b)
20 10 0 -10 -20
Y [RE] -6
-4 -20 2 4 6
Z [R
E
]
(c)
X=-10R
E
20 10 0 -10 -20
Y [RE] -6
-4 -20 2 4 6
Z [R
E
]
(d)
20 10 0 -10 -20
Y [RE] -6
-4 -20 2 4 6
Z [R
E
]
(e)
X=-20R
E
20 10 0 -10 -20
Y [RE] -6
-4 -20 2 4 6
Z [R
E
]
(f)
# of samples [5 min]
0
1000 2000 3000 4000 5000
Fig. 1. Distributions of data amount assigned for each grid for the northward and southward IMF conditions. The first row is XY distribution in the equatorial plane (Z=0RE)and lower rows are YZ distributions in theX=−10 and−20REplanes.
Bz is important to understand the variation of plasma sheet
number density under the same level of solar wind number density condition: northward IMF condition leads to cool and dense plasma sheet (Terasawa et al., 1997). There are several-hour time lags between variations of solar wind and plasma sheet and they are crucial to understand the transport path of magnetosheath particles into and through the plasma sheet (Terasawa et al., 1997; Borovsky et al., 1998).
As time advances, accumulation of data enabled re-searchers to investigate the two-dimensional structures of the equatorial plasma sheet properties in several ways. Ef-fects of IMF Bz including its duration have been
investi-gated by averaging remote and in situ observations (Wing and Newell, 2002; Wing et al., 2005; Wang et al., 2006). Tsyganenko and Mukai (2003) developed a global analytic function for plasma sheet number density, which depends on the solar wind number density, speed, and IMFBzaveraged
over 30 min before plasma sheet observations. We also ex-amined the effects of solar wind number density, IMFBz, and
its time lag simultaneously by fitting solar wind and plasma sheet observations to a local analytic function (Nagata et al., 2007).
D. Nagata et al.: Solar wind control of plasma sheet density 4033
20 10 0 -10 -20
Y [RE] -30
-25 -20 -15 -10 -5 0
X [R
E
]
0.20
0.40
Northward IMF
(a)
Z=0R
E
20 10 0 -10 -20
Y [RE] -30
-25 -20 -15 -10 -5 0
X [R
E
]
0.20
0.40
Southward IMF
(b)
20 10 0 -10 -20
Y [RE] -6
-4 -20 2 4 6
Z [R
E
]
(c)
X=-10R
E
20 10 0 -10 -20
Y [RE] -6
-4 -20 2 4 6
Z [R
E
]
(d)
20 10 0 -10 -20
Y [RE] -6
-4 -20 2 4 6
Z [R
E
]
(e)
X=-20R
E
20 10 0 -10 -20
Y [RE] -6
-4 -20 2 4 6
Z [R
E
]
(f)
n
0[/cc]
0.1 1.0
[image:3.595.100.497.61.420.2]Figure 2
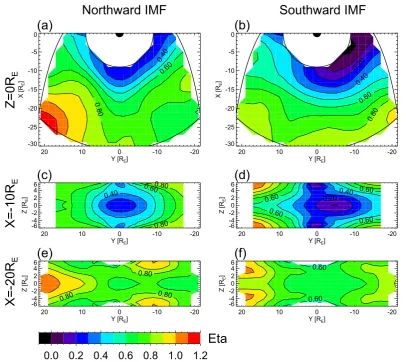
Fig. 2. Distribution of plasma number densityn0for the northward and southward IMF conditions. Format is the same as Fig. 1.
particle (Kaufmann et al., 2003, 2004, 2005, 2006). A series of their works showed that three-dimensional analysis sheds new light upon plasma sheet research.
In this paper, we examine three-dimensional structures of dependences of plasma sheet number density on solar wind number density and IMFBz by fitting the solar wind and
plasma sheet observations to an empirical model equation. Time lag and duration of IMFBzeffect are concurrently
ex-plored by optimizing the correlation coefficient of the fit. In order to resolve structures in the direction normal to the neu-tral sheet, we utilized an empirical model of neuneu-tral sheet po-sition developed by Tsyganenko and Fairfield (2004). Anal-yses were conducted separately for northward and southward IMF conditions. Dependences on solar wind speed and IMF orientation are investigated by subdivision of the dataset. Based on obtained results, we discuss (1) the contribution of ionospheric particles, (2) the entry mechanisms for mag-netosheath particles into the plasma sheet, and (3) the plasma transport in the near-Earth plasma sheet.
This paper is structured as follows. In the following sec-tion, dataset and method utilized in this study are explained.
Results of analyses are presented in Sect. 3. In Sect. 4, we discuss the limitations of analyses and the implications of re-sults. Conclusions are summarized in Sect. 5.
2 Analysis
2.1 Dataset
20 10 0 -10 -20
Y [RE]
0.0 0.1 0.2 0.3 0.4 0.5 0.6
n0
[/cc]
Z = 0 Re
20 10 0 -10 -20
Y [RE]
0.0 0.1 0.2 0.3 0.4 0.5 0.6
n0
[/cc]
Z = 4 Re
20 10 0 -10 -20
Y [RE]
0.0 0.1 0.2 0.3 0.4 0.5 0.6
n0
[/cc]
20 10 0 -10 -20
Y [RE]
0.0 0.1 0.2 0.3 0.4 0.5 0.6
n0
[/cc]
X = -10 Re
X = -20 Re
Northward IMF
Southward IMF
(a)
(b)
(c)
(d)
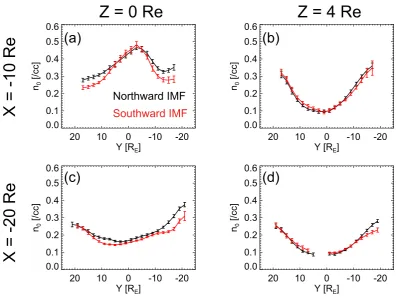
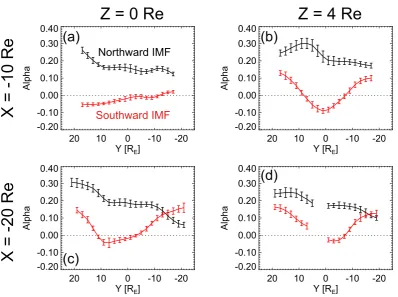
Fig. 3.Yprofiles of plasma number densityn0atX=−10 and−20REfor the northward and southward IMF conditions. Error bar is twice
of standard error.
We use the Geocentric Solar Wind (GSW) coordinate sys-tem to represent the GEOTAIL observations. The GSW co-ordinate system is analogous to the Geocentric Solar Magne-tospheric (GSM) coordinate system except that the direction of X-axis is anti-parallel to the direction of solar wind flow. For the Z-coordinate of spacecraft position, we use deviation from the model neutral sheet of Tsyganenko and Fairfield (2004). To improve statistics, all data are folded about the model neutral sheet. Our investigation is limited to the night-side (X<0RE)and the radial distance of 9 to 30REfrom the
Earth.
We use the following criteria to select plasma sheet data from GEOTAIL observations. (1) Ion temperature Tion>500 eV to exclude magnetosheath and lobe observa-tions, (2) ion flow speed |V|<100 km/s to remove magne-tosheath and fast flows such as bursty bulk flows and plas-moids. Data obtained outside of the model magnetopause (Shue et al., 1998) with solar wind ram pressure Pd=2 nPa and IMFBz=0 nT are also discarded. Plasma sheet data are
averaged over 5-min intervals.
The dataset is divided into two subsets based on the sign of IMFBzaveraged over a 10-h interval prior to the plasma
sheet observation. If the averaged IMFBz is positive, the
data is categorized as northward IMF condition. Data with negative averaged IMFBzis categorized as southward IMF
condition. Since autocorrelation time of solar wind number density is about 11 h (Borovsky et al., 1998), solar wind den-sity can be assumed to be quasi-steady within this time scale except for abrupt changes associated with discontinuities in the solar wind.
In order to examine the effects of solar wind speed and IMF orientation, we also subdivide the dataset. Subdi-visions are made for both northward and southward IMF datasets separately. Data with solar wind speed larger than 420 km/s is regarded as the fast solar wind data, and the rest of data is categorized as slow solar wind data. The value of 420 km/s is the median value of solar wind speed for our dataset. IMF orientation is evaluated by azimuth angle of IMFφimf=tan−1(by/bx), wherebx andby are X- and
Y-component of IMF, respectively. Ifφimfis positive, the data is categorized as ortho-Parker orientation, whereas negative φimf data is categorized as Parker orientation data. About 70% of the samples are Parker orientation data.
Plasma sheet data is spatially divided based on (X, Y, Z) coordinates. We set 2RE×2REgrids in XY plane. The grid
width in Z direction is 1RE. Samples within 5RE from a
grid in XY plane and within 1REin Z-direction are assigned
[image:4.595.98.496.60.357.2]D. Nagata et al.: Solar wind control of plasma sheet density 4035
20 10 0 -10 -20
Y [RE] -30
-25 -20 -15 -10 -5 0
X [R
E
]
0.40 0.60
0.80
Northward IMF
(a)
Z=0R
E
20 10 0 -10 -20
Y [RE] -30
-25 -20 -15 -10 -5 0
X [R
E
]
0.20 0.40
0.60
0.80
Southward IMF
(b)
20 10 0 -10 -20
Y [RE] -6
-4 -20 2 4 6
Z [R
E
] 0.40
0.60
0.80
0.80
(c)
X=-10R
E
20 10 0 -10 -20
Y [RE] -6
-4 -20 2 4 6
Z [R
E
] 0.200.40
0.60
0.60
0.60
0.60
(d)
20 10 0 -10 -20
Y [RE] -6
-4 -20 2 4 6
Z [R
E
]
0.80
0.80
0.80
(e)
X=-20R
E
20 10 0 -10 -20
Y [RE] -6
-4 -20 2 4 6
Z [R
E
]
0.60
0.60
(f)
Eta
0.0 0.2 0.4 0.6 0.8 1.0 1.2
[image:5.595.95.502.61.423.2]Figure 4
Fig. 4. Distributions of solar wind number density dependence parameterηfor the northward and southward IMF conditions. Format is the same as Fig. 1.
data for fitting, which is described in the following subsec-tion, in order to reduce the effect of uneven data distribution. 2.2 Method
Plasma sheet and solar wind observations are fitted to a model equation to evaluate parameters which represent the dependences of plasma sheet number density on solar wind parameters. The model equation was determined on the assumption that the plasma sheet number density depends on the solar wind number density in a power law form (Borovsky et al., 1998) and on IMFBzin a exponential form
(Terasawa et al., 1997). We did not include the factor of so-lar wind speed because the soso-lar wind number density and velocity have negative correlation and are not suitable for in-dependent variables of regression analysis. Thus we set the model equation as follows.
nps=n0(n(tsw1,t2)/nsw0)ηexp(α·b(tz1,t2)) (1)
where, nps is the plasma sheet number density. The value
of nsw0 is set to be a typical value of 5 /cc. The parame-tersn(t1,t2)
sw andb(tz1,t2)are the solar wind number density and
IMFBzaveraged fromt1h tot2h prior to each plasma sheet observation (t1=1, 2, . . . , 10 andt2=0, 1, . . . ,t1−1):
n(t1,t2)
sw (t )=
1 t1−t2
t−t2
Z
t−t1
nsw(t0)dt0 (2)
b(t1,t2)
z (t )=
1 t1−t2
t−t2
Z
t−t1
bz(t0)dt0 (3)
The parametern0represents the plasma number density un-der the condition of nsw=5/cc and IMF Bz=0 nT.
Depen-dences of plasma sheet number density on solar wind number density and IMFBzare represented by the parametersηand
α, respectively. Taking logarithm of Eq. (1), we used the following equation for the least square fit.
20 10 0 -10 -20
Y [RE]
0.0 0.2 0.4 0.6 0.8 1.0 1.2
Eta
Z = 0 Re
20 10 0 -10 -20
Y [RE]
0.0 0.2 0.4 0.6 0.8 1.0 1.2
Eta
Z = 4 Re
20 10 0 -10 -20
Y [RE]
0.0 0.2 0.4 0.6 0.8 1.0 1.2
Eta
20 10 0 -10 -20
Y [RE]
0.0 0.2 0.4 0.6 0.8 1.0 1.2
Eta
X = -10 Re
X = -20 Re
Northward IMF
Southward IMF
(a)
(b)
(c)
(d)
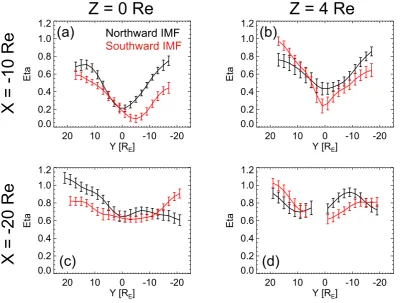
Fig. 5.Yprofiles of parameterηfor the northward and southward IMF conditions. Format is the same as Fig. 3. Error bar is Error bars 1-σ of least square fit.
To seek response time to the IMFBzeffects, we repeated the
fitting process described above for all pairs of [t1, t2] for each subset, and selected the pair of [t1, t2] which maximized the linear correlation coefficient between log(nps/nηsw)andbz.
This procedure was conducted for each grid. Coefficients of the fit shown in this paper are the results for selected pairs of [t1, t2].
3 Results
In this section we present results of fitting described in the previous section. The main advantage of our method over previous ones is the possibility to investigate three-dimensional structures. In addition to equatorial distributions of parameters, YZ cross-sections are also presented. We show here the results for the northward and southward IMF condi-tions. Results of further subdivided cases will be shown in Sect. 4.
3.1 Basic structure of the near-Earth plasma sheet
The parameter n0 represents plasma number density ex-pected under the condition ofnsw=5/cc and null IMFBz. The
distributions under the northward and southward IMF
condi-tions are similar, but have several differences (Fig. 2). In the equatorial plane (Z=0RE), plasma number density increases
closer to the Earth or the flank magnetopause. The normal-ized plasma number density is less than 0.8 /cc in the region analyzed. Maximum of plasma number density is located in the near-Earth region adjacent to the dawn terminator. The plasma number density minimizes at midnight in the distant region (X=−30RE).
There are two differences between northward and south-ward IMF conditions. First, the value of n0 is slightly (<0.1/cc) larger along the dawn flank magnetopause under northward IMF (Figs. 2a, 3a, c, and d). Second, plasma number density under southward IMF is lower in the pre-midnight region (Y=5RE)than post-midnight region around
X=−20RE (Figs. 2f and 3c), where magnetic reconnection
is thought to occur.
[image:6.595.99.500.63.366.2]D. Nagata et al.: Solar wind control of plasma sheet density 4037
20 10 0 -10 -20
Y [RE] -30
-25 -20 -15 -10 -5 0
X [R
E
]
0.16
Northward IMF
(a)
Z=0R
E
20 10 0 -10 -20
Y [RE] -30
-25 -20 -15 -10 -5 0
X [R
E
]
0.00
0.08
0.08
Southward IMF
(b)
20 10 0 -10 -20
Y [RE] -6
-4 -20 2 4 6
Z [R
E
]
0.16
0.24
(c)
X=-10R
E
20 10 0 -10 -20
Y [RE] -6
-4 -20 2 4 6
Z [R
E
]
0.00 0.00
(d)
20 10 0 -10 -20
Y [RE] -6
-4 -20 2 4 6
Z [R
E
]
0.16
(e)
X=-15R
E
20 10 0 -10 -20
Y [RE] -6
-4 -20 2 4 6
Z [R
E
]
0.00
0.00
0.08 0.08
0.08
(f)
20 10 0 -10 -20
Y [RE] -6
-4 -20 2 4 6
Z [R
E
]
(g)
X=-20R
E
20 10 0 -10 -20
Y [RE] -6
-4 -20 2 4 6
Z [R
E
]
0.00
(h)
Alpha
-0.4 -0.2 0.0 0.2 0.4
[image:7.595.98.495.60.490.2]Figure 6
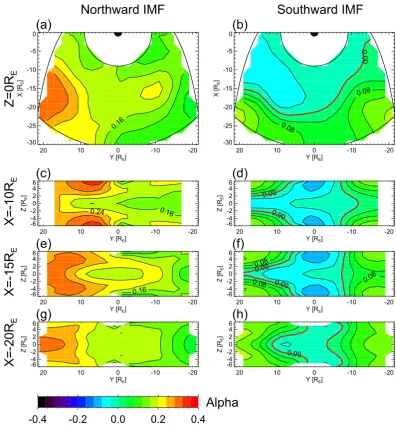
Fig. 6. Distributions of IMFBzdependence parameterαfor the northward (left) and southward (right) IMF conditions. The first row is XY
distribution in the equatorial plane (Z=0RE)and lower rows are YZ distributions in theX=−10,−15, and−20REplanes.
In the near-Earth flank region (|Y|>10RE and
X>−15RE), the plasma number density has its peak
off equator under southward IMF condition (Fig. 2d), which is not obvious under northward IMF condition (Fig. 2c). This peak is emphasized by decrease of plasma number density at the equator rather than increase of plasma number density off equator (Fig. 3a–b). In the more distant part of the flank region (X<−15RE), the peak in plasma number density is
located in the neutral sheet under both IMF conditions. In this region, the dense plasma region connecting both flanks extends toward midnight (Fig. 2e).
3.2 Dependence on solar wind number density
The parameterηrepresents the dependence of plasma sheet number density on solar wind number density. A large value ofηmeans a sensitive response of the plasma sheet number density to the solar wind number density variation. Physical interpretation ofηwill be discussed in Sect. 4 in association with the mass source of plasma sheet. Here, we merely de-scribe the distribution ofηand its differences between north-ward and southnorth-ward IMF conditions.
20 10 0 -10 -20
Y [RE]
-0.20 -0.10 0.00 0.10 0.20 0.30 0.40
Alpha
20 10 0 -10 -20
Y [RE]
-0.20 -0.10 0.00 0.10 0.20 0.30 0.40
Alpha
20 10 0 -10 -20
Y [RE]
-0.20 -0.10 0.00 0.10 0.20 0.30 0.40
Alpha
20 10 0 -10 -20
Y [RE]
-0.20 -0.10 0.00 0.10 0.20 0.30 0.40
Alpha
Z = 0 Re
Z = 4 Re
Northward IMF
Southward IMF
X = -10 Re
X = -20 Re
(a)
(b)
(c)
(d)
Fig. 7.Y profiles of IMFBzdependence parameterαfor the northward and southward IMF conditions. Format is the same as Fig. 3. Error
bar is Error bars 1-σ of fit.
between distributions of η in the equatorial plane for the northward and southward IMF conditions. First, the value ofηis larger in the near-Earth region (X>−15RE)for the
northward than southward IMF condition (Fig. 5a) and theY profile ofηis roughly symmetric for northward IMF whereas the dawn-dusk asymmetry of ηin the near-Earth region is strengthened under southward IMF condition. Second, in the more distant plasma sheet (X<−20RE), the value of ηis
larger in the dusk flank region than the dawn flank region for northward IMF whereas the distribution is more dawn-dusk symmetric for southward IMF (Fig. 5c).
As for the three-dimensional structure, we found several features which were not observable in the equatorial plane. Although the parameterηis basically smaller at lower lati-tude, there are local minima ofηat the high latitude of the midnight region (Fig. 4c–d). These local minima are more prominent and have negatively larger values for southward IMF. Their positions are shifted a few Earth radii toward dusk. This fact reminds us that the auroral expansion most frequently initiates around 23:00 MLT (Frey et al., 2004). Thus, this feature is attributable to auroral outflow that sup-plies non-solar wind origin particles, which makes the solar wind number density dependence weak. This topic will be mentioned later in this section from a viewpoint of IMFBz
dependence of plasma sheet number density.
In the dusk flank region, the value ofη has its peak off equator for southward IMF (Fig. 4e) and the peak is located at the equator for northward IMF (Fig. 4f). The value ofη is comparable for both IMF conditions although the position is different. In the dawn flank region, on the other hand, the value ofη does not maximize at the equator for both IMF conditions. These features will be interpreted from a per-spective of magnetosheath particle entry in Sect. 4.
3.3 Dependence on IMFBz
The parameterαrepresents the dependence on IMFBz. A
positive value ofαmeans that plasma sheet is denser for the larger IMFBz, whereas negative α means that the plasma
sheet number density increases for the more negative value of IMFBz. The distribution ofαis totally different for each
IMF condition (Figs. 6 and 7). The value ofαis positive in the whole plasma sheet under northward IMF, whereas the value ofαis negative in the near-Earth region under south-ward IMF. Thus, plasma number density increases every-where in the plasma sheet for northward IMF every-whereas both increases and decreases of plasma number density occur un-der southward IMF.
[image:8.595.100.499.58.355.2]D. Nagata et al.: Solar wind control of plasma sheet density 4039
t2
20 10 0 -10 -20
Y [RE]
-30 -25 -20 -15 -10 -5 0
X [R
E
]
2
Time Lag of IMF Effect
(a)
Z=0R
E
Northward IMF
t1 - t2
20 10 0 -10 -20
Y [RE]
-30 -25 -20 -15 -10 -5 0
X [R
E
]
4
6
6
6
8
Duration of IMF Effect
(b)
t2
20 10 0 -10 -20
Y [RE]
-6 -4
-20
2 4 6
Z [R
E
]
(c)
X=-10R
E t1 - t2
20 10 0 -10 -20
Y [RE]
-6 -4
-20
2 4 6
Z [R
E
]
4
6
(d)
20 10 0 -10 -20
Y [RE]
-6 -4
-20
2 4 6
Z [R
E
]
(e)
X=-20R
E
20 10 0 -10 -20
Y [RE]
-6 -4
-20
2 4 6
Z [R
E
]
4
4 4
(f)
Time [hour]
[image:9.595.100.498.70.447.2]0
2
4
6
8
10
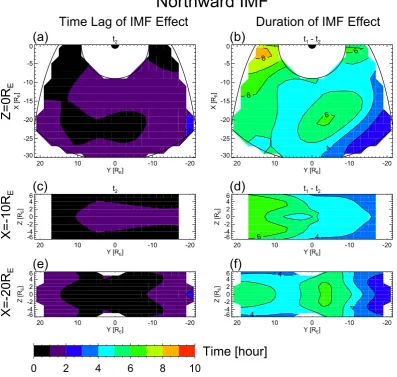
Fig. 8. Distributions of time lag and duration of IMFBzeffect for northward IMF condition. Format is the same as Fig. 1.
largely increases with the decreasing value of IMFBz. This
feature is consistent with the previous interpretation that au-roral outflow results in smaller value of ηbecause the au-roral outflow is more intense under southward IMF condi-tion (Cully et al., 2003). The region of negativeαis located around midnight and extends to the pre-midnight near-Earth region. In the flank region, the value ofαis positively larger at the higher latitude region and magnitude is almost dawn-dusk symmetric for southward IMF (Fig. 7b).
Under northward IMF, the value ofαis larger in the dusk region. The value ofαis larger at the equator in the dusk region forX<−15RE(Fig. 6g) whereas it is larger off
equa-tor in the region ofX>−15RE (Fig. 6c, e). The position
of the peak also shifts toward the midnight meridian and it is roughly aligned with magnetic field line. A similar field-aligned structure of cold dense plasma only in the dusk flank region is realized in the test particle simulation within global MHD field (T. E. Moore, private communication). On the other hand, the value ofαis small and minimizes at the
equa-tor along the dawn flank. This means that dawn side flank plasma sheet is less relevant thus more stable to variations of IMFBz.
3.4 Time lag and duration of IMF effect
The parameterst1andt2 represent the longest and shortest time length relative to plasma sheet observations between which the solar wind parameters are averaged to optimize the correlation between normalized plasma number density and IMFBz. In other words, the IMFBz condition within
t2h before the plasma sheet observations does not have close relation to the observed plasma sheet number density. Thus, the parametert2is interpreted as the shortest time lag of IMF Bzinfluences to appear. Similarly, the values of IMFBzprior
t2
20 10 0 -10 -20
Y [RE] -30
-25 -20 -15 -10 -5 0
X [R
E
]
2
2
4
Time Lag of IMF Effect
(a)
Z=0R
E
Southward IMF
t1 - t2
20 10 0 -10 -20
Y [RE] -30
-25 -20 -15 -10 -5 0
X [R
E
] 4
4
Duration of IMF Effect
(b)
t2
20 10 0 -10 -20
Y [RE] -6
-4 -20 2 4 6
Z [R
E
]
2
2
4
(c)
X=-10R
E t1 - t2
20 10 0 -10 -20
Y [RE] -6
-4 -20 2 4 6
Z [R
E
] 4
(d)
20 10 0 -10 -20
Y [RE] -6
-4 -20 2 4 6
Z [R
E
]
2
2
2
(e)
X=-20R
E
20 10 0 -10 -20
Y [RE] -6
-4 -20 2 4 6
Z [R
E
]
(f)
Time [hour]
[image:10.595.99.496.69.442.2]0
2
4
6
8
10
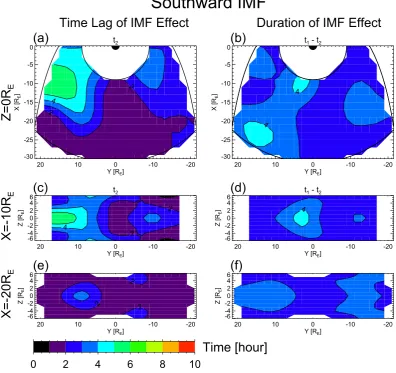
Fig. 9. Distributions of time lag and duration of IMFBzeffect for southward IMF condition. Format is the same as Fig. 8.
Distributions of time lag and duration of IMF Bz effect
are drastically different for the two IMF conditions (Figs. 8 and 9). Under northward IMF, the value oft2is short and ranges less than 2 h. The value is smaller at higher latitude of flank in the near-Earth region and it also minimizes at mid-night atX<−20RE. Because auto-correlation time of IMF
Bzis about 100 min (Borovsky et al., 1998), this difference
is within error and not conclusive. The duration of IMFBz
effect represented byt1−t2 ranges from 2 to 9 h and has its minimum downtail of the dawn flank (X<−17RE)and its
maximum at the near-Earth dusk flank (X>5RE). There is
also a local maximum around (X,Y )=(−20,−3)RE.
Under southward IMF, the value oft2ranges up to 6 h and the value oft1−t2 is rather uniform and is about 3 h. The value of t2 is as small as 1 h atr>25RE in the midnight
near-Earth region. This time scale is comparable to the cross-polar-cap convection time in the ionosphere (Borovsky et al., 1998). The value oft2increases toward the near-Earth flanks under southward IMF. The distribution oft2is roughly mirror
symmetric with respect to the noon-midnight meridian with larger value in the dusk side.
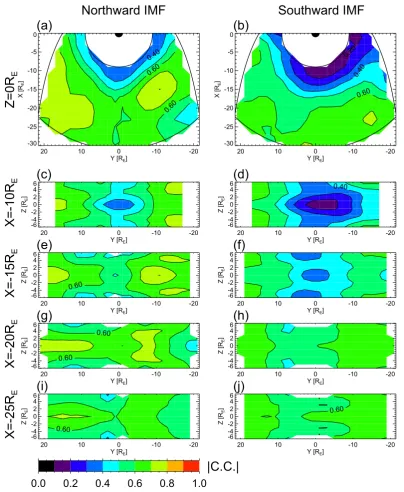
3.5 Correlation coefficient of fit
The distribution of absolute value of correlation coefficient of the fit is shown in Fig. 10. The value of correlation coefficient decreases toward the Earth and its distributions are almost similar to that ofη. The value ranges from less than 0.8 and is as low as 0.1 in the near-Earth dawn region. This means that less than 60% of number density variation in the plasma sheet is explained by our modeling. Various sources of errors are discussed in Sect. 4.1
4 Discussion
D. Nagata et al.: Solar wind control of plasma sheet density 4041
20 10 0 -10 -20
Y [RE] -30
-25 -20 -15 -10 -5 0
X [R
E
]
0.40
0.60
0.60
Northward IMF
(a)
Z=0R
E
20 10 0 -10 -20
Y [RE] -30
-25 -20 -15 -10 -5 0
X [R
E
]
0.20
0.40
0.60
Southward IMF
(b)
20 10 0 -10 -20
Y [RE] -6
-4 -20 2 4 6
Z [R
E
]
(c)
X=-10R
E
20 10 0 -10 -20
Y [RE] -6
-4 -20 2 4 6
Z [R
E
]
0.40
(d)
20 10 0 -10 -20
Y [RE] -6
-4 -20 2 4 6
Z [R
E
]
0.60
(e)
X=-15R
E
20 10 0 -10 -20
Y [RE] -6
-4 -20 2 4 6
Z [R
E
]
(f)
20 10 0 -10 -20
Y [RE] -6
-4 -20 2 4 6
Z [R
E
]
0.60
0.60
(g)
X=-20R
E
20 10 0 -10 -20
Y [RE] -6
-4 -20 2 4 6
Z [R
E
]
(h)
20 10 0 -10 -20
Y [RE] -6
-4 -20 2 4 6
Z [R
E
]
0.60
(i)
X=-25R
E
20 10 0 -10 -20
Y [RE] -6
-4 -20 2 4 6
Z [R
E
] 0.60
(j)
|C.C.|
0.0
0.2
0.4
0.6
0.8
1.0
[image:11.595.96.501.60.553.2]Figure 10
Fig. 10. Distribution of absolute value of correlation coefficient of the fit. Format is the same as Fig. 1.
particles into the near-Earth plasma sheet, and (4) the particle transport in the plasma sheet.
4.1 Limitations of analysis
Our analysis utilized a neutral sheet position model to eval-uate the relative position of measurements from the neutral sheet. The model gives us statistically optimized estimate of the neutral sheet position. Finite difference between pre-dicted and actual neutral sheet position is unavoidable for
each observation. This deviation can lead to the error in the analysis. It is also known that the plasma sheet flaps (Sergeev et al., 2004, 2006) and oscillates in eigen mode (Vorwerk et al., 2004). These variations are not included in the neutral sheet position model and also lead to the error. Thinning and expansion of the plasma sheet associated with the magneto-spheric substorm can also cause errors.
4042 D. Nagata et al.: Solar wind control of plasma sheet density
1
10
n
SW[/cc]
0.01
0.10
1.00
n
PS[/cc]
X = -11 Re
X = -29 Re
n = 0.025 n
SW+ 0.2 n
SWn = 0.025 n
SW0.18
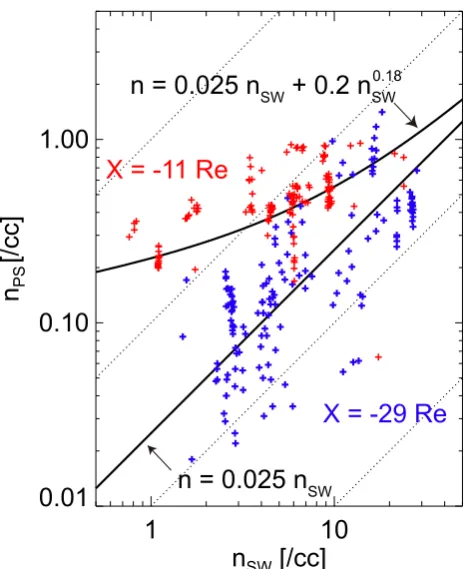
Fig. 11. Plasma sheet number density versus solar wind number density at the midnight meridian for different values ofX. Red crosses indicate data point for X=−11RE and blue crosses for
X=−29RE. Line indicates the purely solar wind origin case and
curve means mixture of solar wind origin and ionospheric origin plasma.
grid. This process results in smoothing of the spatial distri-butions. We also folded the observations with respect to the neutral sheet under the assumption of north-south symmetry in order to double the data amount. North-south asymmetry which can be caused for example by IMFBy or dipole tilt
effects are not taken into account.
We divided the observations in two categories based on 10-h averaged value of IMFBz. Since the autocorrelation
time of IMFBzis 2.5 h, each IMF subsets may contain
sev-eral changes of IMFBz sign during 10 h. Short timescale
effects of IMFBz are not included in our analysis.
More-over, a whole sequence of magnetospheric substorm can be completed during the 10-h interval, thus phases of substorm are not distinguished. Further investigation and elaboration are needed to reveal such short timescale variations.
Plasma observations were obtained by the LEP-EAI and the EPIC-STICS instruments. Since the LEP-EAI is an elec-trostatic analyzer, mass and charge state of particles were not distinguished. If the number density of O+ particles is cal-culated as they were protons, the value is one fourth of the true value. During intense storms and substorms, some part of plasma sheet can contain O+ions comparable to protons
(Lennartsson et al., 1992). The plasma number density is underestimated in such situations.
4.2 Contribution of ionospheric particles
Particles in the near-Earth plasma sheet are supplied from the ionosphere and the magnetosheath. These two sources have different dependences on the solar wind number den-sity. Ion supply from the ionosphere weakly depends on the solar wind number density with a power law index of 0.18, which is calculated from Fig. 4 of Cully et al. (2003a). On the other hand, magnetosheath number density can be approxi-mated to depend linearly on solar wind number density with the typical compression ratio of 4. Thus, larger contribution of ionosphere is expected to result in lower power law index of the solar wind number density dependence (Fig. 11).
Since ion supply from the ionosphere increases with de-creasing distance from the Earth (Cully et al., 2003b), the effect of ionospheric outflow should be most prominent in the near-Earth region. Indeed, our results show that the value ofηdecreases with decreasing distance from the Earth. Ion supply from the ionosphere is also known to depend on the solar wind electric field. This trend is consistent with the fact that faster solar wind under southward IMF result in lower values ofη(Fig. 12a–b).
Moreover, the value ofηandαdecrease associated with fast solar wind for southward IMF at the high latitude of the midnight region (Fig. 12c–f). These features are likely due to the effect of auroral outflow. The flow velocity in this region is directed tailward and toward the neutral sheet, which means outflow particles are supplied to the near-Earth plasma sheet. Supplied ionospheric particles are expected to be accelerated non-adiabatically (Lyons and Speiser, 1982) and transported into the pmidnight near-Earth region to re-sult in an increase of plasma number density associated with southward IMF.
If this is the case, the value ofηis expected to be lower in the pre-midnight near-Earth region than in the post-midnight near-Earth region. However, our result shows that the value of ηin the near-Earth region is lower in the post-midnight region during fast solar wind and southward IMF conditions. In order to explain this feature, we should consider the effect of gradient-curvature drift on solar wind origin ions trans-ported from the tail. Effect of gradient-curvature drift pre-vents high-energy ions from moving into the near-Earth post-midnight region, which results in less supply of solar wind particle thus lower values ofη in the post-midnight region (Fig. 12g).
[image:12.595.51.285.60.345.2]D. Nagata et al.: Solar wind control of plasma sheet density 4043
Small eta region
Negative alpha region
Stream line
20 10 0 -10 -20
Y [RE] -30
-25 -20 -15 -10 -5 0
X [R
E
] 0.20
0.40 0.60 0.80
Fast Solar Wind
(a)
Z=0R
E
Southward IMF
20 10 0 -10 -20
Y [RE] -30
-25 -20 -15 -10 -5 0
X [R
E
]
0.40
0.60
Slow Solar Wind
(b)
20 10 0 -10 -20
Y [RE] -6
-4 -20 2 4 6
Z [R
E
] 0.20
0.40 0.40
0.60 0.60
0.60
(c)
X=-10R
E
20 10 0 -10 -20
Y [RE] -6
-4 -20 2 4 6
Z [R
E
] 0.40 0.60
(d)
20 10 0 -10 -20
Y [RE] -6
-4 -20 2 4 6
Z [R
E
]
-0.08 -0.08
(e)
X=-10R
E
20 10 0 -10 -20
Y [RE] -6
-4 -20 2 4 6
Z [R
E
] 0.08
0.08 0.08
(f)
Alpha-0.4 0.0 0.4 Eta
0.0 0.4 0.8 1.2
(g)
Figure 12
Fig. 12. (a–d) solar wind number density dependence under southward IMF condition for fast and slow solar wind conditions. (e–f) IMFBz
dependence atX=−10REfor fast and slow solar wind conditions. (g) Schematic picture of plasma transport in the near-Earth plasma sheet.
source has been attributed to the magnetosheath. Hasegawa et al. (2003) reported that ion temperature is higher in the perpendicular direction than in the parallel direction to mag-netic field, whereas electron temperature shows an opposite anisotropy in the flank region. This fact is consistent with the entry mechanism of magnetosheath particles by kinetic Alfv´en wave (Johnson and Cheng, 2003).
At the inner edge of the plasma sheet, Los Alamos Na-tional Laboratory instruments in geosynchronous orbit ob-served cold dense plasma in the dawn region after southward IMF (Lavraud et al., 2006). The perpendicular proton tem-perature is higher than parallel to the magnetic field there
(Denton et al., 2005). This fact indicates that these particles are not of ionospheric origin. Thus ionospheric contribution to the near-Earth dense plasma is also questionable.
[image:13.595.111.497.61.516.2]4044 D. Nagata et al.: Solar wind control of plasma sheet density
Northward IMF
Southward IMF
Fast Solar Wind
Slow Solar Wind
Closed low latitude flux tube
Dusk flank only
Both flank
Both flank
Kelvin-Helmholtz vortex
Low latitude reconnectionOpen high latitude flux tubes
High latitude reconnection20 10 0 -10 -20
Y [R ] -6
-4 -20 2 4 6
Z [R
E
]
0.60 0.60
0.60
0.80 0.80
0.80
X=-20R
E
20 10 0 -10 -20
Y [R ] -6
-4 -20 2 4 6
Z [R
E
] 0.80
0.80
1.00 1.00
20 10 0 -10 -20
Y [RE]
-6 -4 -20 2 4 6
Z [R
E
]
0.80 0.80
Slow Solar Wind
Eta
0.0 0.4 0.8 1.2
(c)
(b)
(a)
(f)
(e)
(d)
(i)
(h)
(g)
Fig. 13. Upper raw is cross-section view of plasma sheet from the tail side atX=−20RE. Middle raw is schematic picture for upper
raw. Lower raw is locations of KH vortex and magnetic reconnection. Location of reconnection is represented by a red cross. Captured magnetosheath plasma and flux tubes are colored by green.
of plasma sheet associated with magnetospheric substorm may cause some errors to our analysis.
4.3 Transport mechanisms of magnetosheath particles into plasma sheet
Ionospheric particle supply decreases with increasing dis-tance from the Earth (Cully et al., 2003a). Thus, entry mech-anisms of magnetosheath particles play dominant roles in de-termining plasma number density at the distant part of the near-Earth plasma sheet. If the power law indexηrepresents the contribution of magnetosheath particles to plasma sheet plasma, the region with large value ofηis the candidate for entry region.
To our knowledge, there are two theoretical classes of en-try mechanisms: one is via magnetic reconnection and the other is via diffusion across the magnetopause. Plasma entry via magnetic reconnection at the magnetopause has different
modes for northward and southward IMF conditions. South-ward IMF leads to magnetic reconnection at the low-latitude portion of dayside magnetopause and magnetosheath particle entry into the high latitude magnetosphere. Under northward IMF condition, on the other hand, magnetic reconnection oc-curs at the poleward-of-cusp region and magnetosheath parti-cles are captured in the closed flux tube near the low-latitude magnetopause.
[image:14.595.48.550.66.440.2]D. Nagata et al.: Solar wind control of plasma sheet density 4045 Under southward IMF conditions, the value ofηis larger
at the high latitude portion of the both dawn and dusk flank regions (Fig. 13a), which is consistent with magnetosheath particle entry from high-latitude magnetosphere by the low latitude dayside reconnection entry mechanism (Fig. 13d, g). A similar structure is seen during the slow solar wind under northward IMF condition. However, the position of the peak is located at 1–2RE closer to the neutral sheet than that
un-der southward IMF condition (Fig. 13b). This feature can be attributed to the formation of closed flux tube with magne-tosheath particles formed by high-latitude reconnection un-der northward IMF (Fig. 13h).
On the other hand, the value ofηhas its peak at the equa-tor of only dusk side flank under fast solar wind conditions (Fig. 13c). This suggests that mechanisms other than recon-nection are involved. Since this equatorial peak ofηis asso-ciated with fast solar wind and located in the dusk downtail region, this structure is attributable to the diffusive entry as-sociated with KH instability (Fig. 13i). The growth rate of KH wave is thought to be larger at low-latitude than high-latitude because of the absence of stabilizing effect of lobe magnetic field. The dawn-dusk asymmetry can be explained by preferential decay of MHD-scale KH vortex due to elec-tron inertia effect (Nakamura et al., 2004).
Comparing the results for Parker and ortho-Parker IMF cases, the value of η at the flank region is enhanced at the dawn (dusk) side during (ortho-)Parker IMF orientation (Fig. 14). In other words, the solar wind number density dependence is enhanced in the downstream of quasi-parallel bow shock. Since CLUSTER observations showed distribu-tion of magnetosheath average density is independent from the IMF orientation (V. G´enot, private communication), this dawn-dusk asymmetry is likely due to the entry mechanism. The polarity of this switching dawn-dusk asymmetry sup-ports the KAW diffusive entry rather than the GDE entry mechanism. It is also possible that enhanced fluctuation in the magnetosheath affects the frequency of magnetic recon-nection at the magnetopause and results in this asymmetry (D. G. Sibeck, private communication).
4.4 Particle transport in the near-Earth plasma sheet For different IMFBz conditions, the plasma sheet has
dif-ferent response time lags to IMFBz variations. Our result
also shows that structures of time lag and duration time of IMFBzeffects are different for the two IMFBzconditions.
In this subsection, we discuss the relation between the IMF Bz effect timescale and particle transport in the near-Earth
plasma sheet.
Under southward IMF, distribution of time lag for IMFBz
effect has clear structure such that the value of time lag in-creases from the distant region toward both near-Earth flank regions (Fig. 15a). The sign of IMFBzdependence switches
at roughly 23RE distance from the Earth (Fig. 6b). In the
distant midnight region, southward IMF Bz effect appears
η
(X < -14 R
E)
20 10 0 -10 -20
Y [RE] -1.0
-0.5 0.0 0.5 1.0
η
Ortho-
η
Parker [image:15.595.311.546.62.260.2]Figure 14
Fig. 14.Yprofile of difference of solar wind dependence parameter between Parker and ortho-Parker IMF orientations atX<−14RE.
within 2 h and the plasma number density decreases. Subse-quently, the plasma number density in the nearer portion of the plasma sheet increases with a few hours delay.
This variation of plasma number density suggests recon-figuration of plasma sheet which is caused by plasma trans-port from distant to near-Earth regions associated with en-hanced convection. Figure 15b shows distribution of average ion bulk velocity in the equatorial plane without flows faster than 200 km/s. The value of time lag seems to increase along the stream lines. This fact supports that the effect of IMFBz
propagates in forms of convective transport of particles. Av-erage ion temperature shows that plasma is heated during the transport from the distant region to the inner magnetosphere. Under northward IMF, the distribution of IMFBz effect
duration time has interesting structures. If we neglect the peak around (X,Y )=(−20,−3)RE, the value increases from
distant dawn flank region to near-Earth dusk flank region as a whole (Fig. 16a). The value of duration time again increases along the average ion bulk stream lines (Fig. 16b). This indi-cates that the effect of IMFBzis flushed away by the plasma
convection. In other words, increased plasma number den-sity associated with northward IMF eventually decreases to the nominal value after several hours.
A remaining feature is the peak around (X, Y )=(−20, −3)RE. Around this peak, fast intermittent flows are
fre-quently observed (Angelopoulos et al., 1994) and flow fluc-tuations are also large. In such situation, turbulent diffusion might be important to understand the plasma transport in the plasma sheet. In order to interpret the physical meaning of this long duration time area, let us consider the contribution of transport mediated by turbulent diffusion.
t2
20 10 0 -10 -20
Y [RE]
-30 -25 -20 -15 -10 -5 0
X [R
E
2
2
4
(a)
|V|20 10 0 -10 -20
Y [RE]
-30 -25 -20 -15 -10 -5 0
X [R
E
]
10
10
20
20 30
30
(b)
20 10 0 -10 -20
Y [RE]
-30 -25 -20 -15 -10 -5 0
X [R
E
]
4
4
6 6
(c)
TION [keV]
0 2 4 6 8
Time [hour]
0 2 4 6 8 10 0 10 20 30 40
|V| [km/s]
Temperature
Figure 15
Southward IMF
Fig. 15. (a) Equatorial distribution of IMFBzeffect time lag for southward IMF. (b) Equatorial distribution of ion flow velocity. Stream
lines are shown in white curves. (c) Distribution of average ion temperature.
can usen0for the distribution of plasma number density. We estimated diffusion coefficient by the method of Borovsky et al. (1998) which uses flow fluctuation amplitude and autocor-relation time of flow in the dawn-dusk direction. Diffusion coefficient is estimated by the following equation.
D= v 2 rmsτcorr
2 (5)
Our result is shown in Fig. 16d. According to Borovsky et al. (1998), turbulent fluctuation is typically 60 km/s ampli-tude and 140 s duration, which gives the diffusion coefficient of 2.5×10⁵km2/s aroundX=−20RE. Our result is
consis-tent with theirs despite of the long separation of two observa-tions (i.e. ISEE and GEOTAIL). Diffusion coefficient is large at the distant midnight region for longer autocorrelation time and larger flow fluctuations.
Combined with the distribution of plasma number density, we obtained the diffusion speed as follows.
Vdiff=D∇n0 n0
(6) Due to the large value of number density gradient, diffu-sion velocity is as large as 2.3 km/s in the midnight region atX=−20RE (Fig. 16e). We also calculated the ratio
be-tween diffusion speed and average ion bulk speed (Fig. 16f). Diffusion speed and bulk speed is comparable around (X, Y )=(−25,−7)RE, which locates next to the peak of IMFBz
effect duration time.
Since average bulk flow is directed Earthward while dif-fusion is estimated to be directed anti-Earthward, these two transports ought to canceled each other. Under normal situa-tion, convective bulk flow overcomes the diffusive transport. However, the diffusive transport by turbulence can affect the convective transport during weak convection such as under
northward IMF condition. We propose that this cancellation results in the peak of IMFBz effect duration. Contribution
from numerical modeling with realistic turbulence effects to examine this phenomenon is awaited in the future.
4.5 Summary
We examined three-dimensional structures of dependences of plasma sheet number density on solar wind number den-sity and IMFBzby fitting the observations to an empirical
model. Effects of IMFBz polarity in 10-h time scale, solar
wind speed, and IMF orientation were also investigated by subdivision of dataset. Based on obtained features of depen-dence parameters’ distributions, we discussed the contribu-tion of outflow from the ionosphere and entry mechanisms of magnetosheath particles.
In the near-Earth region, dependence on solar wind num-ber density is weak for the southward IMF and faster solar wind condition. We interpret this feature due to contribution of mass supply from the terrestrial ionosphere which weakly depends on solar wind number density. Weak dependence on solar wind number density and strong dependence on IMFBz
in the midnight high-latitude region are attributable to the au-roral outflow. Dawn-dusk asymmetry of solar wind number density dependence in the near-Earth region can be associ-ated with substorm dynamics yet remains to be open.
[image:16.595.55.549.64.249.2]D. Nagata et al.: Solar wind control of plasma sheet density 4047
t1 - t2
20 10 0 -10 -20
Y [RE] -30
-25 -20 -15 -10 -5 0
X [R
E
]
4 6
6
6 8
(a)
|Vdiff|/|V|
20 10 0 -10 -20
Y [RE] -30
-25 -20 -15 -10 -5 0
X [R
E
]
10 20 30 40
(f)
0 10 20 30 40 50 60 |Vdiff|/|V| [%]
|Vdiff|
20 10 0 -10 -20
Y [RE] -30
-25 -20 -15 -10 -5 0
X [R
E
] 0.4
0.4
0.8 1.2
1.6 2.0
(e)
0 1 2 3 4
|Vdiff| [km/s]
20 10 0 -10 -20
Y [RE] -30
-25 -20 -15 -10 -5 0
X [R
E
]
2
4
(d)
0 1 2 3 4 5 6
Diffusion Coefficient [105km2/s]
|V|
20 10 0 -10 -20
Y [RE] -30
-25 -20 -15 -10 -5 0
X [R
E
]
10
10 20
20
(b)
0 10 20 30 40 |V| [km/s]
20 10 0 -10 -20
Y [RE] -30
-25 -20 -15 -10 -5 0
X [R
E
]
4
6
(c)
TION [keV]
0 2 4 6 8
Time [hour]
0 2 4 6 8 10
Temperature
Diffusion coefficient
Northward IMF
Fig. 16. (a) Equatorial distribution of IMFBzeffect duration time for northward IMF. (b) Equatorial distribution of ion flow velocity. Stream
lines are shown in white curves. (c) Distribution of average ion temperature. (d) Distribution of diffusion coefficient. (e) Distribution of diffusion speed. (f) Distribution of ration between diffusion speed and average ion bulk speed.
high-latitude reconnection and the resultant capture of mag-netosheath plasma.
For faster solar wind condition under northward IMF, the strong dependence region is limited in the dusk flank neutral sheet. Magnetosheath particle entry via Kelvin-Helmholtz vortex decay can explain this feature. IMF orientation an-gle seems to influence the dawn-dusk asymmetry of the solar wind number density dependence in the distant region. The polarity of asymmetry suggests the influence of diffusive en-try via kinetic Alfven wave at the magnetopause.
We also discussed the distribution of IMFBz effect time
lags. Under southward IMF, distribution of IMFBz effect
time lag can be understood by the convective transport which causes reconfiguration of the near-Earth plasma sheet. Un-der northward IMF condition, distribution of IMFBz
dura-tion time has a similar structure with that of time lag under southward IMF condition. This feature is also attributable to the effect of plasma convection. In addition to this structure, there is a peak of IMFBzeffect duration time in the middle
of examined area. We proposed that this structure is related with diffusive transport by turbulence in the plasma sheet.
Acknowledgements. EPIC-STICS data was provided by Steve P. Christon, Richard W. McEntire, and Masahito Nos´e. MGF data was provided by Tsugunobu Nagai of Tokyo Institute of Technology. The high resolution OMNI solar wind data was provided by Joe King and Natalia Papitashvili of NASA/GSFC. This work is supported by the JSPS grant for young scientists.
Topical Editor I. A. Daglis thanks two anonymous referees for their help in evaluating this paper.
References
[image:17.595.50.549.65.416.2]the plasma sheet by the solar wind, J. Geophys. Res., 103(A8), 17 617–17 640, 1998.
Chappell, C. R., Moore, T. E., and Waite Jr., J. H.: The ionosphere as a fully adequate source of plasma for the Earth’s magneto-sphere, J. Geophys. Res., 92(A6), 5896–5910, 1987.
Cully, C. M., Donovan, E. F., Yau, A. W., and Opgenoorth, H. J.: Supply of thermal ionospheric ions to the central plasma sheet, J. Geophys. Res., 108(A2), 1092, doi:10.1029/2002JA009457, 2003a.
Cully, C. M., Donovan, E. F., Yau, A. W., and Arkos, G. G.: Akebono/Suprathermal Mass Spectrometer observations of low-energy ion outflow: Dependence on magnetic activity and solar wind conditions, J. Geophys. Res., 108(A2), 1093, doi:10.1029/2001JA009200, 2003b.
Denton, M. H., Thomsen, M. F., Korth, H., Lynch, S., Zhang, J. C., and Liemohn, M. W.: Bulk plasma proper-ties at geosynchronous orbit, J. Geophys. Res., 110, A07223, doi:10.1029/2004JA010861, 2005.
Frey, H. U., Mende, S. B., Angelopoulos, V., and Donovan, E. F.: Substorm onset observations by IMAGE-FUV, J. Geophys. Res., 109, A10304, doi:10.1029/2004JA010607, 2004.
Hasegawa, H., Fujimoto, M., Maezawa, K., Saito, Y., and Mukai, T.: Geotail observations of the dayside outer boundary region: Interplanetary magnetic field control and dawn-dusk asymmetry, J. Geophys. Res., 108(A4), 1163, doi:10.1029/2002JA009667, 2003.
Johnson, J. R. and Cheng, C. Z.: Kinetic Alfv´en waves at the mag-netopause – mode conversion, transport and formation of LLBL, in Earth’s low-latitude boundary layer, Geophysical Monograph 133, American Geophysical Union, Washington, D.C., 2003. Kaufmann, R. L., Lu, C., Paterson, W. R., and Frank, L. A.:
Three-dimensional analyses of electric currents and pressure anisotropies in the plasma sheet, J. Geophys. Res., 107(A7), 1103, doi:10.1029/2001JA000288, 2002.
Kaufmann, R. L., Paterson, W. R., and Frank, L. A.: Birkeland currents in the plasma sheet, J. Geophys. Res., 108(A7), 1299, doi:10.1029/2002JA009665, 2003.
Kaufmann, R. L., Paterson, W. R., and Frank, L. A.: Pressure, vol-ume, density relationships in the plasma sheet, J. Geophys. Res., 109, A08204, doi:10.1029/2003JA010317, 2004.
Kaufmann, R. L., Paterson, W. R., and Frank, L. A.: Magne-tization of the plasma sheet, J. Geophys. Res., 109, A09212, doi:10.1029/2003JA010148, 2004.
Kaufmann, R. L., Paterson, W. R., and Frank, L. A.: Relationships between the ion flow speed, magnetic flux transport rate, and other plasma sheet parameters, J. Geophys. Res., 110, A09216, doi:10.1029/2005JA011068, 2005.
Kaufmann, R. L. and Paterson, W. R.: Magnetic flux and particle transport in the plasma sheet, J. Geophys. Res., 111, A10214, doi:10.1029/2006JA011734, 2006.
Kokubun, S., Yamamoto, T., Acuna, M. H., Hayashi, K., Shiokawa, K., and Kawano, H.: The GEOTAIL magnetic field experiment, J. Geomag. Geoelectr., 46, 7–21, 1994.
Lavraud, B., Thomsen, M. F., Wing, S., Fujimoto, M., Denton, M. H., Borovsky, J. E., Aasnes, A., Seki, K., and Weygand, J. M.: Observation of two distinct cold, dense ion populations at geosynchronous orbit: local time asymmetry, solar wind depen-dence and origin, Ann. Geophys., 24, 3451–3465, 2006,
Lennartsson, O. W.: ISEE ion composition data with implications for solar wind entry into Earth’s magnetotail, Space Sci. Rev., 80, 305–323, 1992.
Lyons, L. R. and Speiser, T. W.: Evidence for current sheet accel-eration in the geomagnetic tail, J. Geophys. Res., 87(A4), 2276– 2286, 1982.
Moore, T. E., Fok, M.-C., Chandler, M., Chappell, C. R., Christon, S. P., Delcourt, D. C., Fedder, J., Huddleston, M., Liemohn, M., Peterson, W. K., and Slinker, S.: Plasma sheet and (nonstorm) ring current formation from solar and polar wind sources, J. Geo-phys. Res., 110, A02210, doi:10.1029/2004JA010563, 2005. Mukai, T., Machida, S., Saito, Y., Hirahara, M., Terasawa, T., Kaya,
N., Obara, T., Ejiri, M., and Nishida, A.: The low energy particle (LEP) experiment onboard the GEOTAIL satellite, J. Geomag. Geoelectr., 46, 669–692, 1992.
Nagata, D., Machida, S., Ohtani, S., Saito, Y., and Mukai, T.: Solar wind control of plasma number density in the near-Earth plasma sheet, J. Geophys. Res., 112, A09204, doi:10.1029/2007JA012284, 2007.
Nakamura, T. K. M., Hayashi, D., Fujimoto, M., and Shinohara, I.: Decay of MHD-scale Kelvin-Helmholtz vortex mediated by parasitic electron dynamics, Phys. Rev. Lett., 92, 145001, doi:10.1103/PhysRevLett.92.145001, 2004.
Olson, W. P. and Pfitzer, K. A.: Magnetospheric responses to the gradient drift entry of solar wind plasma, J. Geophys. Res., 9, 10 823–10 833, 1985.
Sergeev, V., Runov, A., Baumjohann, W., Nakamura, R., Zhang, T. L., Balogh, A., Louarnd, P., Sauvaud, J.-A., and Reme, H.: Ori-entation and propagation of current sheet oscillations, Geophys. Res. Lett., 31, L05807, doi:10.1029/2003GL019346, 2004. Sergeev, V. A., Sormakov, D. A., Apatenkov, S. V., Baumjohann,
W., Nakamura, R., Runov, A. V., Mukai, T., and Nagai, T.: Sur-vey of large-amplitude flapping motions in the midtail current sheet, Ann. Geophys., 24, 2015–2024, 2006,
http://www.ann-geophys.net/24/2015/2006/.
Shue, J.-H., Song, P., Russell, C., Steinberg, J., Chao, J., Zastenker, G., Vaisberg, O., Kokubun, S., Singer, H., Detman, T., and Kawano, H.: Magnetopause location under extreme solar wind conditions, J. Geophys. Res., 103(A8), 17 691–17 700, 1998. Terasawa, T., Fujimoto, M., Mukai, T., Shinohara, I., Saito, Y.,
Ya-mamoto, T., Machida, S., Kokubun, S., Lazarus, A., Steinberg, J., and Lepping, R.: Solar wind control of density and temperature in the near-Earth plasma sheet: WIND/GEOTAIL collaboration, Geophys. Res. Lett., 24(8), 935–938, 1997.
Tsyganenko, N. A. and Mukai, T.: Tail plasma sheet models derived from Geotail particle data, J. Geophys. Res., 108(A3), 1136, doi:10.1029/2002JA009707, 2003.
D. Nagata et al.: Solar wind control of plasma sheet density 4049 Walker, R. J., Ashour-Abdalla, M., Ogino, T., Peroomian, V.,
and Richard, R. L.: Modeling magnetospheric sources, in: Earth’s low-latitude boundary layer, Geophysical Monograph 133, American Geophysical Union, Washington, D.C., 2003. Wang, C., Lyons, L. R., Chen, M. W., and Wolf, R. A.:
Model-ing the quiet time inner plasma sheet protons, J. Geophys. Res., 106(A4), 6161–6178, 2001.
Wang, C.-P., Lyons, L. R., Weygand, J. M., Nagai, T., and McEntire, R. W.: Equatorial distributions of the plasma sheet ions, their electric and magnetic drifts, and magnetic fields under different interplanetary magnetic fieldBz conditions, J. Geophys. Res.,
111, A04215, doi:10.1029/2005JA011545, 2006.
Wang, C.-P., Lyons, L. R., Nagai, T., Weygand, J. M., and McEn-tire, R. W.: Sources, transport, and distributions of plasma sheet ions and electrons and dependences on interplanetary parameters under northward interplanetary magnetic field, J. Geophys. Res., 112, A10224, doi:10.1029/2007JA012522, 2007.
Williams, D. J., McEntire, R. W., Schlemm II, C., et al.: Geotail energetic particles and ion composition instrument, J. Geomagn. Geoelectr., 46, 39–57, 1994.
Wing, S. and Newell, P. T.: 2D plasma sheet ion density and temper-ature profiles for northward and southward IMF, Geophys. Res. Lett., 29(9), 1307, doi:10.1029/2001GL013950, 2002.
Wing, S., Johnson, J. R., Newell, P. T., and Meng, C.-I.: Dawn-dusk asymmetries, ion spectra, and sources in the northward in-terplanetary magnetic field plasma sheet, J. Geophys. Res., 110, A08205, doi:10.1029/2005JA011086, 2005.