Ames Laboratory Accepted Manuscripts
Ames Laboratory
12-13-2018
Pressure-induced multiple phase transformations of
the BaBi3 superconductor
Li Xiang
Iowa State University and Ames Laboratory, [email protected]
Raquel A. Ribeiro
Iowa State University and Universidade Federal do ABC (UFABC), [email protected]
Udhara S. Kaluarachchi
Iowa State University and Ames Laboratory
Elena Gati
Ames Laboratory, [email protected]
Manh Cuong Nguyen
Ames LaboratorySee next page for additional authors
Follow this and additional works at:
https://lib.dr.iastate.edu/ameslab_manuscripts
Part of the
Condensed Matter Physics Commons
This Article is brought to you for free and open access by the Ames Laboratory at Iowa State University Digital Repository. It has been accepted for inclusion in Ames Laboratory Accepted Manuscripts by an authorized administrator of Iowa State University Digital Repository. For more information, please [email protected].
Recommended Citation
Xiang, Li; Ribeiro, Raquel A.; Kaluarachchi, Udhara S.; Gati, Elena; Nguyen, Manh Cuong; Wang, Cai-Zhuang; Ho, Kai-Ming; Bud’ko, Sergey L.; and Canfield, Paul C., "Pressure-induced multiple phase transformations of the BaBi3 superconductor" (2018).
Ames Laboratory Accepted Manuscripts. 301.
Pressure-induced multiple phase transformations of the BaBi3
superconductor
Abstract
Measurements of temperature-dependent resistance and magnetization under hydrostatic pressures up to 2.13
GPa are reported for single-crystalline, superconducting BaBi3. A temperature-pressure phase diagram is
determined and the results suggest three different superconducting phases α, β, and γ in the studied pressure
range. We further show that the occurrence of the three superconducting phases is intuitively linked to phase
transitions at higher temperature, which are likely first order and structural in nature. With the α phase being
the ambient-pressure tetragonal structure (P4/mmm), our first-principles calculations suggest the β phase has
a cubic structure (Pm−3m) and the γ phase has a distorted tetragonal structure where the Bi atoms are moved
out of the face-centered position. Finally, an analysis of the evolution of the superconducting upper critical
field with pressure further confirms these transitions in the superconducting state and suggests a possible
change of band structure or a Lifshitz transition near 1.54 GPa in γ phase. Given the large atomic numbers of
both Ba and Bi, our results establish BaBi3 as a good candidate for the study of the interplay of structure with
superconductivity in the presence of strong spin-orbit coupling.
Disciplines
Condensed Matter Physics
Authors
Li Xiang, Raquel A. Ribeiro, Udhara S. Kaluarachchi, Elena Gati, Manh Cuong Nguyen, Cai-Zhuang Wang,
Kai-Ming Ho, Sergey L. Bud’ko, and Paul C. Canfield
PHYSICAL REVIEW B
98
, 214509 (2018)
Pressure-induced multiple phase transformations of the BaBi
3superconductor
Li Xiang,1,2,*Raquel A. Ribeiro,2,3Udhara S. Kaluarachchi,1,2Elena Gati,1Manh Cuong Nguyen,1Cai-Zhuang Wang,1
Kai-Ming Ho,1Sergey L. Bud’ko,1,2and Paul C. Canfield1,2,†
1Ames Laboratory, Iowa State University, Ames, Iowa 50011, USA
2Department of Physics and Astronomy, Iowa State University, Ames, Iowa 50011, USA 3CCNH, Universidade Federal do ABC (UFABC), Santo André, SP, Brazil
(Received 29 August 2018; revised manuscript received 7 November 2018; published 13 December 2018)
Measurements of temperature-dependent resistance and magnetization under hydrostatic pressures up to
2.13 GPa are reported for single-crystalline, superconducting BaBi3. A temperature-pressure phase diagram
is determined and the results suggest three different superconducting phasesα,β, andγ in the studied pressure
range. We further show that the occurrence of the three superconducting phases is intuitively linked to phase
transitions at higher temperature, which are likely first order and structural in nature. With theαphase being
the ambient-pressure tetragonal structure (P4/mmm), our first-principles calculations suggest theβphase has a
cubic structure (P m-3m) and theγphase has a distorted tetragonal structure where the Bi atoms are moved out
of the face-centered position. Finally, an analysis of the evolution of the superconducting upper critical field with pressure further confirms these transitions in the superconducting state and suggests a possible change of band
structure or a Lifshitz transition near 1.54 GPa inγ phase. Given the large atomic numbers of both Ba and Bi,
our results establish BaBi3as a good candidate for the study of the interplay of structure with superconductivity
in the presence of strong spin-orbit coupling.
DOI:10.1103/PhysRevB.98.214509
I. INTRODUCTION
Materials with strong spin-orbit coupling have recently received a lot of attention as they are argued to be hosts for novel topological phases, such as topological insulators or topological superconductors [1–3]. Among them, Bi-based compounds are among the most investigated for their strong spin-orbit coupling due to Bi-6pelectrons [4]. For example, the compounds Bi2X3(X=Se, Te) are suggested to be
topo-logical insulators [5,6].
Another Bi-rich family of compounds,ABi3 (A=Sr, Ba,
and La), has attracted attention lately as these materials are superconductors. Polycrystalline ABi3 compounds with
A=Sr and Ba were first reported to be superconductors by Matthias and Hulm in 1952 [7]. Later on, single crystals of SrBi3 and BaBi3 were synthesized using the Bi self-flux
method [8] by various research groups and were reported to have superconducting transition temperaturesTcof 5.75 and 5.9 K, respectively [9–11]. Furthermore, Na substitution for Sr in SrBi3 increasesTcto 9.0 K [12]. Polycrystalline LaBi3
was synthesized more recently by utilizing a high-pressure technique [13] and reported to have a Tc of 7.3 K. Among
the three ABi3 compounds, SrBi3 and LaBi3 crystallize in
the AuCu3-type cubic structure (P m-3m), whereas BaBi3
crystallizes in tetragonal structure (P4/mmm) with only a small difference inaandclattice parameters [a =5.06(1) Å andc=5.13(2) Å] [10,11,14]. Importantly, for all threeABi3
compounds, spin-orbit coupling (SOC) is suggested to play
a significant role in the superconductivity [14], making the
ABi3 compounds potential platforms for the realization of
topological superconductivity.
Further insight into the nature of the superconductivity can be obtained by studying the system’s response to hy-drostatic pressure. As a tuning parameter, pressure is con-sidered clean compared to substitution since it does not in-duce extra chemical disorder into the systems. It has been proven to be very useful in terms of tuning the ground state in many systems [15–18], such as Fe-based superconduc-tors [19–22] and quantum-critical materials [23–26]. Earlier studies of the effect of hydrostatic pressure onABi3revealed
that, for LaBi3 and SrBi3, pressure linearly suppresses Tc
up to 1.55 and 0.81 GPa, respectively [11,13]. Interestingly, BaBi3 was shown to exhibit a double-transition feature in
the temperature-dependent magnetization curves for pressures above 0.3 GPa [11]. However, the origin and nature of the feature has not been studied in greater detail up to now.
In this work, we present a detailed pressure study on BaBi3
by utilizing both resistance and magnetization measurements. Our data reproduce the multiple superconducting transitions in an intermediate pressure region for 0.33p1.05 GPa, whereas only a single sharp transition is revealed for p
0.27 GPa and p1.27 GPa. The magnetization measure-ments confirm that superconductivity is not filamentary, but pressure-stabilized phases. In addition, our data sets reveal a series of as yet undetected high-temperature phase transitions. From these data sets, we determine a temperature-pressure (T-p) phase diagram that highlights the existence of three phases (each superconducting at low temperatures) in BaBi3.
We argue that the high-temperature anomalies, which are likely first-order in nature, are related to structural degrees of
LI XIANGet al. PHYSICAL REVIEW B98, 214509 (2018)
50 100 150 200 250 300
0 5 10
0
5 6
1 2 3
0 5 6 5 6
0.5 1.0
0
1.27
1.39 1.54
1.67
1.82 1.98
2.13 0.46
0.57
0.71 0.79 0.93
1.05 1.16
0 GPa
1.18 0.27 0.33 0.40
R
(m
Ω
)
T(K) BaBi3 (a)
1mm
(b)
0 GPa→0.33
R
(m
Ω
)
T(K)
Toffset
c T
offset c
(c)
0.33 GPa→1.05
T(K)
(d)
1.05 GPa→2.13
T(K)
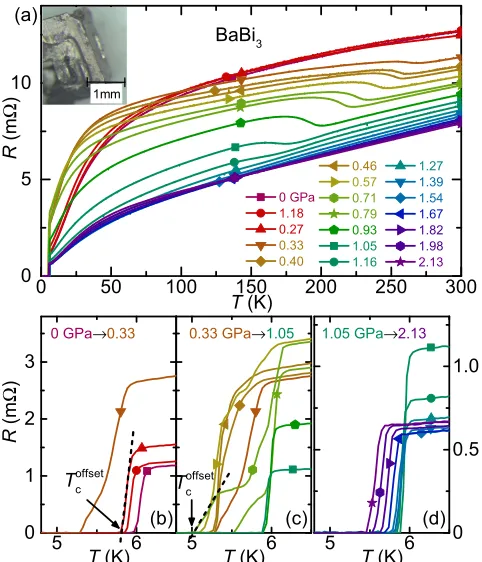
FIG. 1. (a) Evolution of the resistance with hydrostatic pressures up to 2.13 GPa. Data have been taken upon cooling; all data were
taken upon increasingp. Pressure values in the figure legends are
low-wtemperature pressure valuespT90 K. Inset: Picture of BaBi3
single crystal. (b)–(d) Blow-ups of the low-temperature supercon-ducting transition for three different pressure regions. The pressure regions have been chosen to represent the characteristic change of
the superconducting transition. Note that for 0.33p1.05 GPa
in panel (c), the superconducting transition occurs in multiple steps
in theR(T) data. The criterion for superconducting transition
tem-peratureToffset
c is indicated by arrows in panels (b) and (c).
freedom. Our first-principles calculations support that several structures are close in energy for BaBi3 and allow us to
infer the possible pressure-stabilized structures. Our results establish BaBi3as an interesting system to study the interplay
of superconductivity and structural degrees of freedom in the presence of strong SOC.
II. EXPERIMENTAL DETAILS
A. Experimental details
Single crystals of mm sizes BaBi3[inset of Fig.1(a)] were
grown through a Bi self-flux technique [8,11] with the help of a frit-disk crucible set [27]. The ac resistance measurement under pressure was performed in a Quantum Design Physical Property Measurement System (PPMS) using 1 mA excitation with a frequency of 17 Hz, on cooling and warming at a rate of
±0.25 K/min. The magnetic field was applied perpendicular to the current direction. A standard four-contact configuration was used. Contacts were made by DuPont 4929N silver paint inside a N2 glove box due to the air sensitivity of the
compound. A Be-Cu/Ni-Cr-Al hybrid piston-cylinder cell, similar to the one described in Ref. [28], was used to apply
pressure. Good hydrostatic conditions were achieved by using a 4:6 mixture of light mineral oil:n-pentane as a pressure medium, which solidifies, at room temperature, in the range 3–4 GPa, i.e., well above our maximum pressure [28–30]. Pressure values were inferred from the Tc(p) of lead [31].
Studies show that in a similar piston-cylinder cell using a different pressure medium, high-temperature pressures are different from the low-temperature ones, and the temperature dependence of pressure is nontrivial [32]. However, given that the temperature/pressure relation for this specific cell/pressure medium combination has not been established, we simply use the lead-Tc pressure value. This may give rise to a higher
temperature pressure difference of up to 0.3 GPa [30,32,33]. Low-field (20 mT) dc magnetization measurements un-der pressure were performed in a Quantum Design Mag-netic Property Measurement System (MPMS-3) SQUID mag-netometer. A commercially available HDM Be-Cu piston-cylinder pressure cell [34] was used to apply pressures up to 1.2 GPa. Daphne oil 7373 was used as a pressure medium, which solidifies at 2.2 GPa at room temperature [35], ensuring good hydrostatic conditions. Slight errors in the centering of the composite Pb/BaBi3sample and pressure cell happen
dur-ing the magnetization measurements, which cause the upturn features as shown in Fig. 5. Superconducting Pb was used as a low-temperature pressure gauge [36]. Note that for both pressure cells, load was always applied at room temperature. It is shown in the text later that two pressure cells reveal features that are consistent with each other, suggesting almost identical hydrostatic conditions in two cells.
B. Computational methods
To further investigate possible low-energy structures of BaBi3, we performed a random structure search by
mak-ing several hundreds of structures with different symmetries and unit-cell sizes, i.e., 2, 3, 4 and 6 formula units in the unit cell. All structures were then fully relaxed by density functional theory (DFT) with criteria 0.01 eV/Å for force components and 1 kbar (0.1 GPa) for stress tensor elements. The DFT [37] calculations were performed by Vienna Ab-initio Simulation Package (VASP) [38] with the projector-augmented wave (PAW) pseudopotential method [39,40] within the generalized-gradient approximation (GGA) [41]. The Monkhorst-Pack scheme [42] was used for Brillouin zone sampling with a high-qualityk-point grid of 2π×0.025 Å−1.
The energy cutoff was 320 eV and spin-orbit coupling (SOC) was included in calculations.
III. RESULTS AND DISCUSSIONS
Figure 1 shows the pressure dependence of the temperature-dependent resistance R(T) of BaBi3. All data
were taken upon increasing pressure up to 2.13 GPa. As shown in Fig. 1(a), at 0 GPa, the resistance decreases as temperature is lowered, showing metallic behavior. Below
∼6 K, BaBi3 becomes superconducting. Initially, increasing
pressure suppresses the resistance value at 300 K,R(300 K), slightly. However, when pressure is increased from 0.27 to 0.33 GPa, a sudden drop in R(300 K) is observed, and the overall behavior of temperature-dependent resistance
[image:4.590.42.283.60.341.2]PRESSURE-INDUCED MULTIPLE PHASE … PHYSICAL REVIEW B98, 214509 (2018)
4
6
8
10
150
200
250
300
1.05 1.16 1.27 1.39
T
SR
(m
Ω
)
BaBi
3(a)
0.33 GPa 0.46 0.79
T
(K)
(b)
d
R
/d
T
(arb.
u
.)
T
S
FIG. 2. (a) Temperature-dependent resistanceRtaken on cooling
(solid lines) and warming (dashed lines) for selected pressures;
(b) temperature derivativedR/dT taken on cooling showing the
evolution of the transition temperature TS. The criterion for the
determination ofTSis indicated by an arrow.
changes as well; starting from p=0.33 GPa, a “Z-shape” anomaly atT ∼250 K in theR(T) curve emerges at which the resistance is increased upon lowering the temperature. The feature is clearly observed up to 1.05 GPa, it becomes much weaker for 1.16 and 1.27 GPa, and it disappears for higher pressures. The transition temperature, TS, for this anomaly is suppressed upon increasing pressure (Fig. 2). Figures 1(b)–1(d) present blow-ups of the low-temperature superconducting transition for three different pressure regions. For the low-pressure region (0p0.27 GPa), the superconducting transition in resistance remains sharp and single, andTc is suppressed by increasing pressure. For
the intermediate pressure region (0.33p1.05 GPa), multiple steps in the superconducting transition are observed. For the high-pressure region (1.16p2.13 GPa), the superconducting transition becomes sharp and single again andTcdecreases with increasing pressure as well.
To create aT-p phase diagram, first we focus on a more detailed analysis of the “Z-shape,” high-temperature feature in the intermediate pressure region. Figure2presents the anal-ysis of the “Z-shape” anomaly in the temperature-dependent resistance curves. Figure2(a) shows theR(T) curve for the “Z-shape” anomaly on both cooling (solid lines) and warming (dashed lines) for selected pressures. Clear 10–25-K wide
0.5
1.0
1.5
2.0
0
5
10
0
T
S'
T
pR
(m
Ω
)
p
(GPa)
7 10 20 40
60
100 140
180
220
[image:5.590.46.282.60.381.2]260 300 K
FIG. 3. The pressure dependence of resistanceR(p) at fixed
tem-peratures. The dashed line labeledTpindicates a kinklike anomaly at
p∼0.3 GPa. The dotted line labeledTSindicates another broad
fea-ture atp∼1 GPa, which is discernible up to∼220 K. Determination
ofTS, and its relation toTS, is discussed in detail in the main text.
hysteresis is observed, indicating the transition’s first-order nature. The temperature derivative of the resistance,dR/dT, taken upon cooling, is shown in Fig. 2(b). It is clearly seen thatTSis suppressed with increasing pressure. This feature is
well pronounced up to 1.05 GPa, it becomes distinctly weaker for 1.16 and 1.27 GPa, and it is not detectable anymore for higher pressures.
To follow the feature associated with the sudden change in
R(p, T =300 K) atp∼0.3 GPa to lower temperatures, the pressure dependence of the resistanceR(p) at fixed tempera-tures is determined from the data in Fig.1(a)and presented in Fig.3. A kinklike anomaly is observed atp∼0.3 GPa. The anomaly manifests as an increase of resistance with increasing pressure, and at high temperature it manifests as a drop. This behavior reflects the crossing point of the R(T) curves at
T ∼110 K forp <0.33 GPa andp0.33 GPa, as shown in Fig.1. Similar behavior has also been observed in PbTaSe2,
where the sudden changes in R(p) are also associated with a first-order structural phase transition [43]. This kinklike anomaly is denoted as Tp and the corresponding transition
pressures have been determined from the midpoint of the jumplike change inR(p). At higher pressure, another much broader transition, TS, is observed in Fig. 3 for p∼0.8– 1 GPa, which exists up to T ∼220 K. To determine TS, for each temperature shown in the figure, theR(p) data for 0.75< p <1.25 GPa were fitted using a polynomial function up to the third order, and the inflection point was taken asTS. We summarize the position of the high-temperature anomalies observed in R(p, T) in the temperature-pressure (T-p) phase diagram shown in Fig.4. As shown in the figure,
Tp(blue pentagon) is located around 0.3 GPa at low
tempera-tures and represents the sudden change of theR(p) behavior from 0.27 to 0.33 GPa. The temperature of the “Z-shape” anomaly,TS(blue triangle), is continuously suppressed from
264 to 150 K by pressure.TSrepresents the broad transition at
[image:5.590.309.550.61.255.2]LI XIANGet al. PHYSICAL REVIEW B98, 214509 (2018)
0.5
1.0
1.5
2.0
0
0
50
100
150
200
250
300
T
pT
ST
S'
T
(K)
[image:6.590.304.545.60.410.2]p
(GPa)
FIG. 4. Temperatupressure phase diagram inferred from re-sistance measurements. The blue solid triangles represent the phase
transitionTSinferred from the data shown in Fig.2. The two
light-blue data points forTS are the last two, broad, barely observable
features indR/dT and may not correspond to an actual transition
(see the main text for details). The open blue triangles and pentagons
represent the pressure-induced transitionTS and Tp inferred from
the dashed and dotted lines in Fig.3, respectively. Superconducting
transition temperatureTcis not plotted in this phase diagram and will
be discussed later.
0.8–1 GPa and persists up toT ∼220 K as indicated in Fig.3. The behavior ofTcwith pressure and its relationship with the
high-temperature anomalies will be discussed later (see Fig.7
below).
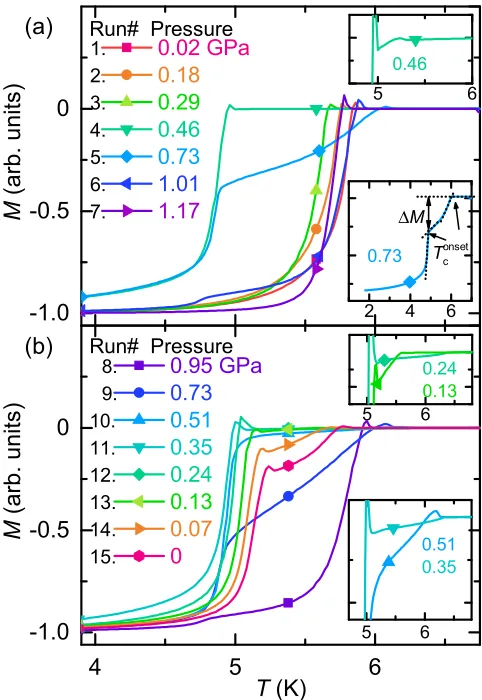
To provide thermodynamic data on the superconductivity under pressure, we present, in Fig.5, the dependence of the zero-field-cooled (ZFC) magnetization M(T) data. During the measurements, pressure was first monotonically increased from ambient pressure to 1.17 GPa, then it was decreased back to ambient pressure. The superconducting transition temper-ature of BaBi3 is inferred from the onset of diamagnetism,
which is visible in all data sets underp, demonstrating the bulk nature of superconductivity in the full pressure range of investigation. Due to uncertainties involved in the determi-nation of absolute values ofM, we normalized all curves to
M(6.5 K)=0 andM(1.8 K)= −1.
As shown in Fig.5(a), when increasing pressure, the super-conducting transition remains single and sharp up to 0.29 GPa. A sudden decrease of the onset transition temperature is observed between 0.29 and 0.46 GPa. In the pressure region of 0.46–1.01 GPa, the superconducting transition exhibits a double-transition feature. At 1.17 GPa, the transition becomes single and sharp again. For decreasing pressure from 0.95 to 0 GPa [see Fig. 5(b)], all of the M(T) curves exhibit double-transition features.
We summarize theTcvalues inferred from our
magnetiza-tion measurements for BaBi3in Fig.6(a)in aT-pphase
dia-gram. To be consistent withToffset
c determined from resistance
measurements, onset criteria of diamagnetism were used. In the case when a double transition was observed, the individual
-1.0
-0.5
0
4
5
6
-1.0
-0.5
0
2 4 6
5 6
5 6
5 6
0.02 GPa
0.18
0.29
0.46
0.73
1.01
1.17
M
(arb.
u
nits
)
1. 2. 3. 4. 5. 6. 7.
(a)
Run# Pressure0.95 GPa
0.73
0.51
0.35
0.24
0.13
0.07
0
Run# Pressure(b)
M
(arb.
u
nits
)
T
(K)
8. 9. 10. 11. 12. 13. 14. 15.
0.73 Tonsetc
ΔM 0.46
0.51
0.35 0.24
0.13
FIG. 5. Evolution of the zero-field-cooled (ZFC) magnetization
M(T) with (a) increasing pressure and (b) decreasing pressure in an
applied field of 20 mT. The low-temperature (T Tc) and
higher-temperature (TcT Tc,Pb) M values have been set to−1 and
0, respectively, due to uncertainties involved in the determination of absolute values (see the main text). The low-temperature pressure is inferred from the pressure dependence of the superconducting tran-sition of Pb (not shown). Black numbers before pressure values (Run no.) indicate the sequence of the applied pressure. The criterion for
the determination of superconducting transition temperature Tonset
c
is indicated by arrows in the lower inset of panel (a). Blow-ups of
M(T) curves for several pressures in the upper inset in panel (a)
and insets in panel (b) better show the double-transition feature for selected pressures. Small upturns at the onset of diamagnetism are currently thought to be artifacts associated with the MPMS-3 fitting of the convolution of the pressure cell/sample/lead signals.
onset temperatures were considered [see the lower inset of Fig.5(a)]. The directions of the triangle symbol of the data point indicate increasing () and decreasing () pressure. The number associated with each data point represents the run number in the magnetization measurement. Lettersaand
bare used to label the two transition temperatures in the case when a double-transition feature was observed. As shown in Fig. 6(a), three branches of Tc(p) can be seen. Due to the
[image:6.590.42.286.63.257.2]PRESSURE-INDUCED MULTIPLE PHASE … PHYSICAL REVIEW B98, 214509 (2018)
4
5
6
7
0.5
1.0
1.5
0
25%
50%
75%
100%
0
(b)
T
c(K)
14a 15a
13a
15b 13b
11a 14b
12a 12b
11b
10a 10b
9b
9a 4b
8b 6b 5b
8a 7
6a 5a
3
4a 1
2
α
γ
β
(a)
R
e
lative
Phase
P
ortion
p
(GPa)
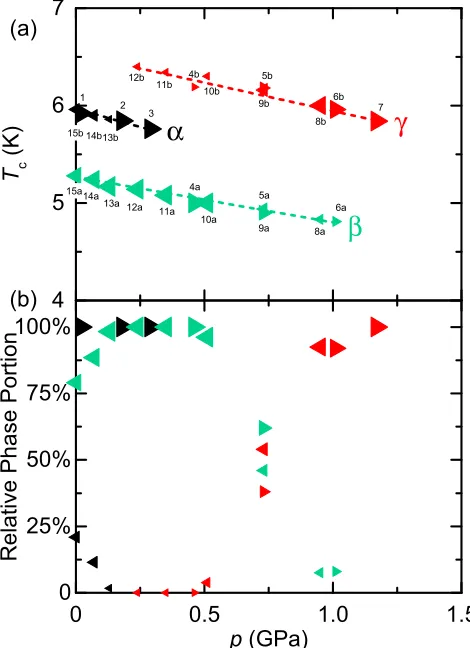
FIG. 6. (a) Temperature-pressure (T-p) phase diagram for
super-conductingTcinferred from magnetization measurements. The
run-number associated with each data point is the same as used in Fig.5.
The directions of the triangle data point indicate increasing ()
and decreasing () pressure. For pressures with multiple transitions,
lettersaandbare used. Three different phasesα(black),β(green),
andγ (red) are suggested. Dashed lines are guides to the eye; (b)
relative phase portion as a function of pressure, as determined from magnetization measurements. Sizes of symbols in (a) and (b) are roughly proportional to the phase portion values as indicated in (b).
are linearly suppressed by increasing pressure as shown in Fig.6(a). On increasing pressure, at low temperature, BaBi3
starts with phase α at ambient pressure. When pressure is increased from 0.29 to 0.46 GPa (Run 3 to Run 4), it enters an intermediate-pressure region (0.46p1.01 GPa, Run 4 to Run 6) where both features of phasesβandγare observed at low temperature. As pressure is further increased from 1.01 to 1.17 GPa (Run 6 to Run 7), only phase γ is observed. When decreasing pressure, BaBi3 starts with pure phase γ
at 1.17 GPa. Decreasing pressure drives BaBi3 again into a
region (0.95p0.24 GPa, Run 8 to Run 12) where phases
β andγ are observed. However, as indicated in the figure, further decreasing pressure does not restore the pureαphase at which BaBi3starts. Instead, a coexistence of phasesαandβ
is observed from 0.13 to 0 GPa (Run 13 to Run 15). It should be noted that the phase diagram in Fig.6(a)is quite different from that shown in Ref. [11], whereTcis first increased upon
increasing pressure up to 0.5 GPa with the rate of 1.22 K/GPa
and then almost saturates at 0.75 GPa. This could be due to a combination of the relatively small data density, large pressure steps, possible hysteresis effects, and not recognizing double-transition as a mixture of phases.
To better demonstrate the phase transformation in the pres-sure regions where multiple phases are observed, we present in Fig. 6(b) the relative phase portions of superconducting
α, β, andγ as a function of pressure at low temperature. The relative phase portions for different phases are obtained by calculating the corresponding drop values M[indicated in the inset of Fig.5(a)] in theM(T) data. The sizes of symbols in Figs.6(a)and6(b)are roughly proportional to the relative phase portions. As shown in the figure, BaBi3 starts with
100%αphase at ambient pressure. As pressure increases from 0.29 to 0.46 GPa, the relative phase portion of αis entirely suppressed and phases β and γ emerge. β is the majority phase in the mixture with almost 100% phase portion up to 0.51 GPa. Further increasing pressure suppresses the relative phase portion of β and stabilizes γ until the phase portion of γ reaches 100% at 1.17 GPa. For decreasing pressure, similar behavior of phase portions forβandγ is observed for the pressure region of 0.95–0.24 GPa. From 0.13 to 0 GPa, the phase portion of β decreases as the phase portion of α
increases, and BaBi3ends up with∼75% ofβ and∼25% of
αat 0 GPa. By both decreasing and increasing pressure in the magnetization measurement, Figs.6(a)and6(b)clearly reveal that the transition between α andβ and the transition from
β to γ are each first order. Figure 6(b) clearly shows wide pressure ranges of coexistence ofαandβ as well asβandγ. In addition, upon releasing pressure we find thatβ phase can exist in a metastable phase.
To analyze the interrelation between superconductivity and the various high-temperature anomalies observed, R(T , p) data were further analyzed. The corresponding surface-gradient magnitude(∂R/∂T)2+(∂R/∂p)2 was calculated
as a function of both temperature and pressure and is shown as a color plot in Fig.7, together withTS, TS, Tp, andTcdata
that were obtained from both resistance and magnetization measurements. In Fig. 7(a), it is shown that Tp is revealed
as a sharp anomaly in the color plot.TSis revealed as a sharp
anomaly in the color plot up to 1.05 GPa. The transition at
p∼0.9 GPa,TS, is revealed in the color plot as well, though more broadly. We suggest that TS andTS lines are likely to
be one transition line inferred from different criteria, as the color plot shows that they connect smoothly with each other. Figure 7(b) presents the blow-up of the low-temperature region (T =4–7 K). Toffset
c from resistance measurement
andTonset
c from magnetization measurement upon increasing
pressure are plotted together for consistency. As shown in the figure, Tcoffset is suppressed from 6 to 5.8 K in the low-pressure region (0p0.27 GPa), and then it undergoes a sudden drop from 5.8 to 5.3 K when entering the intermediate-pressure region (0.33p1.05 GPa). In the intermediate-pressure region,Tcoffsetis initially suppressed to 5 K by 0.71 GPa and then increases to 5.9 K at 0.93 GPa. At even higher pressures (1.16p2.13 GPa),Toffset
c slowly decreases to
5.5 K. A subtle kinklike anomaly at 1.54 GPa is observed and will be discussed in detail later in the text.Tonset
c from
magnetization measurement for increasing pressure matches
[image:7.590.47.282.64.388.2]LI XIANGet al. PHYSICAL REVIEW B98, 214509 (2018)
FIG. 7. (a) Color plot of surface-gradient magnitude
(∂R/∂T)2+(∂R/∂p)2calculated fromR(T , p) data. Anomalies
in the color plot coincide with the phase transitions TS, Tp in
Fig.4. The broad transition around 1 GPa labeled asTS in Fig.3
is also revealed in this color plot. Different phasesα, β, andγ are
proposed for BaBi3at different positions in theT-pphase diagram.
(b) Blow-up of the color plot low-temperature region together
with superconducting transition data from resistivity (Fig. 4) and
magnetization upon increasing pressure (Fig.6). Dashed lines are
guides for the eye.
very well with theToffset
c from resistance measurement. The
multistep transition pressure region for resistance measure-ment agrees with the double-transition pressure region for magnetization measurements. Importantly, the pressure region in which the double-transition is observed is also enclosed by the Tp, TS, and TS lines. Furthermore, the pressures
where sudden changes inTc(p) are observed (p∼0.3 GPa
and p∼0.9 GPa) coincide with the Tp and TS anomalies
in the color plot. These observations demonstrate the strong interrelation between the superconductivity in BaBi3with the
high-temperature phase transitions.
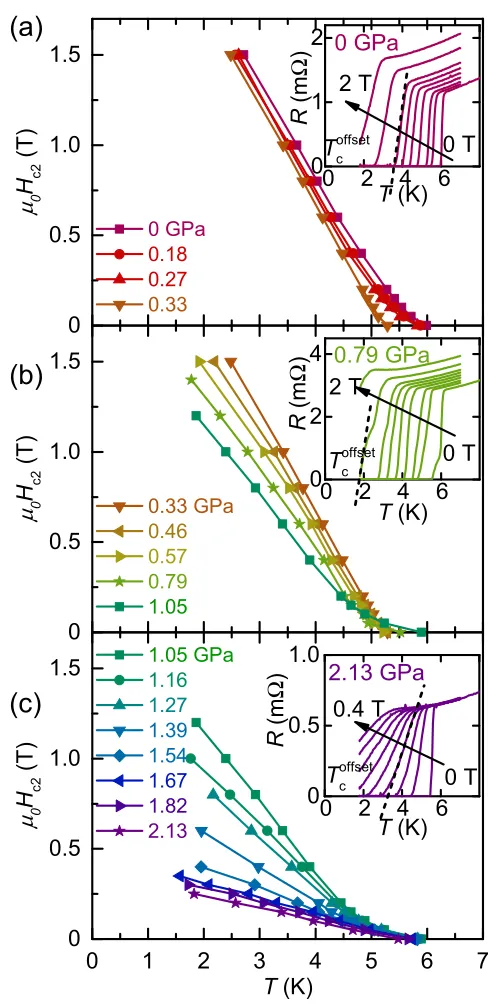
To further study the nature of the superconducting state in the α, β, and γ phases, we examined the response of superconductivity to an external field. Figure 8 shows the temperature dependence of the superconducting upper critical fieldHc2at various pressures. The insets show representative
resistance data sets in the three pressure regions that were used to extract the data present in the main panels. As shown in the figure, for low- and high-pressure regions (p0.33 GPa andp1.16 GPa), the superconducting transition stays one single transition under magnetic fields. In contrast, for the
0.5
1.0
1.5
0
0.5
1.0
1.5
0
0
1
2
3
4
5
6
7
0.5
1.0
1.5
0
0
2
4
6
1
2
0
0
2
4
6
2
4
0
0
2
4
6
0.5
1.0
0
0 GPa
0.18 0.27
0.33
T
offset c0
H
c2(T)
0.33 GPa 0.46 0.57
0.79
1.05
(c)
(b)
0
H
c2(T)
(a)
1.05 GPa 1.16 1.27
1.39 1.54
1.67
1.82 2.13
0
H
c2(T)
T
(K)
0 T
R
(m
Ω
)
T
(K)
0 GPa
2 T
T
offset cR
(m
Ω
)
T
(K)
0.79 GPa
2 T
0 T
T
offset c2.13 GPa
R
(m
Ω
)
T
(K)
0.4 T
[image:8.590.300.544.56.558.2]0 T
FIG. 8. Temperature dependence of the superconducting upper
critical fieldHc2(T) for (a)p0.33 GPa, (b) 0.33p1.05 GPa,
and (c) 1.05p2.13 GPa.Toffset
c as shown in the insets is taken
from resistance measurement. Insets show representative resistance data under magnetic fields.
intermediate-pressure region, the multiple-step nature of the superconducting transition persists in magnetic fields. For all of the pressures, Hc2 is linear in temperature except for
low magnetic fields. The curvature at low fields has been observed in other superconductors and can be explained by the multiband nature of superconductivity [22,44–46], which is also the case for BaBi3[10,14]. The slope of the
temperature-dependent Hc2 was obtained by linear fitting theμ0Hc2(T)
data above the curvature (data above 0.2 T for low- and
[image:8.590.40.280.63.367.2]PRESSURE-INDUCED MULTIPLE PHASE … PHYSICAL REVIEW B98, 214509 (2018)
4 5 6 7
γ
Tc
(K)
α
β
0.5 1.0 1.5 2.0
0
0.05 0.10
0
-(d
0
H c2
/d
T
)| T
c
/
T c
(T
K
-2 )
[image:9.590.309.550.61.281.2]p(GPa)
FIG. 9. Pressure dependence of the normalized upper critical
field slope,−(1/Tc)(dμoHc2/dT)|Tc, plotted together with T
offset c
from resistance measurement. Smaller symbols indicate the pressure range where the superconducting transition shows multiple steps.
Different phases α, β, and γ are proposed for different pressure
regions as indicated in Fig.7. Dashed lines are guides to the eyes.
intermediate-pressure regions, data above 0.1 T for high-pressure regions). Similar analysis was performed in the liter-ature for other superconductors; see Refs. [21,22,45,46]. Gen-erally speaking, the slope of the upper critical field normalized byTcis related to the Fermi velocity and the superconducting
gap of the system [44]. In the clean limit, for a single band,
−(1/Tc)(dμoHc2/dT)|Tc ∝1/v
2
F, (1)
where vF is the Fermi velocity. Even though the
supercon-ductivity in BaBi3 is multiband [10,14], Eq. (1) can give
qualitative insight into changes induced by pressure.
Figure 9 presents the pressure dependence of the normalized slope of the upper critical field, −(1/Tc)
(dμoHc2/dT)|Tc, together with theT
offset
c data. Smaller
sym-bols indicate the intermediate-pressure region where the su-perconducting transition occurs in multiple steps. As shown in the figure, the normalized slope−(1/Tc)(dμoHc2/dT)|Tc
exhibits anomalies between 0.27 and 0.33 GPa and between 0.75 and 1.05 GPa, which coincides with the phase transition ranges forαtoβandβtoγ. Another anomaly is observed at 1.54 GPa, which coincides with the pressure where a small, kinklike anomaly inToffset
c occurs. Due to the absence of any
feature inR(T) atT > Tcin this pressure region, we suggest
that this small feature might be related to a change of band structure or to a Lifshitz transition, or some other change in
vFwithin theγ phase [22,46–49].
Our studies show that BaBi3exhibits three different phases
in a relatively small temperature and pressure range. The sudden changes in the superconducting character and the anomalies at high temperature suggest that structural degrees of freedom are crucial for understanding the behavior of BaBi3 under pressure. A similar sudden change inTc(p) and
associated high-temperature anomalies have been observed in PbTaSe2, where a first-order structural phase transition is
identified [43]. To gain insight into the pressure-stabilized
P32 P3221 I4/mcm
P4/mmm
-3 -2 -1 0 1 2
0 2 4 6 8
Δ
H (meV/atom)
Pressure (GPa) P32 P3221 I4/mcm Pm-3m P4/mmm
Pm-3m
FIG. 10. Pressure dependence of relative formation enthalpies and crystal structures of low-energy structures (see text for details). Green and purple balls denote Ba and Bi atoms.
structures in BaBi3, we performed first-principles calculations
under pressure. Figure 10 presents the relative formation enthalpy (with respect to experimentally observed ambient-pressure P4/mmm structure) at different pressures of the five lowest-energy structures found from our crystal structure search at zero temperature. The difference betweenP m-3m
and P4/mmm structures is the slight difference in lattice parameters a and c in P4/mmm structure. The I4/mcm
structure could be viewed as distorted P4/mmm structure where the Bi atoms are moved out of the face-centered posi-tion, as can be seen in Fig.10. TheP32andP3221 structures
can also be viewed as distortedP4/mmmstructure as well (not obvious in Fig.10but from different directions of view) but with distortions in both the Ba and Bi positions.
We found several structures with very small relative for-mation enthalpies. We note that these small energy differences within 2 meV/at could be within the error of DFT calculations and the pressure range in the DFT calculations is not exactly the same pressure range as in the experiment, but the trend of formation enthalpy change with pressure may be observed to speculate possible pressure-stabilized structures in BaBi3.
As shown in the figure, the relative formation enthalpies of different structures respond differently to external pressure, e.g., forI4/mcmrelative formation enthalpy decreases very fast at pressure between 0 and 4 GPa while that of P3221
decreases slightly. At pressure larger than 4 GPa, three new structures are very competitive in formation enthalpy with the differences within 1 meV/at and all of them more stable than P4/mmm structure. Our crystal structure search and DFT calculation show that there are several structures that are very competitive in formation enthalpy, and these structures are very likely more stable than ambient-pressureP4/mmm
structure under pressure. Experimental crystallographic data taken under pressure are needed to identify precisely which structures are theβand/orγ phases.
[image:9.590.47.285.63.248.2]LI XIANGet al. PHYSICAL REVIEW B98, 214509 (2018)
The transformations fromP4/mmmstructure toP m-3m
or I4/mcm structures are minimal because only small changes in the structure need to be made, as mentioned above. The response ofI4/mcmstructure to pressure is the most robust among the considered structures, as mentioned above. On the other hand, the temperature and kinetics of transformation, which are not included in DFT calculations, also play an important role in structural transformation. We may speculate that the P m-3mand I4/mcm structures are the β and γ phases observed in experiment, respectively. The possibilities ofP32and/orP3221 structures observed in
experiment are not exclusively eliminated, however.
The calculation results are reasonable if we look into the ambient-pressure structural information for theABi3 family.
As mentioned in the Introduction, at ambient pressure and room temperature, BaBi3 crystallizes in tetragonal structure
with only a small difference in theaandclattice parameters [a=5.06(1) Å and c=5.13(2) Å], which we label as α
phase. In contrast, both of its neighboring compounds SrBi3
and LaBi3crystallize in cubic structure with lattice parameters
a=5.05(3) and 4.99(2) Å, respectively, i.e., with smaller lattice parameters and unit-cell volumes. As applying hydro-static pressure to BaBi3 will decrease its lattice parameters,
we assume that pressure tends to drive BaBi3 to the
higher-symmetry cubic structure, as realized in the neighboring com-pounds [11,13,50–53]. It is worth noting that the drop ofTc
atTp is consistent with the fact that SrBi3 has lowerTcthan
BaBi3.
With regard to the influence of SOC on the electronic and structural parameters of BaBi3, insight can be gained from a
recent theoretical investigation of the phonon-dispersion spec-tra of BaBi3 with and without SOC [14]. Whereas for SrBi3
these calculations indicate that the cubic structure is stable even without considering SOC, the same calculations find that SOC is necessary to stabilize the ambient-pressure tetragonal structure in BaBi3. This demonstrates that the interplay of
electronic and structural degrees of freedom in BaBi3 places
this material close to a structural instability. This might be reflected in the high-pressure sensitivity of BaBi3revealed in
the present work. Together with the multiple phase transitions observed in the present work in a small pressure range, we
establish BaBi3 as a good platform to study the interplay of
structure and superconductivity in the presence of spin-orbit coupling.
IV. CONCLUSION
We establish three different phasesα, β, andγ in BaBi3
under pressure up to 2.13 GPa, each of which are supercon-ducting at low temperatures. In the low-pressure region, BaBi3
is purely in αphase for the whole investigated temperature range. When pressure is first increased at high temperature, BaBi3transfers intoγ phase through a likely first-order
tran-sition. Inγphase, by lowering the temperature, the compound goes through another first-order transition toβ phase. Further increasing pressure suppresses the transition temperature of
γ toβ phase, and in the high-pressure region, BaBi3 stays
in γ phase for the whole investigated temperature range. Based on a crystal structure search and DFT calculations, we speculate the phase transitions between α, β, and γ to be related to structural degrees of freedom. With α phase being the ambient-pressure tetragonal structure (P4/mmm),
β phase could be cubic (P m-3m) and γ phase could have a distorted tetragonal structure (I4/mcm). Measurement of the superconducting upper critical field exhibits an anomaly at
p=1.54 GPa, suggesting a pressure-induced band-structure change or Lifshitz transition within the γ phase. Our results establish BaBi3 as a good platform to study the interplay of
structure and superconductivity in the presence of spin-orbit coupling.
ACKNOWLEDGMENTS
We would like to thank A. Kreyssig for robust and enlight-ening discussions. This work is supported by the U.S. DOE, Basic Energy Sciences, Materials Science and Engineering Division under Contract No. DE-AC02-07CH11358. L.X. was supported, in part, by the W. M. Keck Foundation. R.A.R. was supported by the Gordon and Betty Moore Foundation EPiQS Initiative (Grant No. GBMF4411) and by FAPESP (Grant No. 2011/19924-2).
[1] M. Z. Hasan and C. L. Kane, Rev. Mod. Phys. 82, 3045
(2010).
[2] X.-L. Qi and S.-C. Zhang,Rev. Mod. Phys.83,1057(2011).
[3] Y. S. Hor, A. J. Williams, J. G. Checkelsky, P. Roushan, J. Seo, Q. Xu, H. W. Zandbergen, A. Yazdani, N. P. Ong, and R. J.
Cava,Phys. Rev. Lett.104,057001(2010).
[4] A. Isaeva, B. Rasche, and M. Ruck,Phys. Status Solidi RRL7,
39(2013).
[5] Y. Xia, D. Qian, D. Hsieh, L. Wray, A. Pal, H. Lin, A. Bansil,
D. Grauer, Y. S. Hor, R. J. Cava, and M. Z. Hasan,Nat. Phys.
5,398(2009).
[6] Y. L. Chen, J. G. Analytis, J.-H. Chu, Z. K. Liu, S.-K. Mo, X. L. Qi, H. J. Zhang, D. H. Lu, X. Dai, Z. Fang, S. C. Zhang, I. R.
Fisher, Z. Hussain, and Z.-X. Shen,Science325,178(2009).
[7] B. T. Matthias and J. K. Hulm,Phys. Rev.87,799(1952).
[8] P. C. Canfield and Z. Fisk,Philos. Mag. B65,1117(1992).
[9] M. Kakihana, H. Akamine, T. Yara, A. Teruya, A. Nakamura,
T. Takeuchi, M. Hedo, T. Nakama, Y. ¯Onuki, and H. Harima,
J. Phys. Soc. Jpn.84,124702(2015).
[10] N. Haldolaarachchige, S. K. Kushwaha, Q. Gibson, and R. J.
Cava,Supercond. Sci. Technol.27,105001(2014).
[11] R. Jha, M. A. Avila, and R. A. Ribeiro,Supercond. Sci. Technol.
30,025015(2017).
[12] A. Iyo, Y. Yanagi, T. Kinjo, T. Nishio, I. Hase, T. Yanagisawa, S. Ishida, H. Kito, N. Takeshita, K. Oka, Y. Yoshida, and H.
Eisaki,Sci. Rep.5,10089(2015).
[13] T. Kinjo, S. Kajino, T. Nishio, K. Kawashima, Y. Yanagi, I. Hase, T. Yanagisawa, S. Ishida, H. Kito, N. Takeshita, K. Oka,
H. Eisaki, Y. Yoshida, and A. Iyo,Supercond. Sci. Technol.29,
03LT02(2016).
PRESSURE-INDUCED MULTIPLE PHASE … PHYSICAL REVIEW B98, 214509 (2018)
[14] D. F. Shao, X. Luo, W. J. Lu, L. Hu, X. D. Zhu, W. H. Song,
X. B. Zhu, and Y. P. Sun,Sci. Rep.6,21484(2016).
[15] J. S. Schilling,Adv. Phys.28,657(1979).
[16] J. S. Schilling, inFrontiers of High Pressure Research II:
Appli-cation of High Pressure to Low-Dimensional Novel Electronic Materials (Springer Netherlands, Dordrecht, 2001), pp. 345– 360.
[17] B. Lorenz and C. W. Chu, in Frontiers in Superconducting
Materials(Springer, Berling, 2005), pp. 459–497.
[18] D. D. Jackson, V. Malba, S. T. Weir, P. A. Baker, and Y. K.
Vohra,Phys. Rev. B71,184416(2005).
[19] E. Colombier, S. L. Bud’ko, N. Ni, and P. C. Canfield,Phys.
Rev. B79,224518(2009).
[20] C. W. Chu and B. Lorenz,Physica C469,385(2009).
[21] V. Taufour, N. Foroozani, M. A. Tanatar, J. Lim, U. Kaluarachchi, S. K. Kim, Y. Liu, T. A. Lograsso, V. G. Kogan, R. Prozorov, S. L. Bud’ko, J. S. Schilling, and P. C. Canfield,
Phys. Rev. B89,220509(2014).
[22] L. Xiang, U. S. Kaluarachchi, A. E. Böhmer, V. Taufour, M. A.
Tanatar, R. Prozorov, S. L. Bud’ko, and P. C. Canfield,Phys.
Rev. B96,024511(2017).
[23] Y. Saiga, K. Matsubayashi, T. Fujiwara, M. Kosaka, S. Katano,
M. Hedo, T. Matsumoto, and Y. Uwatoko,J. Phys. Soc. Jpn.77,
053710(2008).
[24] K. Matsubayashi, Y. Saiga, T. Matsumoto, and Y. Uwatoko,
J. Phys.: Conf. Ser.200,012112(2010).
[25] S. K. Kim, M. S. Torikachvili, S. L. Bud’ko, and P. C. Canfield,
Phys. Rev. B88,045116(2013).
[26] U. S. Kaluarachchi, S. L. Bud’ko, P. C. Canfield, and V. Taufour,
Nat. Commun.8,546(2017).
[27] P. C. Canfield, T. Kong, U. S. Kaluarachchi, and N. H. Jo,
Philos. Mag.96,84(2016).
[28] S. L. Bud’ko, A. N. Voronovskii, A. G. Gapotchenko, and E. S.
ltskevich, Zh. Eksp. Teor. Fiz.86, 778 (1984) [Sov. Phys. JETP
59, 454 (1984)].
[29] S. K. Kim, M. S. Torikachvili, E. Colombier, A. Thaler, S. L.
Bud’ko, and P. C. Canfield,Phys. Rev. B84,134525(2011).
[30] M. S. Torikachvili, S. K. Kim, E. Colombier, S. L.
Bud’ko, and P. C. Canfield, Rev. Sci. Instrum. 86, 123904
(2015).
[31] B. Bireckoven and J. Wittig,J. Phys. E21,841(1988).
[32] J. D. Thompson,Rev. Sci. Instrum.55,231(1984).
[33] T. N. Lamichhane, L. Xiang, Q. Lin, T. Pandey, D. S. Parker, T.-H. Kim, L. Zhou, M. J. Kramer, S. L. Bud’ko, and P. C.
Canfield,Phys. Rev. Mater.2,084408(2018).
[34] https://www.qdusa.com/sitedocs/productBrochures/ High_Pressure_Cell_for_Magnetometry_Brochure.pdf.
[35] K. Yokogawa, K. Murata, H. Yoshino, and S. Aoyama,Jpn. J.
Appl. Phys.46,3636(2007).
[36] A. Eiling and J. S. Schilling,J. Phys. F11,623(1981).
[37] W. Kohn and L. J. Sham,Phys. Rev.140,A1133(1965).
[38] G. Kresse and J. Furthmüller,Phys. Rev. B54,11169(1996).
[39] P. E. Blöchl,Phys. Rev. B50,17953(1994).
[40] G. Kresse and D. Joubert,Phys. Rev. B59,1758(1999).
[41] J. P. Perdew, K. Burke, and M. Ernzerhof,Phys. Rev. Lett.77,
3865(1996).
[42] H. J. Monkhorst and J. D. Pack,Phys. Rev. B13,5188(1976).
[43] U. S. Kaluarachchi, Y. Deng, M. F. Besser, K. Sun, L. Zhou, M. C. Nguyen, Z. Yuan, C. Zhang, J. S. Schilling, M. J. Kramer, S. Jia, C.-Z. Wang, K.-M. Ho, P. C. Canfield, and S. L. Bud’ko,
Phys. Rev. B95,224508(2017).
[44] V. G. Kogan and R. Prozorov, Rep. Prog. Phys.75, 114502
(2012).
[45] U. S. Kaluarachchi, V. Taufour, A. E. Böhmer, M. A. Tanatar, S. L. Bud’ko, V. G. Kogan, R. Prozorov, and P. C. Canfield,
Phys. Rev. B93,064503(2016).
[46] L. Xiang, W. R. Meier, M. Xu, U. S. Kaluarachchi, S. L.
Bud’ko, and P. C. Canfield,Phys. Rev. B97,174517(2018).
[47] I. Lifshitz, J. Exp. Theor. Phys.38, 1569 (1960) [Sov. Phys.
JETP11, 1130 (1960)].
[48] D. Kang, Y. Zhou, W. Yi, C. Yang, J. Guo, Y. Shi, S. Zhang, Z. Wang, C. Zhang, S. Jiang, A. Li, K. Yang, Q. Wu, G. Zhang,
L. Sun, and Z. Zhao,Nat. Commun.6,7804(2015).
[49] N. H. Jo, U. S. Kaluarachchi, Y. Wu, D. Mou, L. Huang, V.
Taufour, A. Kaminski, S. L. Bud’ko, and P. C. Canfield,Phys.
Rev. B94,184413(2016).
[50] J. M. Leger, P. E. Tomaszewski, A. Atouf, and A. S. Pereira,
Phys. Rev. B47,14075(1993).
[51] U. D. Venkateswaran, V. M. Naik, and R. Naik,Phys. Rev. B
58,14256(1998).
[52] P. Bouvier and J. Kreisel,J. Phys.: Condens. Matter14,3981
(2002).
[53] M. Einaga, A. Ohmura, A. Nakayama, F. Ishikawa, Y. Yamada,
and S. Nakano,Phys. Rev. B83,092102(2011).