Ames Laboratory Accepted Manuscripts
Ames Laboratory
7-20-2018
Fuel utilization effects on system efficiency in solid
oxide fuel cell gas turbine hybrid systems
Danylo Oryshchyn
U.S. Department of Energy
Nor Farida Harun
U.S. Department of Energy
David Tucker
U.S. Department of Energy
Kenneth Bryden
Ames Laboratory
, [email protected]
Lawrence Shadle
U.S. Department of Energy
Follow this and additional works at:
https://lib.dr.iastate.edu/ameslab_manuscripts
Part of the
Applied Mechanics Commons
, and the
Energy Systems Commons
This Article is brought to you for free and open access by the Ames Laboratory at Iowa State University Digital Repository. It has been accepted for inclusion in Ames Laboratory Accepted Manuscripts by an authorized administrator of Iowa State University Digital Repository. For more information, please [email protected].
Recommended Citation
Oryshchyn, Danylo; Harun, Nor Farida; Tucker, David; Bryden, Kenneth; and Shadle, Lawrence, "Fuel utilization effects on system
efficiency in solid oxide fuel cell gas turbine hybrid systems" (2018).
Ames Laboratory Accepted Manuscripts
. 357.
Fuel utilization effects on system efficiency in solid oxide fuel cell gas
turbine hybrid systems
Abstract
A computational analysis was conducted to optimize the design of a solid oxide fuel cell - gas turbine hybrid
power generator, focusing on the impact that fuel utilization within the fuel cell has on system efficiency and
installed costs. This is the first ever design-study considering the effect of fuel utilization on performance, as
well as on the optimum power split. This hybrid system attained high electric generation efficiencies (>70%)
over a wide range of operating conditions (60% < fuel utilization < 90%) while the fuel cell stack size
decreased in proportion to decreasing the fuel utilization. A one-dimensional fuel cell model was used to
simulate the fuel cell while GateCycle® was used to simulate the performance of the associated recuperated
turbine and various subsystems necessary for thermal management. For each test case, the size of the solid
oxide fuel cell, gas turbine, and recuperator, as well as the fuel and air flow rates, hot-air bypass set point, and
heat exchange effectiveness in the solid oxide fuel cell manifold were varied to obtain 550 MWe output. In
addition, anode recycle, turbomachinery efficiency, and various thermal management options were tested.
The maximum system efficiency (75.6%) was attained for the single-pass solid oxide fuel cell with highly
efficient turbomachinery when the solid oxide fuel cell used 80% of the incoming fuel. Efficiency was
essentially flat from 75% fuel utilization through 85% fuel utilization. Employing anode recycle starting at
65% resulted in roughly 1 percentage point efficiency decrease for each percent increase in fuel utilization. For
minimized solid oxide fuel cell degradation, a near 50:50 power split case was studied resulting in 68.6%
efficiency and the solid oxide fuel cell using 55% of the incoming fuel. Because of shifting half of the power
generation to the gas turbine, the size of the fuel cell stack was reduced by 25% as compared to that at
maximum efficiency (80% fuel utilization).
Keywords
Advanced power system, Cycle analysis, Hybrid, Solid oxide fuel cell, Gas turbine, Fuel utilization
Disciplines
Applied Mechanics | Energy Systems
Contents lists available atScienceDirect
Applied Energy
journal homepage:www.elsevier.com/locate/apenergy
Fuel utilization e
ff
ects on system e
ffi
ciency in solid oxide fuel cell gas
turbine hybrid systems
Danylo Oryshchyn
a, Nor Farida Harun
a, David Tucker
a, Kenneth M. Bryden
b, Lawrence Shadle
a,⁎aU.S. Department of Energy, National Energy Technology Laboratory, 3610 Collins Ferry Rd., Morgantown, WV 26507, United States bSimulation and Decision Science Program, Ames Laboratory, Ames, IA 50011, United States
H I G H L I G H T S
•
SOFC-GT hybrids were designed for various levels of SOFC fuel utilization, Uf.•
System efficiency was high, > 70% LHV, between 65 and 90% Ufusingsyngas fuel.
•
Lower Ufincreased the Nernstpoten-tial and GT inlet T, while SOFC size dropped.
•
Peak efficiency was found with SOFC only providing 65% of the power share.•
Hybrid designs with 40–60% output power from SOFC had comparable economics.G R A P H I C A L A B S T R A C T
A R T I C L E I N F O
Keywords:
Advanced power system Cycle analysis Hybrid
Solid oxide fuel cell Gas turbine Fuel utilization
A B S T R A C T
A computational analysis was conducted to optimize the design of a solid oxide fuel cell - gas turbine hybrid power generator, focusing on the impact that fuel utilization within the fuel cell has on system efficiency and installed costs. This is thefirst ever design-study considering the effect of fuel utilization on performance, as well as on the optimum power split. This hybrid system attained high electric generation efficiencies (> 70%) over a wide range of operating conditions (60% < fuel utilization < 90%) while the fuel cell stack size decreased in proportion to decreasing the fuel utilization. A one-dimensional fuel cell model was used to simulate the fuel cell while GateCycle®was used to simulate the performance of the associated recuperated turbine and various subsystems necessary for thermal management. For each test case, the size of the solid oxide fuel cell, gas turbine, and recuperator, as well as the fuel and airflow rates, hot-air bypass set point, and heat exchange effectiveness in the solid oxide fuel cell manifold were varied to obtain 550 MWeoutput. In addition, anode
recycle, turbomachinery efficiency, and various thermal management options were tested. The maximum system efficiency (75.6%) was attained for the single-pass solid oxide fuel cell with highly efficient turbomachinery when the solid oxide fuel cell used 80% of the incoming fuel. Efficiency was essentiallyflat from 75% fuel utilization through 85% fuel utilization. Employing anode recycle starting at 65% resulted in roughly 1 per-centage point efficiency decrease for each percent increase in fuel utilization. For minimized solid oxide fuel cell degradation, a near 50:50 power split case was studied resulting in 68.6% efficiency and the solid oxide fuel cell
https://doi.org/10.1016/j.apenergy.2018.07.004
Received 7 December 2017; Received in revised form 18 June 2018; Accepted 1 July 2018
⁎Corresponding author.
E-mail address:[email protected](L. Shadle).
Applied Energy 228 (2018) 1953–1965
Available online 20 July 2018 0306-2619/ Published by Elsevier Ltd.
using 55% of the incoming fuel. Because of shifting half of the power generation to the gas turbine, the size of the fuel cell stack was reduced by 25% as compared to that at maximum efficiency (80% fuel utilization).
1. Introduction
Solid oxide fuel cell (SOFC) - gas turbine (GT) hybrids show top electrical efficiencies around 70%, the highest of any power-cycle[1]. Efficiency and the types of fuel used in fuel-cells (e.g., syngas, reformed methane) combine to produce lower emissions than other fossil-pow-ered technologies[2]. With this hybrid, high efficiency can be reached without the need for water cooling; therefore, water consumption per MWe is lower than other technologies which approach the 70% effi -ciency mark. Integrated gasification SOFC-GT hybrid systems have higher power and better efficiency than integrated gasification com-bined cycle (IGCC)[3]. The impact of carbon capture and sequestration were also reported to be much lower for SOFC-GT than supercritical pulverized coal and IGCC[3,4], even outperforming natural gas com-bined cycle (NGCC)[4]. High part-load efficiencies for turndown ratios up to 90% have been shown for these hybrids[5–7], which with the fuel flexibility of both SOFCs and GTs [5,8–10], make this hybrid a robust fit for the evolving power-grid which is employing increasing numbers of generators that depend upon intermittent energy sources.
Issues which have prevented a large commercial market-share for the SOFC-GT hybrid include: high system-coupling and non-linear interactions [11], and the concomitant complexity of controls for the hybrid system, as well as the high expense and relative fragility (short working life) of fuel-cells. Work in the literature suggests that longer fuel cell lifetime can be achieved in hybrid systems at lower fuel utilization, directly impacting the economic viability of these systems[12].
Other researchers have looked at direct fired hybrid systems through parametric evaluation of performance criteria. Tarroja, et al. [13]developed a thermodynamic design space for a hybrid system operating on hydrogen, where the sizing of all components, except the fuel cell, were varied. They found that the highest fuel utilization is constrained by the heat requirement for the cathode. It was also shown that the penalty for operating the system at lower fuel utilization is substantial, and that the highest system efficiency is achieved at the highest feasible SOFC fuel utilization (Uf).
Based on an exergy analysis, Akkaya et al.[14] found that the highest system efficiency in a pressurized, direct-fired hybrid with steam bottoming occurs at 75%Uf. In this case, methane was used as the fuel, and like Tarroja et al.[13]the fuel cell size wasfixed with its performance determined using a lumped model.
In another methane fueled direct hybrid, Yang, et al.[15]concluded that maximum hybrid efficiency is achieved when the SOFC-system outflow matches the desired turbine inlet temperature. Active tem-perature control of the cathode-inlet was found to have a detrimental effect on system efficiency. Fuel utilization was not varied in the study. While incorporating thermal management methods for indirect natural gas reforming in a fuel cell turbine hybrid system, Haynes et al. [16]demonstrated that minimal change is observed in net efficiency with fuel utilization. Altering theUffrom 75% to 95% changes the system efficiency by less than 2 percentage points, implying tre-mendousflexibility in hybrid power systems.
Paramount to economic viability, cost factors other than efficiency Nomenclature
1D one-dimensional
A plant availability (%)
AR anode recycle
CMP compressor
COE cost of electricity DOE Department of Energy
FE fossil energy
GT gas turbine
IGCC integrated gasification combined cycle LHV lower heating value [kJ/kg]
LSM lanthanum strontium magnetite NETL National Energy Technology Laboratory NGCC natural gas combined cycle
Ni-YSZ nickel-doped yttria-stabilized zirconia P production rate [MWh/yr]
SOFC solid oxide fuel cell
SP single-pass
TD&IC Technology Development & Integration Center YSZ yttria-stabilized zirconia
ASR area specific resistance [Ωm2] Uf fuel utilization by SOFC (%)
C cost [$]
Csys system installed cost [$]
E exergy [kW]
F Faraday’s constant [C/mol] α charge transfer coefficient
β fraction of capital costs attributed to major equipment γ fraction of operating costs attributed to fuel
h specific enthalpy [kJ/kg] i current density [mA/cm2]
i0 exchange current density [A/cm2]
ṁ massflow [kg/s]
n number of electrons transfer per reaction η electrochemical loss [V]
p partial pressure [atm] Pr pressure ratio
ηt turbine isentropic efficiency [%] ηc compressor isentropic efficiency [%] Ru ideal gas constant [8.314 J/mol-K] s specific entropy [kJ/kg-K]
T temperature [K]
Vcell cell voltage, overpotential [V] VNernst Nernst potential [V]
x mole fraction
Y depreciation time [years]
°
G
Δ standard Gibbs free energy [kJ] ΔP pressure differential [kPa]
Subscripts
0 dead state
c compressor
CI cathode inlet
FC pertaining to the fuel cell IT turbine inlet
t turbine
TPB triple phase boundary bulk anode/cathode stream act activation
dif diffusion
must include size,flexibility, capital investment, and the share of power which each subsystem must provide, as well as their respective main-tenance cycles over the service life. It is therefore essential to under-stand the interplay between subsystems of the SOFC-GT hybrid tofind design criteria that will allow it to deliver highly efficient andflexible power at minimal cost.
Work in the literature has identified the promise of operating SOFC-GT hybrids atUflower than the maximum possible[14,17,18]. How-ever, the optimalUfwas not identified. The previous work in the lit-erature kept the size of the fuel-cell constant[13–18], which may ob-scure the economic potential associated with varying theUfof a hybrid system. The objective of this study is to identify the design SOFC Uf level which gives the highest lower heating value (LHV) efficiency for a SOFC-GT hybrid system while minimizing the installed costs.
The study described here uses a one-dimensional (1D)finite dif-ference model of the fuel-cell. Temperature, current density, and fuel utilization are localized phenomena across the fuel cell, which are not resolved when using lumped averages for these values[10,15,19–23]. For example, peak temperatures and temperature gradients are re-ported to vary widely depending on whether the planar SOFC stack is operated in co-flow, counter-flow, or cross-flow configuration [21]. When an SOFC is simulated at highUf, the current density profiles re-sult in voltage calculations that are more accurate and yet substantially different from a lumped model result. Localized degradation must be considered to obtain accurate estimates of fuel-cell lifetimes[22]. Po-larization losses are not accurately reflected using lumped models, but can be accurately captured in a 1D model[23]. In a lumped model, the temperature profile is assumed to be linear andfirst order, and in a distributed model with a more realistic temperature profile, heat transfer and the associated turbine performance, which relies on the heatflow from the fuel cell, can be dramatically different[10].
For thefirst time the impact of fuel-utilization on system perfor-mance is investigated in detail to design a direct fired hybrid plant while considering plant efficiency, equipment size, and thermal man-agement including thermal gradients across the SOFC. Included in this study are analyses of anode-recycle, turbomachinery efficiencies, and gas bypass and heat-exchange alternatives. Results are also used to estimate capital costs associated with a given design, which largely
depend on the power-share between fuel-cell and turbine. Ultimately, this study provides a basis for evaluating tradeoffs between optimum efficiency and economic viability.
2. Methods
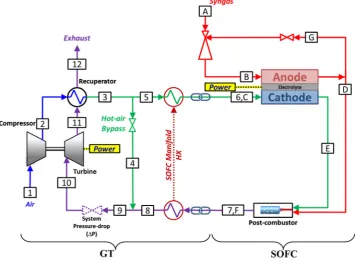
[image:5.595.303.558.78.365.2]A directfired SOFC-GT hybrid cycle (Fig. 1) was studied. Colors
[image:5.595.120.479.471.735.2]Fig. 1.Process diagram of the SOFC-GT hybrid system.
Table 1
Baseline SOFC-GT hybrid operating parameters.
SOFC system parameters
Current density 550 mA/cm2
Initial fuel cell temperature 1073 K
Cathode-inlet pressure 405 kPa
Cathode-inlet temperature 973 K
Fuel cell average solid temperature 1108 K
Cathode-inlet composition: Air (vol.%) O221.0%,
N279.0%
Anode inlet pressure 405 kPa
Anode inlet temperature 1073 K
Anode inlet composition: Syngas (vol.%) CH40.0%,
CO212.0%,
CO 28.6%, H229.1%,
H2O 27.1%
N23.2%
SOFC geometry
Total cell area 200.0 × 200.0 mm
Anode thickness 0.5 mm
Electrolyte thickness 0.008 mm
Cathode thickness 0.05 mm
Oxidant/fuel channel size 2.0 × 2.0 mm
Number of oxidant/fuel channels 50
Number of fuel cell nodes (length) 20 (1 cm each)
GT system parameters
Pressure ratio 4
Compressor isentropic efficiency 83.6%
GT isentropic efficiency 87.0%
HX parameters
Effectiveness of GT recuperator 93.0%
D. Oryshchyn et al. Applied Energy 228 (2018) 1953–1965
indicate purpose and/or state of the stream. Air serving the GT is blue; compressed/heated air serving the SOFC cathode is green; fuel is red; the post-SOFC (exhaust) stream which is expanded through the turbine is purple. Nominal conditions are presented inTable 1. In this cycle, ambient air (stream-1) is compressed to 4 atmospheres (stream-2) and heated through a recuperator (3) to serve as the SOFC cathode oxidant. A portion of this preheated air can be bypassed (4) to achieve the de-sired SOFC temperature, nominally 700 °C. The heated, compressed air that is not bypassed enters the SOFC cathode via a manifold (5) where it may interact with heat from the SOFC-system’s post-combustor. This manifold/post-combustor interaction is depicted in Fig. 1 as SOFC Manifold Heat Exchange (HX) and stream 6,C is the resulting preheated
flow stream fed into the cathode.
The fuel used in this study was a typical coal derived syngas (stream A) preheated to 800 °C. The fuelflow to the anode (stream B) was equal to the fuel fed to the system when there was no anode recycle (AR) (stream G). AR is when the anode effluent is recycled through the anode again to achieve higher stackUfwhile operating cells at a lower cellUf. AR is commonly used to control carbon deposition when using methane fuel[16]. The impact of carbon deposition on the performance of SOFC were studied by Ma et al. [24]. While AR was not required for the methane free syngas used (Table 1), it was considered to evaluate its impact on hybrid performance. In those cases where AR was used, stream G dilutes the fuel being fed to the anode (B).
Air and syngas interact exothermically within the SOFC, generating electricity. The anode effluent (D) was combined with the cathode
ef-fluent (E) in the post combustor. This high temperature combustion exhaust (7,F) was used to preheat the incoming air in the cathode manifold when additional preheating of the SOFC was required.
The products of combustion in the SOFC manifold (8) were com-bined with any hot air diverted away from the SOFC (4) to form stream 9. After accounting for system pressure-drop this becomes the turbine inlet flow. These hot compressed products of combustion expand through the turbine (10) generating electricity and give up heat (in the recuperator) to newly compressed air before leaving system as process exhaust (11).
The study was conducted for a total system powerfixed at 550 MW. The size is consistent with other Department of Energy (DOE) systems studies[25]. SOFC and GT cost are both driven by size. Thus, the power split impacted the equipment cost of each design. Unlike previous studies which varied only GT size, the SOFC size was also changed to accommodate their respective delivery requirements. Cells were added to the SOFC stack to obtain a given generation-capacity. By changing cell number, the total current was kept constant for a given stack, while changing the power-output of the fuel-cell system. The recuperator fectiveness and its area could vary to satisfy this parameter. The ef-fectiveness of the manifold HX was varied between 0% and 50% to increase the cathode-inlet temperature desired in those cases requiring additional heat. The desired cathode airflow was achieved by varying both the compressor size and fraction of hot-air bypass.
2.1. General model
The scope of the two computer models used for this investigation is shown in Fig. 1 –denoted as SOFC and GT under the process flow schematic. The SOFC model included the performance of the SOFC it-self, as well as the post combustor. The GT model comprised the bal-ance of the plant including the compressor, turbine, recuperator, hot-air bypass, as well as the SOFC manifold HX. The“chain-links”drawn in Fig. 1indicate where data were exchanged between the two models.
The physical characteristics were kept constant at the cell level for the SOFC (Table 1). Efficiency characteristics were also kept constant at the process level in the GT. All components varied in size according to their required throughput. The baseline isentropic efficiencies for the turbomachinery were taken from a previously constructed model of the Mercury-50 turbine (a commercial recuperated machine), therefore the
isentropic efficiencies of its turbomachinery (compressor and turbine) reflect those of the actual 5 MWemachine.
2.2. Sensitivity studies
The impact of turbomachinery efficiencies and of AR were eval-uated by a series of test simulations. In the former the compressor and turbine efficiencies were implemented at two levels over the entire range ofUf–one carrying over from the Mercury-50 model and one representing turbomachinery efficiencies expected in a large-scale GT. The isentropic efficiencies of the large-scale equipment were taken as 90.5% for the compressor and 91.7% for the GT[26].
For the AR sensitivity study, cases above 65%Ufwere simulated using both single-pass (SP) and various levels of AR to achieve com-parable stack (global) fuel utilizations. All AR cases operated with 65% Uf at the cell. AR was increased incrementally to achieve stack fuel utilization of 70, 75, 80, 85, and 90%. Methods for calculating cell and stack fuel utilizations in the context of AR are described by Harun et al. [27].
Under thermal management, the requirement of 700 °C for cathode-inlet temperature was relaxed. The hot-air bypass valve was closed and the cathode-inlet temperature was permitted to rise. This was im-plemented forUf at 20, 50, and 70% to investigate an approach for decreasing losses associated with bypass operations. The impacts were evaluated on cathode-inlet temperature, system efficiency, and power split.
2.3. Fuel cell model
The fuel was a coal-derived, methane-free syngas (Table 1). Therefore, fuel-reforming did not impact the results since the fuel processing unit was not considered in this study. Pressure loss across the SOFC and heat loss to the surroundings were assumed to be negli-gible. Included in the SOFC model was a post-combustor for unutilized fuel. Full details of the model development and validation are discussed in a publication by Hughes et al.[19].
The SOFC was simulated via a 1D model built in MATLAB®. The SOFC design was based on anode-supported, co-flow, and planar
con-figuration, using stainless steel 441 (SS441) as the interconnects. The anode, cathode, and electrolyte, were composed of nickel-doped yttria-stabilized zirconia (Ni-YSZ), YSZ- lanthanum strontium magnetite (LSM), and YSZ, respectively.
The SOFC length was discretized usingfinite difference andfinite volume difference to quantify the profiles of solid and air temperatures, local current density, Nernst potential, polarization losses, and fuel utilization. The cell voltage,Vcell, was calculated using Eqs.(1)–(5).
= − − −
Vcell VNernst ηdif ηact ηohm (1)
= − °+ ⎡ ⎣ ⎢ ⎤ ⎦ ⎥ V G F R T F ln p p p Δ 2 2 . Nernst H O u
H O
H O
0.5
2 2 2
2 (2) ⎜ ⎜ ⎟ ⎜ ⎟⎟ = ⎛ ⎝ ⎛ ⎝ ⎞ ⎠ + ⎛ ⎝ ⎞ ⎠ ⎞ ⎠
η R T
F x x x x x x 2 ln 1 2ln dif
u H bulk H O TPB
H O bulk H TPB
O bulk O TPB , · , , · , , , 2 2 2 2 2 2 (3) ⎜ ⎟ = ⎛ ⎝ ⎞ ⎠ −
η R T
αnF i i sinh 2 act u 1 0 (4) =
ηohm ASR i· (5)
2.4. Balance-of-plant model
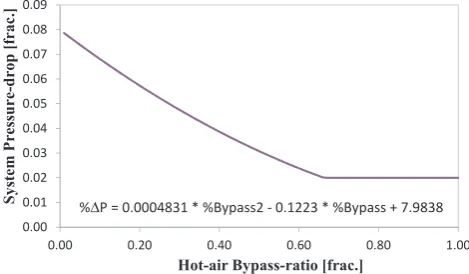
Built in GateCycle®, this model included the recuperated turbine engine, HX at the cathode-inlet manifold, and total-system pressure-drop (shown as a purple valve inFig. 1). Pressure-drop developed in the hybrid system was a function of the amount of air routed through the hot-air bypass. This function, shown inFig. 2, was derived from ex-perimental data at the National Energy Technology Laboratory’s (NETL’s) cyber-physical Hybrid Performance test facility.
The maximum pressure-drop occurred when all the air entering the compressor passed through the fuel-cell (no air bypassing the SOFC). Minimum system pressure-drop was 2% of the total system pressure. HX at the cathode-inlet manifold was controlled by setting the HX-eff ec-tiveness to the minimum required to obtain the required cathode-inlet temperature. HX-effectiveness of the recuperator, however, was con-stant at 93%.
2.5. Model interactions
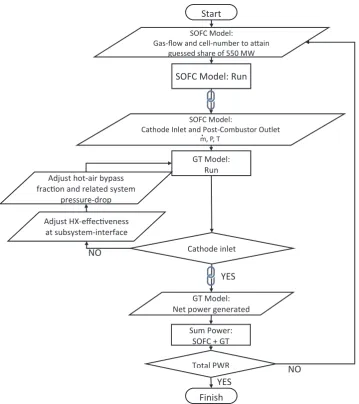
The order of calculations for the two models is shown in Fig. 3, where, at“Start”a target or guessed SOFC power-output was specified with a given fuel utilization and a specified amount of AR. A solution for the SOFC model was then obtained using guessed flow rates and stack size (number of cells). The results were provided to the GT model and its solution was found by iterating to obtain a specified cathode-inlet temperature. If the GT and SOFC solutions did not provide the required total power, then the calculation was looped back to the top with new estimates for massflow rate and stack size.
Each case in this study was a separate hybrid system designed to attain 550 MWe output with the SOFC operating at a given Uf. The trends compiled do not indicate behavior of a static system in response to changes inUf.
2.6. Exergy loss
To identify mechanisms responsible for resultant system net effi -ciencies, exergy loss was evaluated at the: hot-air bypass; SOFC inlet manifold; pressure-drop process; compressor and turbine. Exergy loss is given as the exergy difference between high-availability and lower-availability states of the working-fluid. Fluid-exergy was evaluated using Eq.(6):
= − − −
Efluid m ḣ [( station ho) T s so( o)] (6)
Enthalpy and entropy were evaluated using REFPROP[28].
2.7. Cost
The system installed cost (Csys) (including recuperated turbine and fuel-cell) was based on the equipment costs given by the Energy Information Administration[29,30]. The Mercury-50 has a simple-cycle twin–the Centaur-50–which was used in evaluating equipment costs for the various hybrid designs. The GT-recuperator cost, with respect to the rest of the GT, was scaled to match the 4% cost differential between the Solar Turbines simple-cycle Centaur-50 and recuperated-cycle Mercury-50 engines[31]. As the recuperator area scales withflow-rate for each hybrid case, the 4% cost differential was used for the re-cuperator in each design-case. The power delivered by each individual cell in the SOFC stack was the same for each design-case. Therefore, the SOFC cost was scaled by a constant factor ($/kW). The costing calcu-lation is shown in Eq.(7).
= +
Csys 1.04CGTPWRGT CSOFCPWRSOFC (7)
Csysis the sum of two products: GT subsystem cost per kilowatt and GT subsystem capacity; SOFC subsystem cost per kilowatt and SOFC sub-system capacity. Values for this study are as follows;CGT= $973/kW, CSOFC= $7108/kW,PWRGT= 142–483 MW,PWRSOFC= 620–0407 MW.
The cost of electricity (COE) is calculated by adding the sum of the op-erating cost and the cost of capital depreciation as described in Eq.(8):
= +
COE C
β Y P A C
γ
· · · sys op
(8)
whereYis the number of years over which the capital costs are depre-ciated,Pis the production rate,Ais the plant availability,Copis the op-erating costs,βis the portion of capital costs that is attributed to major equipment, andγis the portion of operating costs attributed to fuel costs. Plant depreciation was taken to be 10 years consistent with recent reports on the life expectancy for a SOFC in a hybrid configuration[12,22]. The availability was assumed to be 90%. Values forβandγwere taken to be 0.6 and 0.8, respectively, based upon the relative contributions reported in NETL baseline studies for NGCC systems[25].
3. Results
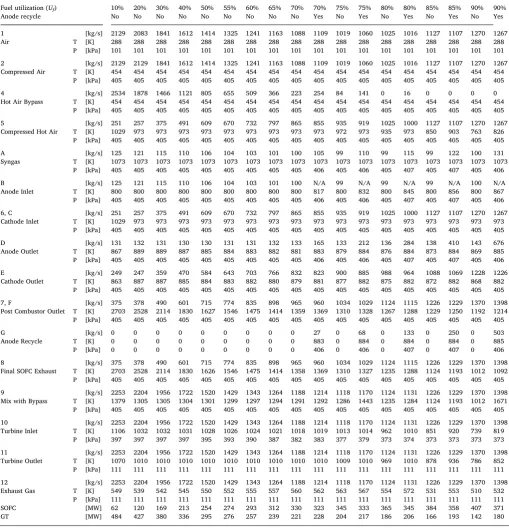
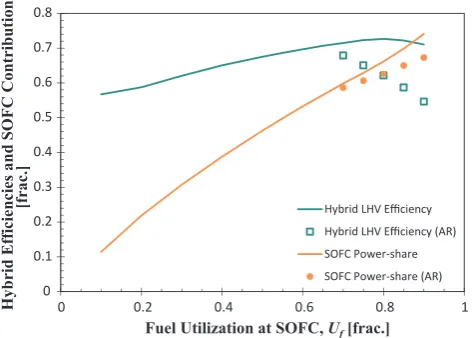
The stream data for each case executed is compiled inTable 2. This table also shows the electric power generated by both subsystems in each case. The data for all cases using the baseline conditions is ar-ranged in order of increasingUf. The hybrid system efficiency increased with increasingUf, maximizing at 80%Uf. Above 80%Ufthe efficiency dropped offslightly (Fig. 4). The hybrid efficiency at 65% and 90%Uf were nearly identical. As expected, the contribution of the SOFC to the total 550 MWe output increased with increasing Uf. At peak system efficiency, the power split SOFC-GT was only 65%. A 50:50 power split was attained with aUfof 55% corresponding to a drop of only 3 per-centage points in efficiency.
Increasing the efficiency of the turbomachinery increased the maximum hybrid electrical generating efficiency from 72.6 to 75.6%. The efficiency trend, with respect toUf, were similar, but slightly less sensitive. The average improvement of the more efficient turbo-machinery was to increase the hybrid electrical efficiencies by 3.5%. This increase was slightly larger at the very low levels ofUfand slightly smaller for the highest Uf values tested. The more efficient turbo-machinery also resulted in a shift in the power split. The SOFC:GT power split was on the average 2.7 percentage points lower for the more efficient compressor-turbine pair. This effect was a bit more pronounced for those cases relying on SOFC for power, i.e., with very highUfand with AR, and less pronounced for cases dominated by the GT at the lowest levels ofUf.
Finally, employing AR to get toUflevels higher than 65% reduced hybrid system efficiency. Employing AR did reduce the SOFC power contribution by as much as 10% at the highestUflevel and this would be accompanied by a similar reduction in SOFC size.
Two key factors influenced this set of results: exergy loss in various processes across hybrid cycle and changes in fuel-cell Nernst potential. InFig. 5, the electric power delivered to the power used is compared with that power used or rejected from the hybrid cycle. The power
0.00 0.01 0.02 0.03 0.04 0.05 0.06 0.07 0.08 0.09
0.00 0.20 0.40 0.60 0.80 1.00
[image:7.595.314.549.591.728.2]System Pressure-drop
[frac.]
Hot-air Bypass-ratio [frac.]
%ΔP = 0.0004831 * %Bypass2 - 0.1223 * %Bypass + 7.9838
Fig. 2.Pressure-drop function derived from test-stand results.
D. Oryshchyn et al. Applied Energy 228 (2018) 1953–1965
output by the SOFC continuously increased, while GT decreased with Uf; both varied in a non-linear manner. The compressor power was highest at very low and very highUf, but power lost in the exhaust was highest at low Uf and decreased as Uf increased. The result was a minimum in exergy loss at 80%Uf. This comparison is analogous to calculating the fuel-efficiency ratio, and adds detail to the fate of the fuel-energy through a given design-case.
The red line inFig. 5indicates the efficiency of the SOFC subsystem. The SOFC efficiency increased withUf, though the rate of increase was less for higherUf. This“tailing off”is attributed to the drop in Nernst potential which accompanies high Uf. Below 75%Uf, the GT experi-enced little change in efficiency. The 10%Ufcase used a higher SOFC cell temperature, which led to higher turbine-inlet temperature (TIT) and resulting higher GT efficiency.
For several SPUfcases, the working-fluid temperature history is plotted inFig. 6for the hybrid using a SP SOFC over the full range ofUf. The abscissa shows stream locations matchingFig. 1. From stream 3 to 6,C, heat is added at the SOFC manifold in preparation for entering the cathode. From the post combustor (7,F) to the turbine inlet (10), heat was transferred either via manifold HX or via hot-air bypass depending on the difference between post-combustor temperature and the cathode-inlet temperature requirement. Thus, peak temperatures at (7,F) resulted from additional heat generated by combusting unused fuel from the SOFC exhaust. The temperature changes from the
post-combustor (7,F) to the turbine (10) are indicative of a loss in exergy for thefluid leaving the post-combustor. In cases designed for 20%-75%Uf, working-fluid temperature available for the turbine converged (streams 7,F to 10) and GT efficiency remained essentially constant over this range. By contrast as the designUfwas increased for 80% and above the turbine-inlet temperatures were progressively lower. This resulted in lower GT efficiency. The open circles inFig. 6represent the tempera-tures in the GT operated in simple cycle, i.e., without any fuel being used by the SOFC. The convergedTITfor design-cases withUfbetween 0.2 and 0.75 was only 5 K below the GT-only case.
The additional combustion accompanying lowerUfmay be expected to benefit the GT. However, atUfbelow the optimum efficiency, tem-peratures from the post-combustor must be reduced to avoid excessive energy being recycled back to the cathode via the recuperator. This was accomplished using hot-air bypass. This practice caps the maximum turbine inlet temperature, and so the efficiency of the GT. The impact of Ufon the system becomes clearer when exergy-loss is evaluated.
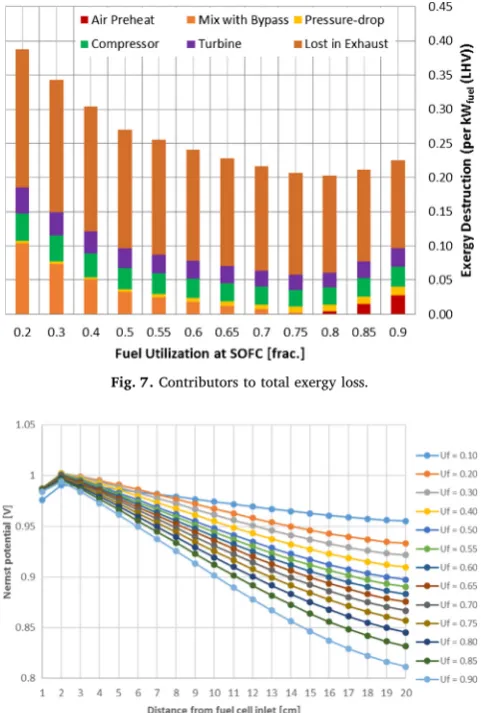
Exergy loss results from frictional pressure loss, the mixing offlows at different temperatures, indirect transfer of heat from onefluid to another, or heat left unused in the system exhaust. The total exergy lost in each design-case is shown inFig. 7with respect to the energy en-tering the system as fuel. In addition, the thermal exergy-loss con-tributions from processes composing the system are split out separately for each design-case in the color-coded column segments inFig. 7. The
Start
SOFC Model:
Gas-flow and cell-number to attain guessed share of 550 MW
SOFC Model: Run
SOFC Model:
Cathode Inlet and Post-Combustor Outlet
GT Model:
Run
GT Model:
Net power generated
Sum Power:
SOFC + GT
Total PWR
Finish
Cathode inlet
Adjust hot-air bypass
frac
ti
on and related system
pressure-drop
NO
NO
YES
YES
m, P, T
.
[image:8.595.120.480.53.458.2]Adjust HX-e
ff
ec
ti
veness
at subsystem-interface
maximum efficiency (at 80%Uf) coincides with the minimum exergy-loss. Aside from exhaust losses, the heat-exchange processes were the most sensitive toUf. Except for pressure-drop, all exergy-losing pro-cesses displayed a minimum around 80%Uf. The exergy loss for pres-sure-drop increased with increasingUf. Loss via indirect heat exchange occurred atUf> 75% and grew with increasingUf.
The AR cases had generally lower efficiencies than the SP cases with the sameUf. The AR exergy-loss values were less sensitive toUfthan the AR efficiency values. This extra sensitivity can be attributed to a re-duction in the Nernst potential associated with the anode-recycle pro-cess because of diluting the fuel being fed to the fuel cell.
The relationship between the Nernst potential across a given cell
andUfis shown inFig. 8. AsUfincreased, the total Nernst potential of the cell decreased. This means the cell will produce less power for the fuel utilized by the SOFC, as indicated byFig. 5.
[image:9.595.43.553.79.611.2]The effect thatUfhad on the sizes of the three major components of the hybrid is presented inFig. 9. The required number of cells in the SOFC increased and the GT capacity decreased in nearly linear fashion with increasingUf. This was consistent with the increased power share from the SOFC with increasingUf(Fig. 4). Unlike SOFC and GT size, that recuperator size did not fall offmonotonically withUf, but instead began to rise for cases above 75%Uf. This curve correlated well with the compressor mass-flow (Fig. 10), which also exhibited a minimum withUf. At low levels ofUf, the compressor demand was high, but this Table 2
Summary stream table for all baseline cases varying Ufand AR.
Fuel utilization (Uf) 10% 20% 30% 40% 50% 55% 60% 65% 70% 70% 75% 75% 80% 80% 85% 85% 90% 90%
Anode recycle No No No No No No No No No Yes No Yes No Yes No Yes No Yes
1 [kg/s] 2129 2083 1841 1612 1414 1325 1241 1163 1088 1109 1019 1060 1025 1016 1127 1107 1270 1267
Air T [K] 288 288 288 288 288 288 288 288 288 288 288 288 288 288 288 288 288 288
P [kPa] 101 101 101 101 101 101 101 101 101 101 101 101 101 101 101 101 101 101
2 [kg/s] 2129 2129 1841 1612 1414 1325 1241 1163 1088 1109 1019 1060 1025 1016 1127 1107 1270 1267
Compressed Air T [K] 454 454 454 454 454 454 454 454 454 454 454 454 454 454 454 454 454 454
P [kPa] 405 405 405 405 405 405 405 405 405 405 405 405 405 405 405 405 405 405
4 [kg/s] 2534 1878 1466 1121 805 655 509 366 223 254 84 141 0 16 0 0 0 0
Hot Air Bypass T [K] 454 454 454 454 454 454 454 454 454 454 454 454 454 454 454 454 454 454
P [kPa] 405 405 405 405 405 405 405 405 405 405 405 405 405 405 405 405 405 405
5 [kg/s] 251 257 375 491 609 670 732 797 865 855 935 919 1025 1000 1127 1107 1270 1267
Compressed Hot Air T [K] 1029 973 973 973 973 973 973 973 973 973 972 973 935 973 850 903 763 826
P [kPa] 405 405 405 405 405 405 405 405 405 405 405 405 405 405 405 405 405 405
A [kg/s] 125 121 115 110 106 104 103 101 100 105 99 110 99 115 99 122 100 131
Syngas T [K] 1073 1073 1073 1073 1073 1073 1073 1073 1073 1073 1073 1073 1073 1073 1073 1073 1073 1073
P [kPa] 405 405 405 405 405 405 405 405 405 406 405 406 405 407 405 407 405 406
B [kg/s] 125 121 115 110 106 104 103 101 100 N/A 99 N/A 99 N/A 99 N/A 100 N/A
Anode Inlet T [K] 800 800 800 800 800 800 800 800 800 817 800 832 800 845 800 856 800 867
P [kPa] 405 405 405 405 405 405 405 405 405 406 405 406 405 407 405 407 405 406
6, C [kg/s] 251 257 375 491 609 670 732 797 865 855 935 919 1025 1000 1127 1107 1270 1267
Cathode Inlet T [K] 1029 973 973 973 973 973 973 973 973 973 973 973 973 973 973 973 973 973
P [kPa] 405 405 405 405 405 405 405 405 405 405 405 405 405 405 405 405 405 405
D [kg/s] 131 132 131 130 130 131 131 132 133 165 133 212 136 284 138 410 143 676
Anode Outlet T [K] 867 889 889 887 885 884 883 882 881 883 879 884 876 884 873 884 869 885
P [kPa] 405 405 405 405 405 405 405 405 405 406 405 406 405 407 405 407 405 406
E [kg/s] 249 247 359 470 584 643 703 766 832 823 900 885 988 964 1088 1069 1228 1226
Cathode Outlet T [K] 863 887 887 885 884 883 882 880 879 881 877 882 875 882 872 882 868 882
P [kPa] 405 405 405 405 405 405 405 405 405 405 405 405 405 405 405 405 405 405
7, F [kg/s] 375 378 490 601 715 774 835 898 965 960 1034 1029 1124 1115 1226 1229 1370 1398
Post Combustor Outlet T [K] 2703 2528 2114 1830 1627 1546 1475 1414 1359 1369 1310 1328 1267 1288 1229 1250 1192 1214
P [kPa] 405 405 405 405 405 405 405 405 405 405 405 405 405 405 405 405 405 405
G [kg/s] 0 0 0 0 0 0 0 0 0 27 0 68 0 133 0 250 0 503
Anode Recycle T [K] 0 0 0 0 0 0 0 0 0 883 0 884 0 884 0 884 0 885
P [kPa] 0 0 0 0 0 0 0 0 0 406 0 406 0 407 0 407 0 406
8 [kg/s] 375 378 490 601 715 774 835 898 965 960 1034 1029 1124 1115 1226 1229 1370 1398
Final SOFC Exhaust T [K] 2703 2528 2114 1830 1626 1546 1475 1414 1358 1369 1310 1327 1235 1288 1124 1193 1012 1092
P [kPa] 405 405 405 405 405 405 405 405 405 405 405 405 405 405 405 405 405 405
9 [kg/s] 2253 2204 1956 1722 1520 1429 1343 1264 1188 1214 1118 1170 1124 1131 1226 1229 1370 1398
Mix with Bypass T [K] 1379 1305 1305 1304 1301 1299 1297 1294 1291 1292 1286 1443 1235 1284 1124 1193 1012 1671
P [kPa] 405 405 405 405 405 405 405 405 405 405 405 405 405 405 405 405 405 405
10 [kg/s] 2253 2204 1956 1722 1520 1429 1343 1264 1188 1214 1118 1170 1124 1131 1226 1229 1370 1398
Turbine Inlet T [K] 1106 1032 1032 1031 1028 1026 1024 1021 1018 1019 1013 1014 962 1010 851 920 739 819
P [kPa] 397 397 397 397 395 393 390 387 382 383 377 379 373 374 373 373 373 373
11 [kg/s] 2253 2204 1956 1722 1520 1429 1343 1264 1188 1214 1118 1170 1124 1131 1226 1229 1370 1398
Turbine Outlet T [K] 1070 1010 1010 1010 1010 1010 1010 1010 1010 1010 1009 1010 969 1010 878 936 786 852
P [kPa] 111 111 111 111 111 111 111 111 111 111 111 111 111 111 111 111 111 111
12 [kg/s] 2253 2204 1956 1722 1520 1429 1343 1264 1188 1214 1118 1170 1124 1131 1226 1229 1370 1398
Exhaust Gas T [K] 549 539 542 545 550 552 555 557 560 562 563 567 554 572 531 553 510 532
P [kPa] 111 111 111 111 111 111 111 111 111 111 111 111 111 111 111 111 111 111
SOFC [MW] 62 120 169 213 254 274 293 312 330 323 345 333 365 345 384 358 407 371
GT [MW] 484 427 380 336 295 276 257 239 221 228 204 217 186 206 166 193 142 180
D. Oryshchyn et al. Applied Energy 228 (2018) 1953–1965
dropped with increasingUfas the amount of hot-air bypass was reduced because of the reduced cooling demand to moderate the cathode inlet temperature,TCI. AtUflevels above 75% the compressor demand began to increase again to supply the increased demands by SOFC for cathode airflow and cooling. The 10%Ufcase required a higher cathode-inlet temperature, so less compressor power was needed to achieve sufficient
cooling via the hot-air bypass. This was a result of maintaining constant average temperature in the SOFC for all cases.
The component costs were scaled from the capacity of each of the power-systems in this hybrid. Noting the order of magnitude difference between the primary and secondary y-axes ofFig. 11, costs of the SOFC dominated the cost of the hybrid system. The recuperator costs were estimated to be more than 2 orders of magnitude lower than the SOFC. The GT system costs were estimated to be a factor of 3 lower than the SOFC costs at 20%Ufwhen SOFC power share was approaching one-quarter of the hybrid. The cost ratio, SOFC:GT, was estimated to in-crease to 6:1 when the power share was equal. At optimum efficiency, Uf= 80%, the cost ratio approached 10:1. For these reasons, the in-stalled costs can be thought to be dictated by the fuel cell size.
3.1. Sensitivity
[image:10.595.46.283.59.228.2]Three sensitivity studies were carried out to check the impact of assumptions made for this design-study. The assumptions investigated included: (1) setting afixed, low HX-effectiveness at the subsysinterface in the cathode manifold; (2) allowing a higher fuel cell tem-perature; (3) using more efficient turbomachinery. The differences in efficiency and power split compared to the base line tests (Table 2) are presented for several cases in each sensitivity study.
Table 3gives these differences resulting from requiring afinite (5%) HX-effectiveness at the cathode-inlet manifold. Thefirst three cases were SP with Uf< 75%, in which the manifold effectiveness was limited to 5% rather than allowing it to drop to the 0% indicative of perfectly isolated streams. A slight drop in overall efficiency was ob-served which appeared to get larger asUfwas reduced. This was ac-companied by a slight increase in the SOFC contribution. In the AR cases, the manifold HX was more integral to the thermal management system andfixing its effectiveness at 5% reduced heat transferred to the cathode, decreasing the cathode-inlet temperature thereby increasing theTIT. As a result, hybrid efficiency increased and the SOFC power contribution reduced marginally for 70 and 75%Ufcases. In the 80%Uf cases, the difference in effectiveness was small and had correspondingly little impact on efficiency and power split.
The impact of raising the allowable cell-temperature to reduce the need for precooling cathode-inlet air is shown inTable 4. Increasing the allowable cathode-inlet temperature had a positive effect in the 20%Uf case. Like in the HX-effectiveness study, the impact of these changes was very small but increased with decreasingUf.
As the GT equipment becomes more efficient, the efficiency of the hybrid-system on this fuel increased as shown inTable 5. The average change in system efficiency was 3.5% increase with more advanced machinery and the power split shifted an average of 2.6% in favor of the GT. The only deviation from this was at 20%Uf, where the more efficient machinery produced a greater impact. The impact on power split however deviated from this average at both the extremes cases. At the highestUf, the SOFC power contribution was reduced by 3% from the baseline case, while at the lowestUf, the SOFC contribution was only reduced by 2% from its respective baseline case. Both results are inconsistent with the premise that hybrid performance always requires maximizing SOFC power share.
The optimumUfremained the same for both sets of turbomachinery. Also, the impact ofUfdecreased when more efficient turbomachinery was used. Thus, there was less of an efficiency drop-from-optimum in designing for a 50:50 power split as opposed to designing for the op-timal efficiency. Increases in system efficiency found in each of these sensitivity investigations corresponded with decreases in the share of electricity produced at the SOFC.
4. Discussion
The SOFC stack was simulated using a co-flow arrangement because computationalfluid dynamic studies predict minimal thermal gradients
0 0.1 0.2 0.3 0.4 0.5 0.6 0.7 0.8
0 0.2 0.4 0.6 0.8 1
Hybri
d
Effi
cienci
es
and SOFC
Contri
[image:10.595.45.283.270.433.2] [image:10.595.44.283.482.647.2]bution
[frac.]
Fuel Utilization at SOFC, Uf[frac.]
Hybrid LHV Efficiency
Hybrid LHV Efficiency (AR)
SOFC Power-share
SOFC Power-share (AR)
Fig. 4.Hybrid system LHV efficiency; SOFC contribution to the total electrical power generated.
0% 10% 20% 30% 40% 50% 60% 70% 80% 90% 100%
0.9 0.85 0.8 0.75 0.7 0.65 0.6 0.55 0.1 0.2 0.3 0.4 0.5 0
Fuel Utilization, Uf[frac]
Exhaust Power
Compressor Power Used
GT Electricity
SOFC Electricity
Fig. 5.Power delivered by SOFC and GT as compared to parasitic power usage and power unrecovered from the hybrid cycle for baseline system varied over the entire Ufrange.
compared to those using crossflow and counter-currentflow arrange-ments. However, most fuel cell stacks are designed in crossflow
con-figuration to simplify mechanical connections serving as the manifold into and out from the stack. The main conclusion regarding the impact of fuel utilization on efficiency and its remarkable insensitivity to the power split between the SOFC and the GT are expected to be unaffected by theflow configuration because these were design-studies such that the size of the turbine, recuperator, and fuel cell were adjusted to op-timize performance. The thermal gradients were not found to be a
limiting constraint in any of the cases as the fuel utilization was varied. However, when theflow arrangement is altered the thermal gradients will become greater and may become a limiting constraint requiring designs for additional thermal management.
The highest hybrid LHV-efficiency observed was 75.6%. This max-imum occurred in the turbomachinery sensitivity study for the 80%Uf case using the more efficient GT as is consistent with the scale of this system. When less efficient turbomachinery was used in the baseline case, the peak hybrid efficiency was only 72.6% at the sameUf; how-ever, the trends remained the same. Hybrid efficiency remained at high levels over a wide range ofUf. The efficiency at 90%Ufwas the same as that attained at a Ufbetween 65% and 70%. The efficiency fell off gradually for both higher and lowerUf. The increases in SOFC’s Nernst potential and GT’s massflow andTIThave compensated for the reduced Ufand sustain high system efficiencies. This trend is consistent with other researchers also looking at the influence ofUfon similar hybrid systems, but running on methane and including reforming and AR. Akkaya et al.[14]found that exergy efficiency maximizes for 75%Uf and drops offgradually for both higher and lower levels ofUf. Haynes and Wepfer[16]found very little or no variation in SOFC-GT hybrid efficiencies over the range of 50–90%Uf.
Others have reported that hybrid performance is very sensitive to decreasingUf. McLarty et al.[32]reported a 15% decrease in system efficiency when dropping from 80% to 60%Ufdespite large increases in TIT. However, they conducted their design analysis using a series of parametric tests in which the operating conditions were varied one at a time rather than designing an optimum system for each. While con-ducting the latter type of design analysis, it was often found that more than one parameter had to change to achieve the predefined opera-tional targets and total power output. For example, both equipment sizes andflows were always altered as theUfchanged. In addition, their configuration used cathode recycle and recuperator bypass to achieve cathodeflow and temperature requirements. These changes negatively affect the SOFC Nernst potential and exergy loss. The observed diff er-ences in sensitivity can be attributed to these changes in design ana-lysis, as well as to differences in operational and thermal management strategies.
Tarroja et al.[13]reported that system efficiency continuously in-creases withUfwhen using H2for fuel. They noted, however, that for the cases above 80%Ufthey were unable to manage the thermal de-mands of the SOFC and identify a practical constraint. In this study, a high HX-effectiveness at the cathode-inlet manifold was employed to obtain practical solutions for cases higher than 80%Uf, but the mea-sures taken resulted in reduced system efficiencies. It has been re-cognized (e.g.,[15,9]) that some heat exchange could be designed into the cathode manifold between the post-combustor exhaust and the cathode air inlet. The effectiveness of that HX was expected to be low and was permitted to vary from 0% to 50%. AsUfincreased above 80%, the effectiveness of HX increased reaching the 50% limit at 90% Uf. Cases attempted above 90%Ufdid not produce practical solutions due to the similar constraints identified by Tarroja et al.[13]. The net result was a change in process efficiency which was less sensitive to changes inUf, especially near the maximum efficiency.
[image:11.595.43.284.56.413.2] [image:11.595.45.281.439.604.2]Hybrid cycle analysis using methane as fuel found much lower system efficiencies, peaking at 66%[14]and 62%[16], compared to 75.6% reported here. These differences can be explained by differences in fuel, turbomachinery, and AR. The turbomachinery employed in both studies were consistent with a distributed microgrid and combined heat and power applications, rather than the high efficiency equipment employed in our sensitivity study. This would account for an additional 3–5 percentage point difference. A methane free syngas was used and energy costs to produce that fuel composition were not considered. This would include the heat of steam reforming methane and of heating it to the process temperature. The effect of this difference is not insignif-icant, but has not yet been established. The most significant difference was that the earlier studies evaluated systems with AR to control carbon Fig. 7.Contributors to total exergy loss.
Fig. 8.Nernst potential from cell entrance to exit.
Fig. 9.Component sizes for each design-case (the dashed curve refers to sec-ondary axis).
D. Oryshchyn et al. Applied Energy 228 (2018) 1953–1965
deposition during on-cell reforming of methane. They used AR to control steam to carbon ratio of 2.5:1. This study found that AR resulted in a 5–15 percentage point reduction of efficiency depending on how much recycle was employed, principally due to the impact that AR has on fuel cell Nernst potential. The sensitivity to changes inUfmay be expected to vary depending on the level ofUfwhen AR is employed;
however, neither of these studies report the level of AR nor the level of Ufbased upon SP for the cell, only the net stackUf.
McLarty et al.[32]reported an initial design system efficiency of 66% for coal syngas. This can be consistent with the results presented here of 75.6%, because thefinal optimized design performance would include the incremental influences of individual parameters such asUf, Pr,TFC,ηt,ηc. All of which are expected to increase their performance for an optimum design. In addition, some differences would be expected due to the differences in heat management and cathode recirculation described above.
4.1. Thermal management
From the Exergy analysis, it was evident that the most efficient hybrid design appears to be one in which neither heating, nor cooling was required for the cathode-inletflow at the cathode-inlet manifold. This is consistent with the conclusion of Yang et al.[15]that the op-timum hybrid system is where turbine-inlet temperature matches the post-combustor-outlet temperature. This obviates bypass air, but also requires that the cathode-inlet and post-combustor outlet streams be thermally separated from each other. A sensitivity study was conducted to evaluate the impact of assuming afixed, low HX-effectiveness at the subsystem-interface rather than allowing the effectiveness to vary. However, when it is necessary to operate a hybrid system at offdesign conditions, process controllers bypassing either hot or cold air around the fuel cell have been found to be highly efficient ways to follow load demands or make other necessary process state transitions.
The SOFC stack was simulated using a co-flow configuration which is reported to minimize thermal gradients compared to crossflow and counter-currentflow planar fuel cell arrangements[21]. The thermal gradient across the solid phase in the SOFC using this 1-D model was constrained to 6 °C/cm. During the analysis the SOFC was operated near this limit; only the highest Ufcases (> 70%) without AR exhibited solids thermal gradients appreciably below this constraint approaching 5 °C/cm at 90%Uf. As theUfwas reduced below 70% cases, progres-sively more hot air bypass was required to maintain the average SOFC operating temperature of 835°C. Conversely, for the higherUfcases, all the heat available from the recuperated compressor airstream was re-quired and the maximum solids thermal gradient was still not attained. Currently, most fuel cell stacks are built using a crossflow configuration to simplify mechanical connections serving as the manifold into and out from the stack. The 1-D SOFC model does not permit the analysis of a crossflow SOFC configuration. Based upon the 3-dimensional compu-tationalfluid dynamic studies the localized thermal gradients will likely be larger for crossflow or counterflow configurations which will re-quire changes be made to these thermal management systems. The ef-fect should be similar to selecting a lower thermal gradient constraint or SOFC operating temperature.
4.2. Anode recycle
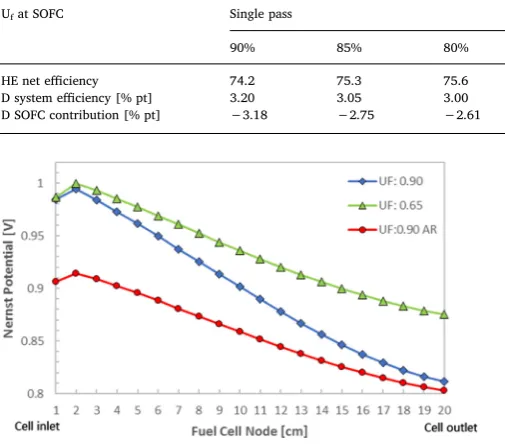
For a methane-free syngas the AR was not required in cases below 70%Uf. Designing for recycle detracts from the efficiency readily at-tained in SP designs. As noted by Harun et al. from the same set of simulations, and shown byFig. 12 [27],“The recirculation of anode-off
gas back into the inlet caused significant reduction in the Nernst po-tential.” This is attributed to a reduction in H2 partial pressure. Therefore, the SOFC subsystem required more anode gas (fuel)flow to generate equivalent power.
4.3. Capital cost
[image:12.595.45.284.54.240.2]Fuel utilization affected the share of power produced by each sub-system which in turn determined the size of each subsub-system, and thereby the capital cost. This is evident if the shape of the SOFC-cost curve inFig. 11is compared to the SOFC power-share curve inFig. 4. Fig. 10.Inlet mass-flows to the SOFC-GT hybrid wherefilled circles represent
[image:12.595.45.282.280.427.2]the recuperated GT cycle and the other symbols represent the AR hybrid cases.
Fig. 11.Equipment-only costs for major components of the SOFC-GT hybrid–
SOFC, GT, Recuperator (the dashed curve refers to secondary axis).
Table 3
Impact of requiring a small, given HX-effectiveness (5%) at the SOFC-GT in-terface.
Ufat SOFC Single pass Anode recycle
75% 70% 20% 80% 75% 70%
D system efficiency [% pt] −0.18 −0.24 −2.66 −0.10 0.86 0.57
D SOFC contribution [% pt]
0.20 0.18 0.97 0.13 −0.75 −0.53
Table 4
Impact of closing hot-air bypass and allowing higher cathode-inlet temperature to obviate inlet air cooling.
Ufat SOFC 70% 50% 20%
DTin- cathode [K] 25 68 79
D system efficiency [% pt] −0.13 −0.16 1.88
[image:12.595.36.290.498.565.2] [image:12.595.37.290.611.662.2]The magnitude of the SOFC cost inFig. 9dominated that of the hybrid system.
4.4. Power split
[image:13.595.43.296.80.304.2] [image:13.595.312.552.546.701.2]At the maximum system efficiency, the power-share carried by the SOFC was found to be 63.6%. While the hybrid test facility at NETL was designed with the SOFC producing 60% of the power[33], it is typically operated with the SOFC producing nearly 90% of the power generated. Often, design-studies on SOFC-GT hybrids have not considered power split as a parameter[13,15,18,9,32]. Conventional practice has been to develop an SOFC-GT hybrid using an SOFC:GT power split of 80:20 [18,14]. Li and Weng state simply that“In the SOFC-GT hybrid system, SOFC is the most important component that contributes most of the net power”[9]. McLarty et al. agree with Li and Weng, but state that“It is extremely likely that the optimal operating condition for a specific FC stack will be at lower fuel utilization when hybridized with a gas tur-bine”[32].
Because the efficiency of the SOFC, by itself, is higher than that of the GT, it is intuitive to expect that maximizing the power from fuel cell would provide the most efficient hybrid system efficiency. For this reason it is understandable that past researchers either did not report that the peak efficiency was found at lowUf[13], or reported only that peak efficiency occurred at lowUfand that lowUfreduced the SOFC power contribution[34], yet connected them together, and conclude that the highest efficiencies could be achieved with lower contributions from the SOFC.
Van Osdol et al. were the first to report that theUfis the most sensitive parameter affecting the power split[17]. Others have reported that the exergy efficiency maximizes at 75%Uf[14], and that efficiency is constant over a range ofUffrom 50% to 80%[16]; however, these studies were operational parametric tests withfixed equipment size and without attempting to optimize the designs. Others fixed theUfand varied the fuel composition[15,9], GT equipment[13], or operating conditions in the SOFC[18]to evaluate performance impacts. None of the systems studies varied the SOFC size and the GT size to define the optimal hybrid configurations at each operating point.
This means that the configuration with the longest predicted life also uses a SOFC just over half the size of what would be required for a hybrid operating at maximum levels ofUf. In turn, the SOFC in a hybrid
operating at a pressure ratio of 4 would be only one-half the size of the equivalent standalone SOFC.
Degradation of the SOFC has been reported to increase at lower temperature, higher current densities, and high Uf [22,35,36]. This current design-study was conducted byfixing the operating tempera-ture, current density, and varying theUf. However, it is recognized that during operations the SOFC will degrade. Since the degradation rate is reduced at lowerUf[27], one strategy would be to extend the life by changingUf. As degradation proceeds theUfcan be reduced resulting in additional power being shifted to the turbine. For a hybrid designed for maximum efficiency the initial Uf was found to be 80% and the SOFC:GT power split was 65:35. As the hybrid plant ages theUfwould be decreased in this off-design scenario until the hybrid achieves a 50:50 power split. Only a small decrease in efficiency would be ex-pected if the GT and recuperator were slightly oversized to account for this degradation. Thus, the operating mode can be altered to optimize the power output and life expectancy to meet economic needs.
The design of a power system with a 50:50 power split and 55%Uf will extend the SOFC life while maintaining high efficiency (68%). Furthermore, it would require an SOFC of just over one-half the size of that required for a hybrid operating at maximum levels ofUf. In turn, the SOFC in a hybrid operating at a pressure ratio of 4 would be only one-half the size of the equivalent standalone atmospheric SOFC.
To optimize the power split, criteria must be established to evaluate the relative contributions of operating cleanly and efficiently with the initial capital investment. The contribution of equipment and efficiency to the COE were estimated using Eq.(8)and are presented inFig. 13. As the efficiency of the process increases the amount of fuel required to produce electricity decreases. The contribution of syngas fuel costs was assumed to be a constant value of 80% of the operating costs as is ty-pical for natural gasfired power systems. Syngas costs were estimated to be twice that of natural gas used in NETL baseline studies[25]. The contribution of the operating costs to the COE exhibited a minimum of 63.6% for SOFC power. The major equipment costs were projected to be 80% of the total plant costs based upon the same baseline studies and Table 5
Impact of higher-efficiency turbomachinery.
Ufat SOFC Single pass AR
90% 85% 80% 75% 70% 65% 20% 90%
HE net efficiency 74.2 75.3 75.6 75.5 74.8 74.3 64.5 57.3
D system efficiency [% pt] 3.20 3.05 3.00 3.22 3.29 3.65 5.77 2.63
D SOFC contribution [% pt] −3.18 −2.75 −2.61 −2.69 −2.63 −2.75 −2.01 −3.09
Fig. 12.Comparison of Nernst potentials across a given cell.
Fig. 13.Cost of electricity (COE) for directfired hybrid configurationfired on syngas as a function of the power split designed over the entire range of Uf
studied. The dashed curve represents an extrapolation of the slopes between preceding values.
D. Oryshchyn et al. Applied Energy 228 (2018) 1953–1965
were depreciated over 10 years based upon SOFC life expectancy[22]. The power plant was assumed to be available and operating 90% of the time. The contribution of these capital costs to the COE increased nearly linearly with SOFC power share for the hybrid system. The combined effect was a COE also displaying a broad minimum over a wide range. The COE was relatively constant for power splits with 40–60% SOFC contribution. If the fuel or equipment costs take on a greater share of the operating or lesser share of the capital expenses, respectively, then the power split favors the GT. Conversely, if the fuel or major equip-ment take on lesser share of the operating or greater share of the capital expenses, respectively, then the power split shifts in favor of the SOFC. Likewise, a SOFC lifetime shorter than 10 years favors a higher power contribution from the GT, while a longer life favors more SOFC power.
5. Conclusions
This is thefirst ever design-study conducted on a directfired solid oxide fuel cell-gas turbine hybrid to evaluate the optimal power split by varying fuel utilization. Plant designs for a wide range of fuel utilization were developed and the designs evaluated considering efficiency, equipment size, and realistic thermal management systems. Unlike previous systems analyses, a one-dimensional fuel cell model was used to capture localized effects which impact system performance para-meters to achieve greater accuracy than a lumped model approach. In this way design cases were achieved with the constraints of solid oxide fuel cell operational temperatures and thermal gradients. The optimal system efficiency was found in a design which avoided active tem-perature-control of the cathode-inlet stream (by heat exchange at the cathode-inlet manifold, or hot-air bypass). The net system efficiency reached a maximum of 75.6% at 80% fuel utilization for the single pass configuration with a resulting power split of 66.2% fuel cell to 33.8% turbine.
The hybrid performance was fairly level near the maximum value– that is, the influence of fuel utilization and power split on efficiency was small near this maximum. The hybrid with 50% power from the solid oxide fuel cell had the same efficiency as the hybrid with 80% power from the solid oxide fuel cell. Likewise, efficiencies were the same at fuel utilization of 55% and 90%.
The hybrid performance was even less sensitive to changes in fuel utilization with more efficient turbomachinery. The net system effi -ciency of 72.3% occurred at 75% fuel utilization; and at 85% fuel uti-lization the system was 72.2% efficient. More efficient turbomachinery decreased the power contribution which must be made by the solid oxide fuel cell.
The solid oxide fuel cell performance was negatively affected at higher levels of fuel utilization and by anode recycle. The solid oxide fuel cell Nernst potential was reduced by increasing fuel utilization and it was strongly degraded by anode recycle. Adding anode recycle for syngas resulted in large reductions in system efficiency. With anode recycle the system efficiency was 62.1% at 80% fuel utilization, a 10.5 percentage point drop compared to no anode recycle. This is dramatic considering that the single pass efficiency at 65% fuel utilization was 70.7%, only 1.9 percentage points less than the optimal efficiency at a fuel utilization of 80%. Anode recycle is not recommended for the hy-brid configuration studied.
A target design with a 50:50 power split was considered to max-imize operational flexibility, fuel-cell lifetime, and equipment cost savings. This design point was found to be 68.6% efficiency with a fuel utilization of 55% and had a hybrid installed cost which was four-fifths that of the 80% fuel utilization case.
The hybrid system shows a performance optimum at solid oxide fuel cell fuel-utilizations less than the theoretical maximum for a standalone solid oxide fuel cell. Therefore, hybridizing allows less extreme fuel-cell design. As observed by others, by generating power from solid oxide fuel cell-stack exhaust, the electrical efficiency of the hybrid generally exceeds that of either the solid oxide fuel cell or gas turbine alone. This
leads to the conclusion that the most cost-effective and efficient de-ployment of a solid oxide fuel cell would be in a solid oxide fuel cell-gas turbine hybrid, as both fuel-cost and stack-replacement can be mini-mized via this hybridization, though the comparative cost of control systems may reduce this benefit. Noting that optimum efficiency is reached at lower solid oxide fuel cell:gas turbine power splits, an op-portunity is recognized for earlier adoption of fuel-cell power-produc-tion. This is because the fuel-cell need not be so large, and because it can be operated in a manner less stressful on its materials–mitigating the risk of buying and breaking a fuel-cell.
Disclaimer
This report was prepared as an account of work sponsored by an agency of the United States Government. Neither the United States Government nor any agency thereof, nor any of their employees, makes any warranty, expressed or implied, or assumes any legal liability or responsibility for the accuracy, completeness, or usefulness of any in-formation, apparatus, product, or process disclosed, or represents that its use would not infringe privately owned rights. Reference herein to any specific commercial product, process, or service by trade name, trademark, manufacturer, or otherwise does not necessarily constitute or imply its endorsement, recommendation, or favoring by the United States Government or any agency thereof. The views and opinions of authors expressed herein do not necessarily state or reflect those of the United States Government or any agency thereof.
Acknowledgement
This work was funded by the U.S. Department of Energy (DOE) Crosscutting Research program, implemented through the Technology Development & Integration Center (TD&IC), Coal, in the Office of Fossil Energy (FE).
References
[1] McPhail SJ, Leto L, Boigues-Munoz C. Yellow pages of SOFC technology. Rome (Italy): ENEA, National Agency for New Technologies, Energy and Sustainable Economic Development; 2012–2013.
[2] Welaya Y, Mosleh M, Ammar N. Thermodynamic analysis of a combined gas turbine power plant with a solid oxide fuel cell for marine applications. Int. J. Nav. Archit. Ocean Eng. 2013:529–45.
[3] Park S, Ahn J, Kim T. Performance evaluation of integrated gasification solid oxide fuel cell/gas turbine systems including carbon dioxide capture. Appl Energy 2011;88:2976–87.
[4] Nease J, Adams T. Comparative life cycle analyses of bulk-scale coal-fueled solid oxide fuel cell power plants. Appl Energy 2015;150:161–75.
[5] Tucker D, Haynes C, Geoghegan P. Needs and approaches for novel characterization of direct hybrid fuel cell/gas turbines. In: Proceedings of the ASME 2015 power and energy conversion conference, San Diego, California, USA; 2015.
[6] Trasino F, Bozzolo M, Magistri L, Massardo A. Modeling and performance analysis of the Rolls-Royce Fuel Cell Systems Limited 1 MW plant. J Eng Gas Turbines Power 2011;133(59328).
[7] Barelli L, Bidini G, Ottaviano A. Part load operation of a SOFC/GT hybrid system: dynamic analysis. Appl Energy 2013;110:173–89.
[8] Harun N. Fuel composition transients in solid oxide fuel cell gas turbine hybrid systems for polygeneration application, PhD Dissertation at McMaster University, Hamilton, Ontario; 2015. p. 155.
[9] Li Y, Weng Y. Performance study of a solid oxide fuel cell and gas turbine hybrid system designed for methane operating with non-designed fuels. J Power Sources 2011;196:3824–35.
[10] Harun N, Tucker D, Adams T. Technical challenges in operating an SOFC in fuel
flexible gas turbine hybrid systems: coupling effects of cathode air massflow. Appl Energy 2017;190:852–67.
[11] Pezzini P, Celestin S, Tucker D. Control impacts of cold-air bypass on pressurized fuel cell turbine hybrids. J Fuel Cell Sci Technol 2015;12(1). p. 011006: 1-8. [12] Harun F, Zaccaria V, Tucker D, Traverso A, Adams II T. Degradation analysis of
SOFC for various syngas compositions in IGFC systems. In: International gas turbine congress 2015, November 2015, Paper no. 38, Tokyo, Japan; 2015.
[13] Tarroja B, Mueller F, Maclay J, Brouwer J. Parametric analysis of a solid oxide fuel cell gas turbine design space. J. Eng. Gas Turbines Power 2010;132(July). p. 072301:1-11.
[14] Akkaya A, Sahin B, Huseyin EH. An analysis of SOFC/GT CHP system. Int J Hydrogen Energy 2008;33(10):2566–77.