ORIGINAL ARTICLE
Study on Rollover Index and Stability
for a Triaxle Bus
Zhilin Jin
1*, Jingxuan Li
1, Yanjun Huang
2and Amir Khajepour
2Abstract
Vehicle rollover, and its resulting fatalities, is an actively researched topic especially for multi-axle vehicles in the field of vehicle dynamics and control. This paper first presents a new rollover index for a triaxle bus to accurately evaluate its rollover possibility and then discusses the influence laws of the vehicle rollover dynamics to explore the mecha-nism of its stability. First, a six degree of freedom rollover model of the triaxle bus is developed, including lateral, yaw, roll motion of the sprung mass of the front/rear axle, and roll motion of the unsprung mass of the front/rear axle. Next, some key parameters of the vehicle rollover model are identified. A new rollover index is deduced according to the basics of vehicle dynamics, to predict vehicle rollover risk for the triaxle bus, which is verified by TruckSim. Further-more, the influence laws of vehicle rollover dynamics by vehicle parameters and road parameters are discussed based on the simulation results. More importantly, the results show that the new method of modeling can precisely describe the rollover dynamics of the studied bus, and the proposed new index can effectively evaluate the rollover possibility. Therefore, this study provides a theoretical basis to improve anti-rollover ability for triaxle buses.
Keywords: Rollover stability, Dynamic model, Triaxle bus, Rollover index, Vehicle active safety
© The Author(s) 2019. This article is distributed under the terms of the Creative Commons Attribution 4.0 International License (http://creat iveco mmons .org/licen ses/by/4.0/), which permits unrestricted use, distribution, and reproduction in any medium, provided you give appropriate credit to the original author(s) and the source, provide a link to the Creative Commons license, and indicate if changes were made.
1 Introduction
Vehicle rollover is a serious safety accident. Among more than 6 million police-reported motor vehicle crashes that occurred in the United States in 2014, only 2.0% involved vehicle rollovers, with the proportion of rollo-ver accidents leading to fatal crashes being 18.9% [1]. Some heavy vehicles are more likely to rollover due to their high center of gravity (CG), large mass and so on. Therefore, it is important for heavy vehicles to improve their active safety [2]. Triaxle buses, with a high center of gravity and long wheelbase, are often reported in rollover accidents with many passengers lost. As a result, accu-rately evaluating the possibility and exploring the mecha-nism of dynamic stability of a triaxle bus is important.
Over the years, it is necessary to establish an accurate and effective rollover dynamic model to predict vehicle roll motion. As a basic vehicle model, the two degrees of freedom (DOF) vehicle model with four wheels was used,
which considered the road bank angles by Yu et al. [3, 4]. Also, the rollover dynamics state can be more accurately expressed by adding the roll plane model. So, a three-DOF model with lateral, yaw and roll motion is used by Zhang et al. [5]. Furthermore, the vertical motions of sprung and unsprung masses are added to the three-degree-of-freedom model by Jin et al. [6]. Considering the effect of the road excitation, a seven-DOF combined model was proposed based on a vehicle with a traditional chassis by Bao et al. [7]. In addition, a nonlinear eight-DOF model was put forward including longitudinal, lat-eral, yaw, roll, and four-wheel rotational motions [8, 9]. In order to reflect the vehicle dynamic characteristics in different directions, a dynamic model with sixteen-DOF was presented, including longitudinal, lateral, yaw, ver-tical, pitch, roll motions of the vehicle body; the rota-tional motion of four wheels, and vertical motions of the unsprung masses [10]. Na et al. proposed a new four-node membrane element model based on bending modi-fication [11]. The verification and validation procedures are presented for the originally developed FE model of a Para transit bus, which was built by Bojanowski [12].
Open Access
*Correspondence: [email protected]
1 Department of Vehicle Engineering, Nanjing University of Aeronautics & Astronautics, Nanjing, Jiangsu Province 210016, China
Although numerous research studies have been done on vehicle rollover, few have focused on triaxle buses. Wei Liu et al. [13] presented an integrated chassis sta-bility control for the triaxle electric bus. In order to analyze the roll dynamics, an effective rollover index is indispensable. In recent years, many effective rollover indexes have been proposed. Vehicle speed is a key fac-tor to prevent rollover, a safety speed model for rollover prevention is built under the condition of vehicle rapid rotation [14]. Lateral-load transfer ratio (LTR) is one of the most commonly used rollover indexes. To make the traditional LTR more accurate, the effect by uncer-tainties in the height of the vehicle’s center of gravity, road disturbances, and possible multiple sensor faults are considered based on a nonlinear two-wheel vehicu-lar system [15]. Phanomchoeng et al. [16] developed a new rollover index using the lateral acceleration as well as the vertical acceleration to detect both tripped and untripped rollovers. For heavy articulated vehicles with multiple axles, Huang et al. [2] proposed a multiple-rollover-indices. Li et al. [17] introduced an improved predictive LTR (IPLTR) which was based on an 8-DOF nonlinear vehicle model. Furthermore, as a dominant factor in vehicle rollover accident, drivers’ operations should also be considered. An extended model of a driver-vehicle closed-loop system, with the time delay of driver’s operation was proposed by Jin et al. [18]. Li et al. [19] analyzed the vehicle lateral stability and anti-rollover, which considered the effect of road excitation. A rollover coefficient is defined by Odenthal et al. that basically depends on the lateral acceleration to activate the emergency steering and braking system [20]. Imine et al. [21] proposed an estimator to estimate the vehicle rollover stability, including roll angle, yaw rate, and lat-eral acceleration.
In addition, some actuation systems have been pre-sented, such as active steering, differential braking, active suspension, active anti-roll bar, and integrated chas-sis control. Gaspar et al. [22] studied the brake systems to obtain the anti-roll moment to realize anti-rollover of heavy vehicles. The combination of steering and braking control is applied to avoid rollover by Odenthal et al. [20]. Vu et al. [23] used active anti-roll bar as an actuator to improve the roll stability of heavy vehicles. A novel con-trol method of Invariance Concon-trol is applied by Wollherr et al. [24].
In this paper, taking a tour bus 3A as research object, a method of modeling a triaxle bus rollover dynamic is developed and, taking the deflection of the flexible frame into consideration, a new evaluation method of rollover is proposed to detect the possibility of the triaxle bus rollover. Also, the dynamic rollover stability of the triaxle bus is analyzed.
This paper is organized as follows: in Section 2, the dynamic model of triaxle bus rollover is established, includ-ing yaw, lateral, and roll motion. Then, the real axles of the triaxle bus are considered equivalent to a virtual rear axle to simplify the dynamics. Section 3 proposes a new rollover index is proposed to detect the rollover risk and it is also ver-ified in two different cases. In addition, the roll dynamics sta-bility of the triaxle bus is simulated in typical maneuvers, and the influence laws of rollover stability of vehicle parameters and driving factors are discussed in Section 4. Furthermore, the roll stability of anti-external disturbances is analyzed in Section 5. Finally, some conclusions are made in Section 6.
2 Roll Dynamic Model of the Triaxle Bus 2.1 Triaxle Bus Model
Given the exclusive features of a triaxle bus, such as the high center of gravity, the long wheelbase, the large num-ber of passengers’ capacity, and the variable distribution of passengers having an impact on its roll property; the triaxle bus is divided into the front and the rear part. For a triaxle bus, the middle and rear axle are on the same side of the center of mass, and the distance between them is short such that the roll coupling can be neglected. Therefore, the middle and rear axle of the triaxle bus is equivalent to a vir-tual rear axle, as shown in Figure 1.
The distance between the first axle and the virtual rear axle is the equivalent wheelbase, which will be obtained in Section 2.3. In addition, a twisted bar with a constant stiff-ness is assumed to link between the front axle and the vir-tual rear axle.
For the sake of simplicity, the influence of the pitching, the lateral wind, and longitudinal motion are neglected, the road profile is regarded as symmetric with respect to the x axle. Thus, a six-DOF vehicle model is established, as shown in Figure 2.
From D’Alembert’s principle, the motions of the above model are as follows.
Lateral motion:
Yaw motion:
Roll motion of the front sprung mass of the front axle:
Roll motion of the sprung mass of the rear axle:
(1)
may−msfhfϕ¨sf−msrhrϕ¨sr=2FY1cosδ+2FYr.
(2) IZr˙=2aFY1cosδ+Mr.
(3)
IXfϕ¨sf=msfhfay+msfghfϕsf−kf(ϕsf−ϕuf)
−lf(ϕ˙sf− ˙ϕuf)+kb(ϕsf−ϕsr).
(4)
IXrϕ¨sr=msrhray+msrghrϕsr−kr(ϕsr−ϕur)
Roll motion of the unsprung mass of the front axle:
Roll motion of the unsprung mass of the virtual rear axle:
where the lateral acceleration of the sprung mass is:
and
(5) 2FY1hc+muf(huf−hcf)ay= −mufg(huf−hcf)ϕuf
−kf(ϕsf−ϕuf)−lf(ϕ˙sf− ˙ϕuf)+kufϕuf.
(6) 2(FY2+FY3)hc+mur(hur−hcr)ay=kurϕur
−murg(hur−hcr)ϕur−kr(ϕsr−ϕur)−lr(ϕ˙sr− ˙ϕur),
(7) ay= ˙v+ur,
(8)
FYr =FY2+FY3,
Mr=2bFY2+2cFY3.
In above-mentioned equations, m denotes the total
mass of triaxle bus. ms shows the total sprung mass. mf means the unsprung of mass vehicle. msf and msr repre-sent the equivalent sprung mass of the front and the rear axle. muf and mur refer to the unsprung mass of the front and the rear axle. a, b and c are the longitudinal distance from the CG to the front axle, middle axle and rear axle, respectively. ay is the lateral acceleration. u is the longitu-dinal speed, and v denotes the lateral velocity. r denotes the yaw rate of the sprung mass. hf is the height between the center of front sprung mass and the roll center, while hr is the height between the center of rear sprung mass and the roll center. huf and hur are the height of the center of the front unsprung mass and the rear unsprung mass, measured upwards from the road. hcf and hcr are the height of the front roll center and the rear roll center, measured upwards from the road, respectively. IXf and IXr are the roll inertia of the front sprung mass and the rear sprung mass, measured about the roll axle. Iz is yaw inertia of the triaxle bus. ϕsf and ϕsr are the roll angle of the front sprung mass and the rear sprung mass. FYr the lateral force of the tires at the virtual axle, Mr is the yaw moment caused by the virtual rear axle. FY1, FY2 and FY3 are the lateral force of the tires at the first axle, the mid-dle axle and the rear axle, respectively. kf and kr are the equivalent roll stiffness coefficient of the front suspen-sion and the rear suspensuspen-sion. kuf and kur are the equiva-lent roll stiffness coefficient of the front unsprung mass and the rear unsprung mass. lf and lr are the equivalent roll damping coefficient of the front suspension and the rear suspension. kb is the torsion stiffness coefficient of vehicle frame.
In addition, the steering angle of front wheels δ is assumed to be sufficiently small that cosδ≈1 in Eqs. (1) and (2) holds.
X Y
a c
b
Y
a le
X
Figure 1 The equivalent model of the triaxle bus
/
sf sr
h h
/
sf sr
m m
/
uf ur
m m
/ sf sr /
sr sf
/ uf ur
/
f r
T T
The lateral forces in Eqs. (1) and (2) mainly depending on the physical properties of the tire and the corresponding side slip angles βf, βm and βr observed on the front, middle and rear wheels. The slip angle can be determined from the simple geometric relations:
Simplify the tire model with the cornering stiffness of tires is constant, the lateral forces of tires can be obtained.
where Kf, Km and Kr are the cornering stiffness of the front wheels, the middle wheels and the rear wheels.
(9)
βf =arctan
�
v+ar u
� −δf,
βm =arctan
�
v−br u
�
,
βr=arctan
�
v−cr u � . (10)
FY1= −Kfβf, FY2= −Kmβm, FY3= −Krβr,
M3=
hfmsf 0 hrmsr 0 −muf(huf−hcf) 0 −mur(hur−hcr) 0
, M4=
0 0 0 0 0 0 0 0 0 0 lf 0 0 0 0 lr
,
M5=
−IXf 0 0 −IXr
0 0
0 0
, M6= �
1 0 0 0 0 1 0 0
�
,
A1=
−(2Kf+2Km+2Kr)
u
−
mu2+2aKf−2bKm−2cKr
u
−(2aKf−2bKm−2cKr)
u
−
2a2Kf+2b2Km+2c2Kr
u
,
A2=
0 −hfmsu
0 −hrmsru
−2Kfhc
u
mufu2(huf−hcf)−2aKfhcf
u −2(Km+Kr)hc
u
muru2(hur−hcr)+2bKmhcr+2cKrhcr
u ,
A3=
kb+kf−msfghf −kb −kf 0
−kb kb+kr−msrghr 0 −kr
kf 0 −kuf+mufg(huf−hcf)−kf 0
0 kr 0 −kur+murg(hur−hcr)−kr
2.2 State Space Model of System
Setting U=ϕsf ϕsr ϕuf ϕur T
,V =ϕ˙sf ϕ˙sr
T
and sub-stituting Eqs. (9) and (10) into Eqs. (1)‒(8), the following equation of state space can be obtained:
where (11) Mq ˙ v ˙ r ˙ U ˙ V =Aq v r U V
+Bqδf,
Mq=
M1 02×4 M2
M3 M4 M5
02×2 M6 02×2
, Aq=
A1 02×4 02×2
A2 A3 A4
02×2 02×4 A5
,
Bq=
2Kf 2aKf 0 0 2hfKf 0 0 0
T
,
M1=
m 0
0 IZ
, M2=
−hfmsf −hrmsr
0 0
,
Setting the state vector as x=v˙ ˙r U˙ V˙ T . Then Eq.
(11) can be rewritten into Eq. (12):
where A=Mq−1×Aq,B=M−1q ×Bq.
2.3 Determination of the Equivalent Wheelbase
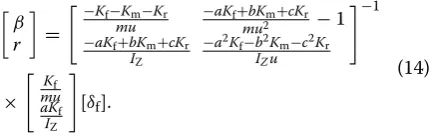
According to Refs. [25, 26], the method to determine the equivalent wheelbase is obtained. First, the linear two-DOF model of the vehicle can be set up based on Eqs. (1) and (2),
A4=
lf 0 0 lr
lf 0 0 lr
, A5= � 1 0 0 1 � . (12) ˙
x=Ax+Bδf,
(13) � ˙ β ˙ r � = �−K
f−Km−Kr
mu
−aKf+bKm+cKr
mu2 −1
−aKf+bKm+cKr)
IZ
−a2K
f−b2Km−c2Kr
IZu
� � β r � + � K f mu aKf IZ � [δf],
where β represents side slip angle of mass center. At steady state, β˙=0 and r˙=0 , so
When only taking the front axle steering into account, the yaw rate gain can be described as follows:
Setting
The yaw rate gain can be simplified.
So, the equivalent wheelbase of the triaxle bus can be obtained according to the equivalence of physical mean-ing as follows:
Then, the equivalent front sprung mass is
and the equivalent rear sprung mass is
Also, the equivalent front and rear unsprung mass can be described as
(14)
β r
=
−Kf−Km−Kr mu
−aKf+bKm+cKr
mu2 −1
−aKf+bKm+cKr IZ
−a2Kf−b2Km−c2Kr IZu
−1
×
Kf mu aKf IZ
[δf].
(15) r
δf =u[KfKm(a+b)−KfKr(a+c)]
{KfKm(a+b)2
+KfKr(a+c)2+KmKr(c−b)2
−mu2(aKf−bKm−cKr)}.
(16)
l=a+c,
t=c−b.
(17) r
δf =u KfKm(l−t) 2+K
fKrl2+KmKrt2
/
[KfKm(l−t)+KfKrl]+u2[−m(aKf−bKm−cKr)]/ [KfKm(l−t)+KfKrl]
.
(18)
le=
KfKm(l−t)2+KfKrl2+KmKrt2
KfKm(l−t)+KfKrl
.
(19) msf=
ms(le−a)
le
(20) msr=
msa
le .
(21)
muf=
mu(le−a)
le ,
mur=
msa
le .
2.4 Parameter Estimation
The torsion stiffness coefficient kb is an important param-eter of the vehicle model, which can be estimated based on steady-state value obtained from the simulation.
According to the above-mentioned roll motions of sprung mass (3), the torsion stiffness coefficient kb can be represented as follows:
In a steady state response of the vehicle motion equa-tion, the roll velocity and the roll acceleration of the sprung mass and unsprung mass are set to be zero. That is
The ϕsf , ϕsr , ϕuf , ay can be obtained from TruckSim. Substituting these into Eq. (22):
To demonstrate the accuracy of the above estimations, the torsion stiffness coefficient kb is calculated according to Eq. (4) in the same method. That is, the torsion stiff-ness coefficient also can be obtained as follows:
From Eq. (24), the torsion stiffness coefficient can be
estimated to 3967329 N·m/rad, which is close to the
value calculated from Eq. (25). The error is less than 2%.
2.5 Validation of Vehicle Model
To verify the vehicle model, the dynamic performances of a three-axle bus rollover are simulated in TruckSim. A “tour bus 3A” model is used. The three-axle bus runs with the initial vehicle speed of 60 km/h, the front wheel steer-ing angle at 6° in J-turn condition. The triaxle bus param-eters are showed in Table 1.
Figure 3 shows the dynamic performances of the triaxle bus rollover. The solid lines are the results simulated by TruckSim model, and the dotted lines are calculated by the theoretical model.
As shown in Figure 3, the simulation and
theoreti-cal results are highly consistent with each other. In (22) kb= {[msfhfay+msfghfϕsf−kf(ϕsf−ϕuf)
−lf(ϕ˙sf− ˙ϕuf)−Ixfϕ¨sf−lb(ϕ˙sf− ˙ϕsr)]}/
(ϕsf−ϕsr).
(23)
˙
ϕsf=0,
˙
ϕuf =0,
˙
ϕsr=0,
¨
ϕsf=0.
(24) kb=
msfhfay+msfghfϕsf−kf(ϕsf−ϕuf)
ϕsf−ϕsr
.
(25) kb= msrhray+msrghrϕsr−kr(ϕsr−ϕur)
Figure 3(a), the peak value of lateral acceleration is 0.4613g simulated by the TruckSim model, and 0.4525g calculated by the theoretical model. Thus, the error of the peak value of lateral acceleration is 1.9%. Also, the steady state value and the reaction time of lateral accel-eration can be compared, with errors of 3.8% and 2.2%, respectively.
Similarly, the error of the peak value, the steady state value and the reaction time of yaw rate can be obtained as 4.8%, 2% and 3.1% in Figure 3(b). The error of the peak value, the steady state value and the reaction time of roll angle of front sprung mass can be obtained as 3.4%, 2.3% and 5.5% in Figure 3(c). In addition, the error of the peak value, the steady state value and the reaction time of roll angle of rear sprung mass can be obtained as 2.7%, 2.9% and 5.7% in Figure 3(d).
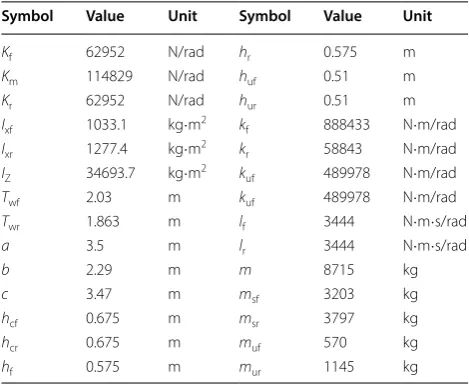
From the above comparison, the error of vehicle dynamic characteristics between the theoretical model and the TruckSim model are less than 6%. As a result, the accuracy Table 1 Parameters of a triaxle bus
Symbol Value Unit Symbol Value Unit
Kf 62952 N/rad hr 0.575 m Km 114829 N/rad huf 0.51 m Kr 62952 N/rad hur 0.51 m Ixf 1033.1 kg·m2 k
f 888433 N·m/rad Ixr 1277.4 kg·m2 k
r 58843 N·m/rad IZ 34693.7 kg·m2 k
uf 489978 N·m/rad Twf 2.03 m kuf 489978 N·m/rad Twr 1.863 m lf 3444 N·m·s/rad a 3.5 m lr 3444 N·m·s/rad
b 2.29 m m 8715 kg
c 3.47 m msf 3203 kg
hcf 0.675 m msr 3797 kg
hcr 0.675 m muf 570 kg
hf 0.575 m mur 1145 kg
a
b
c
d
0 2 4 6 8 10
0 0.1 0.2 0.3 0.4 0.5
Time/(s)
)g(
/n
oit
arel
ecc
al
aret
aL
TruckSim model Theoretical model
0 2 4 6 8 10
0 5 10 15
Time/(s)
)s/
ge
d(/
eta
r
wa
Y
TruckSim model Theoretical model
0 2 4 6 8 10
0 0.2 0.4 0.6 0.8 1 1.2
Time/(s)
)g
ed(
/ss
a
m
gn
ur
ps
tn
orf
fo
el
gn
all
o
R
TruckSim model Theoretical model
0 2 4 6 8 10
0 0.2 0.4 0.6 0.8 1 1.2
Time/(s)
)g
ed(
/ss
a
m
gn
ur
ps
rae
rf
o
el
gn
all
o
R
TruckSim model Theoretical model
of the parameter estimation and the validity of the model has been verified.
3 Rollover Index of the Triaxle Bus
To prevent rollover of the triaxle, a precise and real-time rollover index is very necessary. The existing studies on the vehicle rollover mainly focused on the static stability fac-tor (SSF). This measure of rollover propensity only reflects the most fundamental relation in a static condition and does not take the suspension and tire into account [27]. To detect rollover in the process of vehicle movement, the lateral-load transfer ratio (LTR) was commonly used by researchers [4–7].
The LTR was described as follows:
where, FL and FR are the vertical force of the left and right wheels. When the absolute value of LTR is equal to 1, the car is considered to roll over [28].
3.1 Establishment of Rollover Index
For the triaxle bus, because of its long wheelbase, the ver-tical load of the right and left wheels cannot be directly used to judge the rollover. Therefore, it is important to propose a rollover index for both the front and rear. According to the definition, the rollover index can be expressed as follows:
where RIf is the rollover index of front sprung mass sys-tem and RIr is the rollover index of rear sprung mass system.
Because the vertical forces of the wheels cannot be measured directly, the rollover index needs to be refor-mulated according to the developed vehicle model. The vertical acceleration of the tire is ignored. Then Eq. (28) is obtained:
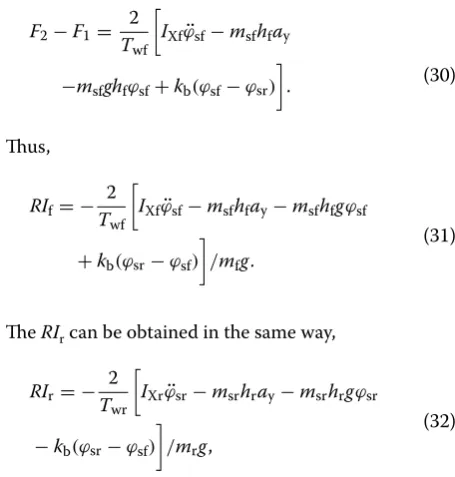
where F1 and F2 are the left and right suspension force. According to moment equilibrium equations, the differ-ence value between F1 and F2 can be obtained.
Combining Eq. (3),
(26) LTR= FL−FR
FL+FR,
(27)
RIf=
FL1−FR1 FL1+FR1
,
RIr= FL2+FL3−(FR2+FR3) FL2+FL3+FR2+FR3
,
(28)
FL1−FR1=F2−F1, FL1+FR1=mfg,
(29) Twf
2 (F2−F1)= −kf(ϕsf−ϕuf)−lf(ϕ˙sf− ˙ϕuf).
Thus,
The RIr can be obtained in the same way,
where Twf and Twr are the front wheel track and the rear wheel track.
RIf and RIr are not identical such that it is necessary to use the larger rollover index to indicate the rollover sta-bility of the vehicle. A new rollover index of the triaxle bus is defined as
Basically, the triaxle bus is stable when the value of RIt is less than 1, and it is likely to rollover when the value of RIt is over than or equal to 1.
3.2 Validation of Rollover Index
To validate the proposed rollover index, the dynamic per-formance of the triaxle bus is simulated in TruckSim. The comparison of the LTR and RIt in two different cases is obtained in this section.
Case I. J-turn condition is used in this case. The front wheel steering angle is 6°. Therefore, the rollover indices of triaxle bus in J-turn can be obtained.
Figure 4(a) and (b) show comparisons of the rollover index of the front and rear sprung mass when the vehicle speed is 60 km/h. The dotted lines are obtained from the fundamental definition of LTR, and the solid lines are the new rollover indices, which are calculated by the above Eqs. (31) and (32). As shown in Figure 4(a), the maxi-mum error between fundamental LTRf and RIf is less than 5%, and the peak value of RIf is a little bigger than LTR. That means RIf can be close to the traditional LTRf. In Figure 4(b), a good fit between the LTRr and RIr can be witnessed. In summary, the proposed rollover indices of front sprung mass and the rear sprung mass are efficient.
(30)
F2−F1=
2
Twf
IXfϕ¨sf−msfhfay
−msfghfϕsf+kb(ϕsf−ϕsr)
.
(31) RIf= −
2 Twf
IXfϕ¨sf−msfhfay−msfhfgϕsf
+kb(ϕsr−ϕsf)
/mfg.
(32)
RIr= − 2
Twr
IXrϕ¨sr−msrhray−msrhrgϕsr
−kb(ϕsr−ϕsf)
/mrg,
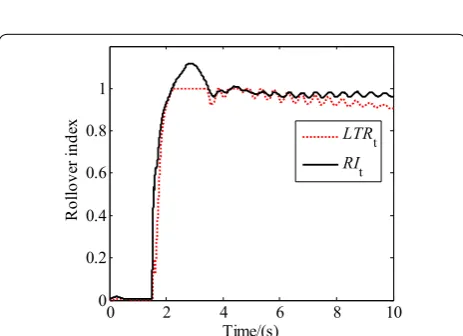
To better validate the effectiveness of RIt, the larger value of LTR of front and rear sprung mass is used to compare with RIt. As shown in Eq. (34):
(34)
LTRt=max(|LTRf|,|LTRr|).
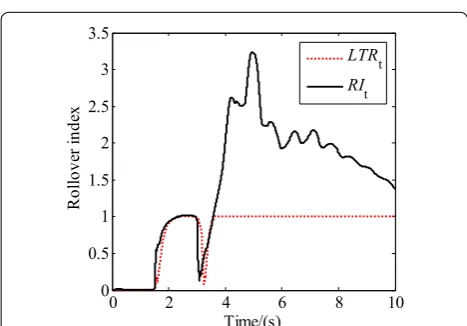
Figure 5 shows the roll stability of the triaxle bus when the vehicle speed is 90 km/h. The absolute value of both LTRt and RIt reach 1 at 2.1 s, and less than 1 a 3.5 s. That is, one side of the wheels lift off the ground from 2.1 s to 3.5 s. This further proves the accuracy of RIt.
Case II. In this case, another standard rollover test condition is implemented, Fishhook, with the amplitude of the front wheel steering angle set to 6°.
As shown in Figure 6, when the vehicle speed is
60 km/h, the theoretical rollover index of front sprung mass system and rear sprung mass make an agreement with the LTRf and the LTRr simulated by TruckSim. It demonstrates the validation of the proposed index in Fishhook condition.
Figure 7 shows the roll dynamics of the triaxle bus in the Fishhook condition when the vehicle operates at 90 km/h. The RIt also agrees with the LTRt simulated by TruckSim. In addition, the value of the new rollover index and the LTRt reach 1 at the same time such that the RIt can also predict rollover risk of the triaxle bus in the Fishhook condition.
4 Roll Stability of the Triaxle Bus 4.1 Roll Stability in Typical Maneuvers
To study the dynamic rollover stability of the triaxle bus, this section presents three typical rollover maneu-vers, which include the J-turn maneuver, the Fishhook maneuver, and the Double-lane-change maneuver. The parameters of the triaxle bus are shown in Table 1.
J-turn maneuver. In this maneuver, the road adhe-sion coefficient is 0.85, and the front wheel steering angle is 6°.
As shown in Figure 8, the solid line, dashed line, and dotted line represent the roll dynamic response of the triaxle bus when the vehicle moves at 60 km/h, 80 km/h and 100 km/h, respectively. When the speed reaches 100 km/h, the value of the rollover index of the vehicle is over 1 at 2.1 s, and the vehicle is at risk of rollover. When the vehicle moves slowly, the value of RIt is also decreased. Therefore, when the steering angle input is a constant, with the higher speed, the vehicle is more likely to rollover.
Fishhook maneuver. This is a severe rollover test condition. The amplitude of the front wheel steering angle is set to 4°, the road adhesion coefficient is 0.85.
In Figure 9, the triaxle bus will not be at risk of rollo-ver at 60 km/h, 80 km/h and 100 km/h in the first phase of the Fishhook condition (before 3.5 s). In the second phase of the Fishhook condition, the bus rolls over at less than four seconds, with a speed of 100 km/h. Like the J-turn condition, the value of RIt decreases with the decrease of vehicle speed. Compared with the results
a
b
0 2 4 6 8 10
0 0.1 0.2 0.3 0.4
Time/(s)
Ro
llove
r in
de
x
LTRf
RIf
0 2 4 6 8 10
0 0.2 0.4 0.6 0.8 1
Time/(s)
Ro
llov
er
in
de
x
LTRr RIr
Figure 4 Comparison of new rollover index of front and rear sprung mass and LTR in J-turn maneuver: (a) Comparison of RIf and LTRf in J-turn; (b) Comparison of RIr and LTRr in J-turn
0 2 4 6 8 10
0 0.2 0.4 0.6 0.8 1
Time/(s)
Ro
llove
r i
nde
x LTR
t RIt
of J-turn condition, the rollover happens easier in the Fishhook condition.
Double lane change (DLC) maneuver. The rollover stability in a DLC condition is also studied. The road
adhesion coefficient is 0.85, and its width is 3.5 m. The movement track of triaxle bus in DLC condition is shown in Figure 10.
In DLC condition, although the value of RIt at
100 km/h is larger than the value of RIt at 80 km/h and 60 km/h, it will not roll over. Therefore, the triaxle bus has good roll stability in the DLC condition. Similar to the J-turn and Fishhook conditions, the value of RIt decreases with the decrease of vehicle speed, that is, reducing the vehicle speed is an effective measure to decrease the risk of the triaxle bus rollover in typical maneuvers.
In conclusion, the fishhook condition is the most dangerous. In the actual driving process, the driver should avoid repeatedly pounding the steering wheel. Furthermore, it is observed that the higher the vehicle speed, the worse the stability.
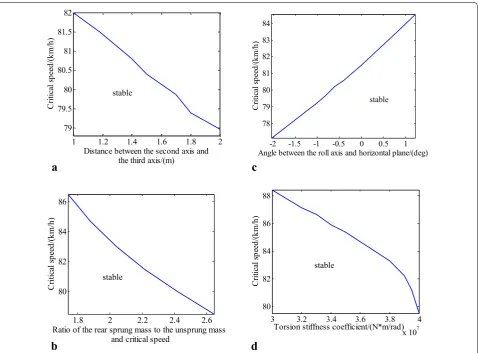
4.2 Factors of Vehicle Structure
To analyze the effect law of some key vehicle struc-ture parameters on the roll stability, Figure 11 presents the stability regions with respect to the vehicle critical speed and a changeable vehicle structure parameter when other vehicle parameters are fixed as constants. The vehicle is asymptotically stable for the vehicle speed u, is less than the rollover critical speed uc, and unstable for u > uc.
As shown in Figure 11(a), the farther the distance
between the second axle and the third axle, the smaller the stability region is. Thus, the shorter distance between them can be used to reduce rollover accidents in the future.
The sprung mass of vehicle will be heavier as the
number of passengers increase. Figure 11(b)
illus-trates the impact of ratio of the rear sprung mass to the unsprung mass on rollover stability. Given 25 passen-gers, 60 kg per person and 7.5 kg of luggage per person in the rear space of triaxle bus, the ratio will increase about 0.9 when the triaxle bus is fully loaded and the critical speed will decrease about 9 km/h. Thus, when designing the triaxle bus, the sprung mass of the empty bus should be small enough to improve the rollover stability.
The roll axle is usually with a certain angle to the ground, the value of this angle also affects the roll
per-formance. Figure 11(c) shows the impact of the angle
between the roll axle and horizontal plane on rollo-ver stability. It can be found that the rollorollo-ver stability improves when the roll axle is low in the rear axle and high in the front axle.
The effects of torsion stiffness should be discussed to reflect the effect of roll coupling of each axle on rollo-ver. As shown in Figure 11(d), larger torsion stiffness
a
b
0 2 4 6 8 10
-0.4 -0.2 0 0.2 0.4
Time/(s)
Ro
llove
r in
de
x
LTRf RIf
0 2 4 6 8 10
-1 -0.5 0 0.5 1
Time/(s)
Ro
llov
er
in
de
x
LTRr RIr
Figure 6 Comparison of new rollover index of front and rear sprung mass and LTR in Fishhook maneuver: (a) Comparison of RIf and LTRf in Fishhook; (b) Comparison of RIr and LTRr in Fishhook
0 2 4 6 8 10
0 0.5 1 1.5 2 2.5 3 3.5
Time/(s)
Ro
llove
r in
de
x
LTRt RIt
can reduce the difference between front rollover system and rear rollover system, thus enhance the rollover sta-bility of triaxle bus.
In addition, this paper also does research on the roll-over index under parameter uncertainties, especially tire parameters. Because equivalent sprung masses and equivalent wheel base is a function of cornering stiffness. These tire parameters can change as verti-cal tire forces vary. The vertiverti-cal tire forces can change dramatically since the scenario dealt with in this paper is related to rollover and the mass of the bus can vary with a wide range depending on the number of passen-gers. So the impact of the cornering stiffness of tires on rollover stability is analyzed in Figure 12.
As shown in Figure 12(a), when the Kf increase, the rollover stability becomes worse. Because larger Kf can increase the yaw moment; To the contrary, the middle and rear wheels are located behind the center of mass. When the corning stiffness increases, the yaw moment decreases, thus the rollover stability is improved, as shown in Figure 12(b) and (c).
4.3 Factors of Vehicle Driving
The study of driving parameters is helpful to make sug-gestions on the driver’s operation. This section will ana-lyze the influence of the driving parameters including the steering angle and road adhesion coefficient on rollover stability.
As shown in Figure 13(a), with the increase of steer-ing angle, the maximum value of RIt is increased linearly, showing the critical value of steering angle is 6.8° when the vehicle speed is 60 km/h. Furthermore, the largest front wheel steering angle only changes 2.4°, but the RIt increases from 0.7 to 1. Therefore, reducing the larg-est front wheel steering angle has an obvious effect on improving the rollover stability.
Figure 13(b) represents the maximum value of RIt at various road adhesion coefficients. It shows that the max-imum value of RIt grows almost linearly from 0.5 to 1.08 as the road adhesion coefficient increases before 0.625. When the road adhesion coefficient is too low, the gen-erated lateral force is not enough to support the steering of the vehicle, resulting in less roll movement. When the road adhesion coefficient changes from 0.625 to 1.2, RIt exhibits a negative correlation with the road adhesion coefficient. Thus, when the road adhesion efficient is near 0.6, the rollover stability is poor.
5 Rollover Stability under External Disturbances The triaxle bus encounters various interferences during driving, such as lateral force interference and vertical interference. Interference factors may lead the triaxle bus to roll over around the tipping point. Therefore, it is very important to understand the influence of interference factors on the rollover stability of the triaxle bus. The
0 2 4 6 8 10
0 0.2 0.4 0.6 0.8 1 1.2 1.4
Time/(s)
RIt
60km/h 80km/h 100km/h
Figure 8 RIt in J-turn maneuver
0 2 4 6 8 10
0 0.5 1 1.5 2
Time/(s)
RIt
60km/h 80km/h 100km/h
Figure 9 RIt in Fishhook maneuver
0 50 100 150 200 0
0.2 0.4 0.6 0.8 1
x distance/(m)
RIt
60km/h 80km/h 100km/h
J-turn maneuver is selected to simulate rollover stability with external disturbance.
5.1 External Vertical Force
When the triaxle bus moves at 80 km/h, a pulse signal of vertical force is applied to a wheel from 2.0 s to 2.2 s. Figure 14(a) shows the maximum values of RIt when the external vertical force is applied to the inside wheel on dif-ferent axles. The amplitude of the external vertical force on the front axle has little influence on vehicle rollover stability. If the vertical force is applied to the wheel of the second axle, the maximum value of RIt increases when the amplitude of the external vertical force increases. When it increases to 2700 N, the triaxle bus has rollover risk. The maximum value of RIt increases when the external verti-cal force on the third axle is less than 2300 N. It shows the external vertical force applied to the inside wheel
will deteriorate the rollover stability, and when the dis-turbance is applied to the inside wheel on the third axle, the vehicle is much easier to rollover risk than when it is applied to the inside wheel on other axles.
Figure 14(b) shows the maximum values of RIt when the vertical force disturbs the outside wheel on differ-ent axles. With the increasing amplitude of the vertical force applied to the wheel on the second axle and the third axle, the RIt increases, meaning the rollover sta-bility becomes worse. It also can be found that the vehi-cle is more likely to roll over when it is applied to the inside wheel on the third axle than when it is applied to the inside wheel on other axles. On the contrary, the larger amplitude of the vertical force applied to the wheel on the front axle, the vehicle will be more sta-ble. Therefore, the vertical force applied to the outside wheel on the front axle can offset the rollover tendency.
a
b
c
d
1 1.2 1.4 1.6 1.8 279 79.5 80 80.5 81 81.5 82
Distance between the second axis and the third axis/(m)
)h/
mk(
/d
ee
ps
lac
itir
C
stable
1.8 2 2.2 2.4 2.6 80
82 84 86
Ratio of the rear sprung mass to the unsprung mass and critical speed
)h/
mk(
/d
ee
ps
lac
itir
C stable
-2 -1.5 -1 -0.5 0 0.5 1 78
79 80 81 82 83 84
Angle between the roll axis and horizontal plane/(deg)
)h/
mk(
/d
ee
ps
lac
itir
C stable
3 3.2 3.4 3.6 3.8 4 x 10⁷ 80
82 84 86 88
Torsion stiffness coefficient/(N*m/rad)
)h/
mk(
/d
ee
ps
lac
itir
C
stable
Figure 15 shows the phase plane trajectory of the tri-axle bus with the 6000 N vertical force on the outside wheel of the third axle. The trajectory shows that the vehicle is stable when the bus is not disturbed but the vehicle will roll over with the disturbance applied to the outside wheel on the third axle. It intuitively reflects
that the vertical force applied to the wheels can affect the rollover stability.
5.2 External Lateral Force
When the triaxle bus moves at 80 km/h, a pulse signal of lateral force is applied to a wheel from 2.0 s to 2.2 s. Fig-ure 16(a) shows the maximum values of RIt when the lat-eral force interference is applied to the inside wheels on different axles. When the front axle is disturbed, the yaw rate of the triaxle bus will increase, causing over-steering and rollover. In Figure 16(a), the maximum value of RIt increases with the amplitude of the lateral force increas-ing. When the amplitude of the lateral force on the wheel of the second axle is less than 1800 N, or the amplitude of the lateral force on the wheel of the third axle is less than 2600 N, the greater the amplitude of the interfer-ence, the smaller the maximum value of RIt. Because the second axle and the third axle are located behind the center of gravity of the triaxle bus, the lateral interference
a
b
c
5.5 6 6.5 7 7.5 x 10⁴ 75
80 85 90
Kf /(N/m)
)h/
mk(
/d
ee
ps
lac
itir
C
stable
1 1.1 1.2 1.3 x 10⁵ 78
79 80 81 82 83 84
Km /(km/h)
)h/
mk(
/d
ee
ps
lac
itir
C
stable
5.5 6 6.5 7 7.5
x 104 79
80 81 82 83 84
Kr /(N/m)
)h/
mk(
/d
ee
ps
lac
itir
C
stable
Figure 12 Impact of the cornering stiffness of tires on rollover stability: (a) Kf; (b) Km; (c) Kr
a
b
4.5 5 5.5 6 6.5 7
0.7 0.75 0.8 0.85 0.9 0.95 1 1.05
Front wheel steering angle/(deg)
fo
eul
av
mu
mi
xa
M
RIt
0.4 0.6 0.8 1 1.2
0.6 0.7 0.8 0.9 1 1.1
Road adhesion coefficient
fo
eul
av
mu
mi
xa
M
RIt
will resist steering and then reduce the yaw rate of the triaxle bus. Thus, the rollover stability improves. If the lateral interference on the wheel of the second axle and
the third axle continues to increase, the torque of lateral interference to the center of sprung mass is large enough to increase the rollover risk of the triaxle bus. Thus, the maximum value of RIt increases. In addition, the distance between the third axle and the center of gravity is further than that between the second axle and the center of grav-ity, therefore, the lateral interference to the third axle is more sensitive.
Contrary to Figure 16(a), when the second axle and
the third axle are disturbed by the lateral force applied to the outside wheel, the yaw rate of the triaxle bus will increase and the triaxle bus has rollover risk. However, the lateral force on the front axle can reduce the over-steering to avoid the occurrence of rollover, as shown in Figure 16(b).
Figure 17 shows the phase plane trajectory of the tri-axle bus subjected to 5000 N of the lateral force interfer-ence. When the triaxle bus is disturbed by the excessive lateral force on the outside wheel on the third axle, the roll angle and roll rate varies greatly.
a
b
0 1000 2000 3000
0.95 1 1.05 1.1 1.15
Vertical force/(N)
fo
eul
av
mu
mi
xa
M
RIt
Wheel on the front axle Wheel on the second axle Wheel on the third axle
0 1000 2000 3000
0.92 0.93 0.94 0.95 0.96
Vertical/(N)
fo
eul
av
mu
mi
xa
M
RIt
Wheel on the front axle Wheel on the second axle Wheel on the third axle
Figure 14 Influence of vertical interference on rollover stability of the triaxle bus: (a) RIt with vertical force interference applied to the inside wheel; (b) RIt with vertical force interference applied to the outside wheel
0 5 10 15
-20 -10 0 10 20 30 40
Roll angle/(deg)
)s/
ge
d(/
etar
llo
R
Without interference Vertical force interference
Figure 15 Diagram of ( ϕ− ˙ϕ ) with vertical force interference
a
b
0 1000 2000 3000 4000
0.91 0.92 0.93 0.94 0.95 0.96 0.97 0.98
Lateral force/(N)
fo
eul
av
mu
mi
xa
M
RIt
Wheel on the front axle Wheel on the second axle Wheel on the third axle
0 1000 2000 3000 4000
0.92 0.94 0.96 0.98 1
Lateral force/(N)
fo
eul
av
mu
mi
xa
M
RIt
Wheel on the front axle Wheel on the second axle Wheel on the third axle
6 Conclusions
(1) Taking the effect of torsion deformation of vehi-cle body into consideration, a new 6-DOF vehivehi-cle model was derived by dividing the triaxle bus into two parts, the second and third axle are equivalent to a virtual rear axle.
(2) The equivalent distance from the center of gravity to the rear virtual axle is derived using the wheel-bases of the second axle and the third axle. Fur-thermore, the torsion stiffness of the vehicle body is estimated.
(3) A new rollover index was proposed to evaluate the rollover risk of the triaxle bus, and evaluated in some numerical cases, the results show that the proposed index has a good ability to detect rollover. (4) The stability analysis showed that the distance
between the second axle and the third axle and the torsion stiffness of vehicle body have great influence on the rollover stability of the triaxle bus, and it is more prone to rollover when the lateral force inter-ference applied to the wheel on the third axle.
Authors’ Contributions
ZJ was in charge of the whole trial; JL and AK wrote the manuscript; YH assisted with sampling and laboratory analyses. All authors read and approved the final manuscript.
Acknowledgements
The authors sincerely thanks to Mr. Chao Wang of Nanjing University of Aeronautics and Astronautics for his critical discussion and reading during manuscript preparation.
Authors’ Information
Zhilin Jin, born in 1978, is currently an associate professor at Department of Vehicle Engineering, Nanjing University of Aeronautics and Astronautics, China. He received his PhD degree from Nanjing University of Aeronautics and Astronau-tics, China, in 2008. His research interests include vehicle system dynamics and control.
Jingxuan Li, born in 1997, is currently a master candidate at Department of Vehicle Engineering, Nanjing University of Aeronautics & Astronautics, China.
Yanjun Huang, born in 1986, is currently an assistant professor at Depart-ment of Mechanical & Mechatronics Engineering, University of Waterloo, Canada.
Amir Khajepour, born in 1962, is currently a professor at Department of Mechanical & Mechatronics Engineering, University of Waterloo, Canada.
Competing Interests
The authors declare no competing financial interests.
Funding
Supported by National Natural Science Foundation of China (Grant No. 51775269).
Author Details
1 Department of Vehicle Engineering, Nanjing University of Aeronautics & Astronautics, Nanjing, Jiangsu Province 210016, China. 2 Department of Mechanical & Mechatronics Engineering, University of Waterloo, Waterloo, ON N2L 3G1, Canada.
Received: 24 April 2019 Revised: 19 June 2019 Accepted: 8 July 2019
References
[1] National Highway Traffic Safety Administration. Traffic safety facts 2014: a compilation of motor vehicle crash data from the fatality analysis reporting system and the general estimates system. US, Department of Transporta-tion, Washington, DC, 2016: 70-77.
[2] H Huang, R Yedavalli, D Guenther. Active roll control for rollover preven-tion of heavy articulated vehicles with multiple-rollover-index minimiza-tion. Vehicle System Dynamics, 2012, 50(3): 471-493.
[3] G Yu, H Li, P Wang, et al. Real-time bus rollover prediction algorithm with road bank angle estimation. Chaos Solitons & Fractals, 2016, 89(2): 270-283.
[4] G Yu. Road bank estimation for bus rollover prediction. Applied Mathemat-ics & Information Sciences, 2013, 7(5): 2027-2034.
[5] Y Zhang, A Khajepour, X Xie. Rollover prevention for sport utility vehicles usi0ng a pulsed active rear-steering strategy. Proceedings of the Institution of Mechanical Engineers Part D: Journal of Automobile Engineering, 2016, 230(9): 1239-1253.
[6] Z Jin, L Zhang, J Zhang, et al. Stability and optimized H∞ control of tripped and untripped vehicle rollover. Vehicle System Dynamics, 2016, 54(10): 1405-1427.
[7] W Bao, S Hu. Vehicle rollover simulation analysis considering road excita-tion. Transactions of the Chinese Society of Agricultural Engineering, 2015, 31(2): 59-65.
[8] Y Pourasad, M Mahmoodi-K, M Oveisi. Design of an optimal active stabilizer mechanism for enhancing vehicle rolling resistance. Journal of Central South University, 2016, 23(5): 1142-1151.
[9] F Yakub, S Lee, Y Mori. Comparative study of MPC and LQC with dis-turbance rejection control for heavy vehicle rollover prevention in an inclement environment. Journal of Mechanical Science & Technology, 2016, 30(8): 3835-3845.
[10] D Tan, H Wang, Q Wang. Study on the rollover characteristic of In-Wheel-Motor-Driven electric vehicles considering road and electromagnetic excitation. Shock and Vibration, 2016, 2016(10): 1-13.
[11] J Na, T Wang, C Wu, et al. A four-node membrane element model with bending modification for one-step algorithm for bus rollover impact. Engineering Computations, 2015, 32(3): 607-620.
[12] C Bojanowski. Comprehensive rollover testing of paratransit buses. Inter-national Journal of Heavy Vehicle Systems, 2013, 20(1): 76-98.
[13] W Liu, H He, F Sun, et al. Integrated chassis control for a three-axle electric bus with distributed driving motors and active rear steering system. Vehicle System Dynamics, 2017, 55(5): 1-25.
[14] F Li, G Li, C Ran, et al. Speed calculation model and simulation of rollover prevention in condition of extreme turn based on lateral force coef-ficient. Transactions of the Chinese Society of Agricultural Engineering, 2016, 32(3): 41-47.
0 2 4 6 8 10
-10 0 10 20 30 40 50
Roll angle/(deg)
)s/
ge
d(/
etar
llo
R
Without interference Lateral force interference
[15] J Rath, M Defoort, K Veluvolu. Rollover index estimation in the presence of sensor faults, unknown inputs, and uncertainties. IEEE Transactions on Intelligent Transportation Systems, 2016, 17(10): 2949-2959.
[16] G Phanomchoeng, R Rajamani. New rollover index for the detection of tripped and untripped rollovers. IEEE Transactions on Industrial Electronics, 2013, 60(10): 4726-4736.
[17] H Li, Y Zhao, H Wang, et al. Design of an improved predictive LTR for rollo-ver warning systems. Journal of the Brazilian Society of Mechanical Sciences & Engineering, 2017, 39(10): 3779-3791.
[18] Z Jin, J Weng, J Zhang, et al. Dynamic stability of a driver-vehicle rollover system with time delay. International Journal of Vibration Engineering & Technology, 2014, 2(1): 59-71.
[19] Y Li, W Sun, J Huang, et al. Effect of vertical and lateral coupling between tyre and road on vehicle rollover. Vehicle System Dynamics, 2013, 51(8): 1216-1241.
[20] D Odenthal, T Bunte, J Ackermann. Nonlinear steering and braking con-trol for vehicle rollover avoidance. Concon-trol Conference, IEEE, 2015: 598-603. [21] H Imine, M Djemaï. Switched control for reducing impact of vertical
forces on road and Heavy-Vehicle rollover avoidance. IEEE Transactions on Vehicular Technology, 2015, 65(6): 4044-4052.
[22] P Gaspar, I Szaszi, J Bokor. Brake control to prevent the rollover of heavy vehicles based on a linear parameter varying model. European Control Conference, IEEE, 2015: 3100-3105.
[23] V T Vu, O Sename, L Dugard, et al. H∞ active anti-roll bar control to pre-vent rollover of heavy vehicles: a robustness analysis. IFAC-Papers Online, 2016, 49(9): 99-104.
[24] D Wollherr, J Mareczek, M Buss, et al. Rollover avoidance for steerable vehicles by invariance control. Control Conference, IEEE, 2015: 3522-3527. [25] Y Zhang, Y Huang, H Wang, et al. A comparative study of equivalent
mod-elling for multi-axle vehicle. Vehicle System Dynamics, 2018, 56(2): 1-18. [26] D Williams. On the equivalent wheelbase of a three-axle vehicle. Vehicle
System Dynamics, 2011, 49(9): 1521-1532.
[27] Z Jin, J Weng, H Hu. Rollover stability of a vehicle during critical driving manoeuvres. Proceedings of the Institution of Mechanical Engineers Part D: Journal of Automobile Engineering, 2007, 221(9): 1041-1049.