(Spine title: A Lab-on-a-CD System for Blood Analyses) (Thesis format: Integrated Article)
by
Tingjie Li
Department of Mechanical and Materials Engineering Faculty of Engineering
A thesis submitted in partial fulfillment of the requirements for the degree of
Doctor of Philosophy
The School of Graduate and Postdoctoral Studies The University of Western Ontario
London, Ontario, Canada
ii
THE UNIVERSITY OF WESTERN ONTARIO School of Graduate and Postdoctoral Studies
CERTIFICATE OF EXAMINATION
Supervisor
______________________________ Dr. Jun Yang
Supervisory Committee
______________________________ Dr. Andy (Xueliang) Sun
______________________________ Dr. Liying Jiang
Examiners
______________________________ Dr. Andy (Xueliang) Sun
______________________________ Dr. Christopher G. Ellis
______________________________ Dr. George K Knopf
______________________________ Dr. Xinyu Liu
The thesis by
Tingjie Li
entitled:
An Automated Lab-on-a-CD System
for Parallel Whole Blood Analyses
is accepted in partial fulfillment of the requirements for the degree of
Doctor of Philosophy
iii
Abstract
Medical diagnostics plays a critical role in human healthcare. Blood analysis is one of the most common clinical diagnostic assays. Biomedical engineers have been developing portable and inexpensive diagnostic tools that enable fast and accurate tests for individuals who have limited resources in places that require such field applications. The emergence of Lab-on-a-CD technology provides a compact centrifugal platform for high throughput blood analysis in point-of-care (POC) diagnostics. The objective of this thesis work is to develop a Lab-on-a-CD system for parallel quantitative detection of blood contents.
Blood separation is a key step in blood analysis. By integrating out-of-plane microvalves into the Lab-on-a-CD system, pure plasma is separated from human whole blood sample for subsequent blood detection. These out-of-plane microvalves show excellent performance in preventing backflow or reverse mixing due to blood cell diffusion. The concentrations of certain blood contents in the separated plasma can be detected using the electrochemical biosensors embedded in the plasma reservoir. To improve sensitivity, a nanoporous structure is created on the surfaces of the biosensors’ electrodes through an alloying/dealloying process. The nanoporous electrode has an electroactive surface area up to 60 times larger than that of a flat gold electrode of the same size. As a result, numerous catalysts and enzymes are stably entrapped in the nanoporous structure, leading to high sensitivity, stability and reproducibility of the biosensor.
iv
The Lab-on-a-CD platform developed in this thesis is low-cost, robust, and simple-to-use. Potentially, it could be used in clinical diagnostics and will especially aid developing countries where resources are limited.
Keywords
v
Co-Authorship Statement
This doctoral thesis has been carefully prepared according to the regulations for an integrated-article format thesis stipulated by the Faculty of Graduate and Postdoctoral Studies at the University of Western Ontario, and has been co-authored as follows:
CHAPTER 3: OUT-OF-PLANE MICROVALVES FOR WHOLE BLOOD SEPARATION ON LAB-ON-A-CD
All the theoretical analyses were conducted by T. Li under the supervision of Dr. J. Yang. Device fabrication and experimental testing were undertaken by T. Li under the supervision of Dr. J. Yang. Drafts of Chapter 3 were prepared by T. Li and reviewed by Dr. J. Yang. A paper co-authored by T. Li, L. Zhang and J. Yang has been published on Journal of Micromechanics and Microengineering.
CHAPTER 4: DESIGN AND OPTIMIZATION OF PRUSSIAN BLUE/CARBON NANOTUBE ELECTRODES FOR BIOSENSING APPLICATIONS
All the theoretical analyses were conducted by T. Li under the supervision of Dr. J. Yang. Material synthesis and experimental testing were undertaken by T. Li under the supervision of Dr. J. Yang. Drafts of Chapter 4 were prepared by T. Li and reviewed by Dr. J. Yang. A paper co-authored by T. Li, J. Yang, Q. Zhang has been submitted to Analytical Letters.
CHAPTER 5: FABRICATION OF NANOPOROUS THIN-FILM WORKING ELECTRODES AND THEIR BIOSENSING APPLICATIONS
vi
paper co-authored by T. Li, F. Jia, Y. Fan, Z. Ding and J. Yang has been submitted to Biosensors and Bioelectronics.
CHAPTER 6: A ROBUST LAB-ON-A-CD SYSTEM FOR HIGH-THROUGHPUT AND AUTOMATED WHOLE BLOOD ANALYSIS
vii
Acknowledgments
After been through four years hard work, I am completing my PhD degree in the summer of 2012. It has been my honor to spend these years in the Department of Mechanical and Materials Engineering at the University of Western Ontario, and its faculty and staff members will always remain dear to me. The best and worst moments of my doctoral journey have been shared with many people.
My deepest gratitude must go to my supervisor, Dr. Jun Yang, for introducing me to this state-of-the-art research area and for his continuous guidance and motivation to me to think outside the box. Besides thesis research, Dr. Yang also taught me how to write research proposals and got me involved an industry/university collaboration project. All of these help me become a qualified Ph.D.
Members of the Lanxess project, including Dr. Leo Lau, Dr. Liying Jiang, Dr. Natalie Suhan, Mr. Lorenzo P. Ferrari, Dr. Gilles Arsenault also deserve my sincerest thanks, their assistance and friendship has meant more to me than I could ever express.
Special thanks to technical support from Surface Science Western, especially Mr. Brad Kobe, Mr. Ross Davidson, Ms. Marry Jane Walzak, and Dr. Heng-yong Nie. I also appreciate the technical support from the staff at the Western Nanofabrication Facility, including Mr. Tim Goldhawk, Dr. Todd Simpson, and Dr. Rick Glew. I would also like to thank the thoughtful discussion and friendly support from my colleagues and friends.
viii
Table of Contents
CERTIFICATE OF EXAMINATION ... ii
Abstract ... iii
Co-Authorship Statement... v
Table of Contents ... viii
List of Tables ... xii
List of Figures ... xiii
Nomenclature ... xx
Chapter 1 ... 1
1 Introduction ... 1
1.1 Background ... 1
1.2 Research Objectives and Outline of this Thesis ... 2
1.3 References ... 4
Chapter 2 ... 5
2 Literature Review ... 5
2.1 Point-of-care Diagnostics ... 5
2.2 Lab-on-a-CD Technology ... 11
2.2.1 Microfluidic Pumps ... 12
2.2.2 Microfluidic Valves ... 18
2.3 Blood Analysis ... 24
2.3.1 Conventional Blood Analysis Methods ... 24
2.3.2 Point-of-care Blood Analysis Systems ... 26
2.4 Summary ... 31
2.5 References ... 32
ix
3 Out-of-plane Microvalves for Whole Blood Separation on Lab-on-a-CD ... 43
3.1 Introduction ... 43
3.2 The Working Mechanisms ... 47
3.3 Experimental Design and Method ... 51
3.3.1 Materials ... 51
3.3.2 Device Fabrication ... 51
3.3.3 Blood Separation Experiments ... 57
3.4 Results and Discussion ... 58
3.4.1 Device Characterization ... 59
3.4.2 Performance of Whole Blood Separation ... 59
3.4.3 Discussion ... 67
3.5 Conclusions ... 69
3.6 References ... 70
Chapter 4 ... 73
4 Design and Optimization of Prussian Blue/Carbon Nanotube Electrodes for Biosensing Applications ... 73
4.1 Introduction ... 73
4.2 Material and methods ... 76
4.2.1 Reagents ... 76
4.2.2 Apparatus ... 76
4.2.3 Configuration of the biosensor... 77
4.3 Results and Discussion ... 80
4.3.1 Morphology and structures of MWCNT/Au... 80
4.3.2 Electrochemical behavior of PB/MWCNT/Au ... 82
x
4.3.5 Interference ... 93
4.3.6 The application of glucose biosensor ... 94
4.4 Summary ... 95
4.5 Conclusions ... 96
4.6 References ... 97
Chapter 5 ... 104
5 Fabrication of Nanoporous Thin-film Working Electrodes and their Biosensing Applications ... 104
5.1 Introduction ... 104
5.2 Experimental Section ... 106
5.2.1 Materials and Equipments... 106
5.2.2 Fabrication of Nanoporous Thin-film Electrodes ... 107
5.2.3 Deposition of Prussian Blue, Enzyme and Nafion ... 107
5.3 Results and Discussion ... 108
5.3.1 Characterization of nanoporous thin-film electrodes ... 108
5.3.2 Calibration of the Biosensor ... 116
5.3.3 Analytical performance ... 119
5.3.4 Discussion ... 120
5.4 Conclusions ... 124
5.5 References ... 125
Chapter 6 ... 128
6 A Robust Lab-on-a-CD System for High-throughput and Automated Whole Blood Analysis ... 128
6.1 Introduction ... 128
6.2 Theory and Design of System ... 130
6.3 Experimental ... 132
xi
6.5 Conclusions ... 146
6.6 References ... 147
Chapter 7 ... 150
7 Thesis Summary and Future Work ... 150
7.1 Summary ... 150
7.2 Thesis Contribution ... 150
7.3 Future Work ... 152
xii
List of Tables
xiii
List of Figures
Figure 2.1:Schematics of conventional POC testing procedures (a) an agglutination diagnostic test. (b) a lateral-flow test such as for malaria antigen detection. (c) Light microscopy using Giemsa stain for the detection of malaria.. ... 8
Figure 2.2: Picture of a cell phone based automated analysis system, which contains an iPod docked on a recharge port and a disposable microfluidic chip sitting on the door.. ... 9
Figure 2.3: Microfabricated paper-based analytical chips and their application in a commercial hand-held glucometer.. ... 9
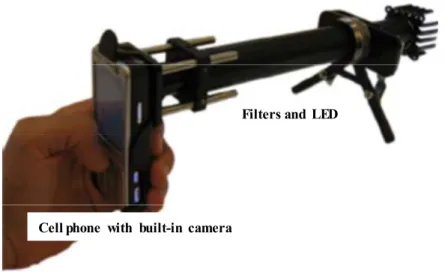
Figure 2.4: Picture of a camera-enabled mobile phone with filters and LED installed for the diagnosis and screening of hematologic and infectious diseases. ... 10
Figure 2.5: Schematics of a Lab-on-a-CD system. ... 12
Figure 2.6: Schematic forces acting on a liquid plug on a rotating platform. ... 15
Figure 2.7: Flow switching in a symmetric, inverse Y-structure. (a) At low frequencies ω, where the Coriolis force is negligible, the flow evenly flows through both outlets. (b) At frequencies beyond ω0, a larger Coriolis force can guide up to 100% of the flow into one outlet according to the direction of rotation.. ... 16
Figure 2.8: Changes of rotation lead to an Euler force (FE) on the bead and the liquid. Advective currents due to the FE can speed up mixing.. ... 17
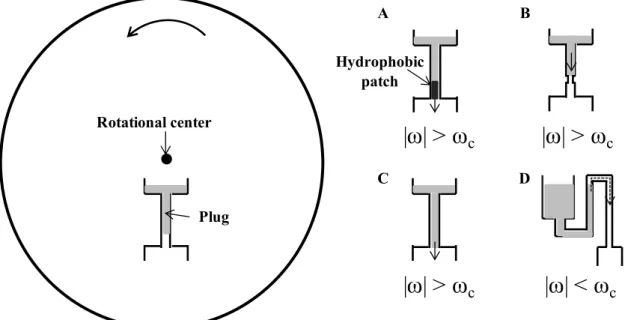
Figure 2.9: Principal centrifugal approach and schematic sketch of the three valving techniques on the centrifugal platform. (A, B) Hydrophobic valves (C) Geometric capillary valve (D) Siphon valve. By adjusting the rotational speed ω, we can control the open or closed status of these microfluidic valves. ... 20
xiv
opened valve, the laser beam is focused at the pre-loaded ferrowax chamber located adjacent to the main channel and the molten ferrowax bursts into the main microchannel, closing the channel. ... 21
Figure 2.11: Schematic of laser melted microvalves. A main channel is separated from a connecting channel by a piece of polymer foil (valve closed). A laser beam is used to melt orifices between the main channel and the connecting channel (valve opened). ... 22
Figure 2.12: A schematic representation of a tape underlayment rotary-node valve and its working principle. ... 23
Figure 2.13: A schematic representation of a polymer-sealed microvalve and its working principle.. ... 23
Figure 2.14: (a) sample taking (b) Sample processing (c) Spectrometer used to conduct optical measurement (Beckman 64, UV/Vis) (d) Blood glucose meter for electrochemical measurement (Yellow Springs Instruments 23A).. ... 26
Figure 2.15: Portable blood analyzer from I-STAT and the exploded view of its cartridge.. 28
Figure 2.16: A compact blood analyzer from Abaxis and the exploded view of its cartridge. ... 29
Figure 2.17: Schematic of blood test on µPAD. A circular filter membrane catches the red blood cells from a drop of blood. The membrane below contains three microfluidic chambers that can measure the liver enzymes alkaline phosphatase (ALP) and aspartate aminotransferase (AST) as well as serum protein. Colors indicate levels of the enzymes and serum protein, and can be digitized by a cell phone or desktop scanner for further analysis..30
Figure 3.1 (a) transverse-flow microfilter devices (b) spun blood cells down towards a bottom stagnation point (c) a T-channel network structure (d) a bended microchannel structure... 44
xv
Figure 3.3: Schematics of the working mechanism of the out-of-plane microvalve on a Lab-on-a-CD platform. The liquid level is horizontal when the platform is motionless (ω = 0). The liquid surface begins to tilt under a rotational speed ω0 which is smaller than the threshold rotational speed. Under these two situations, the microvalve is in “close” state and blocks the passage of fluid. If the rotation speed is increased above the threshold rotational speed ω1, the microvalve is opened and the liquid sample can flow over it. ... 48
Figure 3.4: Schematics of (a) the aligned bilayer photoresist mold for the out-of-plane microvalve and (b) a PDMS replicate fabricated out of the mold. ... 52
Figure 3.5: Detailed microfabrication procedures and dimensions for the Lab-on-a-CD device with an out-of-plane microvalve. (a) Spin the first layer of photoresist, (b) UV exposure with the first photomask, (c) Spin the second layer of photoresist, (d) UV exposure with the second photomask, (e) Develop and cast PDMS, (f) Peel off and bond with a glass wafer. .. 53
Figure 3.6: Graphic illustration of photolithography process for the fabrication of molds. ... 54
Figure 3.7: Graphic illustration of softlithography process for the fabrication of PDMS microfluidic structures. ... 55
Figure 3.8: Characteristics of the Lab-on-a-CD device. (a) The full view of the Lab-on-a-CD system including a motor, a control board and the Lab-on-a-CD device. (b) The sandwich structure of the Lab-on-a-CD device. The top layer is a glass wafer with sample inlets and vents. The PDMS layer comprises 4 sections of identical microstructure including a blood inlet, a supernatant reservoir, a sedimentation reservoir, an out-of-plane microvalve and two air vents. Another smooth glass wafer is used as a support layer. (c) Profiles of the out-of-plane microvalve in the mold and in PDMS casting scanned by a surface profilometer. The profiles of the PDMS casting and the inverted mold are compared. (d) SEM (scanning electron microscope) image taken at the out-of-plane microvalve. A protrusion shown in the microchannel is the out-of-plane microvalve. ... 56
xvi
near the microvalve indicates how the blood cells accumulate at one side. The diffusion of blood cells was restrained by the out-of-plane microvalve. The scale bar is 50 μm. (d) Optical microscope image of a spot in supernatant reservoir showed only few blood cells there. The plasma purity can reach up to 99.9%. The scale bar is 20 μm (e) Optical microscope image of a spot in sedimentation reservoir. Blood cells are tightly stacked together. The scale bar is 50 μm. ... 58
Figure 3.10: Plasma yield vs. rotation speed. The curve indicates the correlation between plasma yield and rotation speed. The centrifugal force is proportional to the square of the rotation speed. The higher the speed, the faster the plasma-blood cells interface moves outward for a certain time period (200 seconds). Therefore the plasma yield goes up as the rotation speed increases. ... 61
Figure 3.11: Plasma yield vs. rotation time. The curve shows the plasma yield under 2000 rpm, with different rotation time. The longer the centrifugal force was exerted on the blood sample, the further outward the plasma-blood cells interface moved. Therefore the plasma yield rises as the rotation time increases. ... 62
Figure 3.12: Rotational speed vs. rotational time for a predetermined plasma yield. For a given rotational speed, each data point of time was collected when the plasma-blood cells interface moved just across the microvalve. The images of the interface, which help us to observe the movement of the plasma-blood cells interface, were captured with the interval of 1 sec without stopping the CD platform. ... 64
Figure 3.13: Blood cells reflowed back to the supernatant reservoir right after the Lab-on-a-CD device without the out-of-plane microvalve stopped. Blood cell aggregates flushed from the sedimentation reservoir, crossed the original valve area, and back to the supernatant reservoir. a) at 10 seconds after the device stopped. b) at 15 seconds after the device stopped. c) at 20 seconds after the device stopped. d) at 25 seconds after the device stopped. The circle tracks movement of the same cell aggregate. ... 66
Figure 4.1: Electrochemical cleaning and activation of electrodes in 0.5 M sulfuric acid by cycling between 0.4 V and 1.6 V at a sweep rate of 40 mV s-1. ... 78
xvii
Figure 4.3: Cyclic voltammograms of Pb activation. ... 79
Figure 4.4: SEM images of (a) PDDA-MWCNT composite and (b) unmodified MWCNT on the surfaces of Au electrodes. ... 81
Figure 4.5: The cyclic voltammograms of PB/MWCNT/Au electrode at different scan rates: 50, 80, 100, 150, 200, 250, and 300 mV/s in PBS (pH 6.8). (b) The dependence of redox peak currents on the square root of scan rates. ... 83
Figure 4.6: (a) The effects of pH on the oxidation peak current of PB/Au and PB/MWCNT/Au electrodes; (b) Cyclic voltammograms for the biosensor in the absent of glucose and in the presence of 5 mM glucose. Scan rate 50 mV/s; (c) The effects of pH on the sensitivity of the biosensor; (d) The effect of working potential on the sensitivity of the biosensor. Data in (b, c, d) are based on the Nafion/GOx-chitosan/PB/MWCNT/Au biosensors. ... 85
Figure 4.7: The current-time response curves (a) and their calibration curves (b) of biosensors fabricated using four kinds of enzyme immobilization methods: a GOx-chitosan without cross-linking; b, c and d GOx-chitosan, GOx-BSA and GOx-BSA-chitosan, cross-linked with glutaraldehyde. PBS (pH 6.8) and working potential (0 V) were applied in the experiments. ... 89
Figure 4.8: The current-time response curves (a) and their calibration curves (b) for the Nafion/GOx-BSA/PB/MWCNT/Au at the amount of GOx of (A)15 U, (B)10 U and (C) 5 U. PBS (pH 6.8) and working potential (0 V) were applied in the experiments. ... 91
Figure 4.9: Current response of Nafion/GOx-BSA/PB/MWCNT/Au to different substances: (a) 1 mM glucose, (b) 0.6 mM ascorbic acid, (c) 0.6 mM uric acid, (d) 0.6 mM lactic acid, (e) 1 mM glucose. PBS (pH 6.8) and working potential (0 V) were applied in the experiments. 94
xviii
Figure 5.2: (a) The EDX spectrum of a nanoporous electrode immersed in 50% HNO3 solution for 120 sec. (b) Cyclic voltammograms recorded in 0.5 M H2SO4 for a flat Au electrode and nanoporous Au electrode show that the cathodic peak of the non-porous Au electrode is only one fortieth of that of the nanoporous Au electrode. ... 111
Figure 5.3: SEM images of uniform and compact PB film deposited on a nanoporous electrode (a) and subjected to twenty cycles in a PBS (c); lumpy and loose PB film deposited on a flat electrode (b) and subjected to twenty cycles of potential scan in a PBS (d) All the scale bars are 1 µm. ... 113
Figure 5.4: (a) Cyclic voltammogram of the PB-modified nanoporous electrodes at a scan rate of 25 mV s-1 in the PBS; (b) The plot of anodic and cathodic currents vs. the square root of the scan rates. The regression equation of the linear fit to anodic response is: y=-0.74+0.26x (R2=0.9984, n=5), and to cathodic response is: y=0.44-0.28x (R2=0.9998, n=5). ... 115
Figure 5.5: (a) Chronoamperograms of glucose with concentration from 0 mM to 40 mM. The working electrode with a diameter of 3 mm was used to record data at 0 V versus Ag/AgCl. (b) Currents of chronoamperometric curves at 100 seconds plotted as a function of the concentration of glucose. Square dots and circular dots represent data from nanoporous biosensors and conventional biosensors, respectively. The regression equation for the linear fit is: y=25.71+3.19x (R2=0.9971, n=5)... 118
Figure 5.6: Amperometric response to successive adding of glucose and interferents. The experiment was conducted in the stirring PBS at 0 V versus Ag/AgCl. Under this condition, the adding of 0.2 mM lactate (LA), 0.3 mM uric acid (UA) and 0.1 mM ascorbic acid (AA) introduced 0.7% and 0.3% increasing, and 1.5% decreasing, respectively. ... 120
Figure 5.7: (a) A nanoporous, thin film and planar electrode system fabricated on a piece of silicon wafer. The diameter of the working electrode is 3 mm. (b) A biosensor embedded in a microfluidic chip. The depth of the microchannel is 50 µm. Control experiments were conducted using this configuration to show the advantages of nanoporous working electrodes in the microfluidic system. ... 122
xix
Figure 6.1: Exploded view of the configuration of one Lab-on-a-CD section. It is comprised of a microfluidic layer, an insulating layer and a biosensing layer. ... 131
Figure 6.2: Photos of components and assembled device. (a) a microfluidic cartridge made of PDMS; (b) An array of electrochemical biosensors built on a Si wafer; (c) assembly of the PDMS chip and the Si wafer. ... 135
Figure 6.3: Schematics of the experimental steps. A blood sample was loaded into the system at 0 rpm. The rotational speed was ramped from 0 rpm up to 2000 rpm in the first 10 sec. The speed was kept at 2000 rpm for 110 sec, and then slowly decreased to 0 rpm. Electrochemical measurements were conducted when the circular platform was stationary. ... 137
Figure 6.4: Whole blood analysis using a Lab-on-a-CD system. (a) sample loading and ready for rotation; (b) Rotation ceased and electrochemical signals measured. ... 138
Figure 6.5:(a) Chronoamperograms of glucose with concentration from 0 mM to 25 mM.(b) Currents at 150 seconds plotted as a function of the concentration of glucose. ... 141
Figure 6.6:(a) Chronoamperograms of lactate with concentration from 0 mM to 1.5 mM.(b) Currents at 150 seconds plotted as a function of the concentration of lactate. ... 142
Figure 6.7:Chronoamperograms of uric acid with concentration from 0 mM to 5 mM.(b) Currents at 150 seconds plotted as a function of the concentration of uric acid. ... 143
xx
Nomenclature
Mathematical Symbols
A cross-sectional area of the out-of-plane valve
CFC cell concentration of the whole blood
CPC cell concentration in the supernatant reservoir
Fc centrifugal force
Fh hydrostatic force
fc capillary force
g gravitational acceleration
H height of the microvalve
Hct, volume fraction of blood cells
L length of the upstream reservoir
b, h width and height of the narrowed microchannel above the microvalve
b,h width and height in the reservoir near the microvalve
VP volume occupied by the pure plasma in supernatant reservoir
VW volume of the loaded whole blood
F
W the work of the centrifugal force
g
W the work of the gravitational force
c
f
W the work of the capillary force
xxi
Greek Symbols
ω rotational speed of the Lab-on-a-CD platform
ρ sample density
σ surface tension
contact angle of sample on the channel wall
P
plasma purity
P
Chapter 1
1 Introduction
The background of this thesis work is briefly introduced in this chapter, followed by the research objectives and outline of this thesis.
1.1 Background
Diagnostics plays a critical role in health care by providing a timely health care for patients and high-risk groups as well. Approximately 740 tests are currently offered by a central clinical laboratory [1]. 700 out of the 740 tests are used as diagnostic tests and most of them are conducted on blood. The market for blood analysis is valued at $50 billion across the globe: $17 billion goes to the manufacturers of in vitro diagnostic equipment and supplies, and $33 billion is used for medical technology/clinical chemistry staff and other associated service costs [2]. Obviously, new technologies are needed to reduce the cost of blood analysis in order to make it accessible for people all over the world.
Lab-on-a-CD [7] technology, a main branch of Lab-on-a-chip [8] technology, turns out to be an ideal miniaturization for chemical/biochemical tests, which is realized by the intrinsic pumping and separation mechanisms based on the centrifugal field on the entire circular disc (CD) platform. The separation mechanism is ideal for blood analysis because blood separation is the first step for whole blood analysis [9]. The accuracy of whole blood analysis may be disturbed by the existence of blood cells. These characteristics of Lab-on-a-CD technology inspire this thesis work in further exploring an automatic, portable, point-of-care, cost-effective and fast system for blood analyses.
1.2 Research Objectives and Outline of this Thesis
It is the aim of this thesis work to explore a portable and low-cost system for one-step blood separation and analysis. To achieve this aim, a microfluidic cartridge for whole blood separation and an innovative electrode system for electrochemical detection in microfluidic channel were designed and studied. A Lab-on-a-CD prototype was built to conduct multiple tests simultaneously.
Chapter 2 presents a review of the status of point-of-care (POC) diagnostics and the major features of the Lab-on-a-CD platform. Meanwhile, comparisons are made between the conventional blood analysis systems and other POC systems, leading to the research objectives of this thesis.
Chapter 4 focuses on design and optimization of prussian blue (PB) and multi-wall carbon nanotubes (MWCNT) based electrodes for electrochemical biosensing of analytes in the separated plasma. The factors that might affect the performance of the biosensor were evaluated. It was found that the immobilization methods and the amount of glucose oxidase (GOx) mainly influenced the sensitivity of the glucose biosensor, while the amount of Nafion affected both the sensitivity and the linear range of the glucose biosensor.
In Chapter 5, a nanoporous structure was created on the surfaces of electrodes through an alloying/dealloying process. The creation of the nanoporous electrode is to compensate the reduced surface area due to the miniaturization of the electrodes in the Lab-on-a-CD system. Meanwhile, the electrode system embedded in the microfluidic system may experience sample flow rates from nl s-1 to liter s-1 in the centrifugal platform. Abundant catalysts and enzymes were stably entrapped in the nanoporous structure, leading to high stability and reproducibility of the biosensor.
Chapter 6 demonstrates the performance of the completed Lab-on-a-CD prototype. The prototype was assembled with a microfluidic cartridge for blood separation and an electrochemical system for quantitative detection. Although only glucose, lactate and uric acid were analyzed, the Lab-on-a-CD prototype is designed as a universal platform to detect the concentration of analytes in whole blood only if hydrogen peroxide is produced in enzymatic reactions.
1.3 References
1. Bailey, T., A practicum on making point-of-care testing work. American Clinical Laboratory, 1997. 16: p. 10-11.
2. MedPro Month, Diagnostic testing, outcomes and POC. Medical Data International, January 1997. Vol. VII: No. 1.
3. Kanji, S., Buffie, J., Hutton, B., Bunting, P., Singh, A., McDonald, K., Fergusson, D., McIntyre, L. and Hebert, P., Reliability of point-of-care testing for glucose measurement in critically ill adults. Critical Care Medicine, 2005. 33(12): p. 2778-2785..
4. Ahn, C.H., Choi, J., Beaucage, G., Nevin, J.H., Lee, J., Puntambekar, A. and Lee, J.Y., Disposable smart lab on a chip for point-of-care clinical diagnostics.
Proceedings of the IEEE, 2004. 92(1): p. 154-173.
5. Tüdős, A.J., Besselink, G.A.J., and Schasfoort, R.B.M., Trends in miniaturized total analysis systems for point-of-care testing in clinical chemistry. Lab on a Chip, 2001. 1(2): p. 83-95.
6. Yager, P., Domingo, G.J. and Gerdes, J., Point-of-care diagnostics for global health. Annual Review of Biomedical Engineering, 2008. 10: p. 107-144.
7. Madou, M., Zoval, J., Jia, G., Kido, H., Kim, J. and Kim, N., Lab on a CD. Annual Review of Biomedical Engineering, 2006. 8: p. 601-628.
8. Chin, C.D., Linder, V. and Sia, S.K., Lab-on-a-chip devices for global health: past studies and future opportunities. Lab on a Chip, 2006. 7 (1): p. 41-57.
Chapter 2
2 Literature Review
In this chapter, the status of point-of-care (POC) diagnostics is reviewed. POC is normally defined as any testing performed near the patient, and its essence is to miniaturize and integrate diagnostic equipment onto a compact platform. The Lab-on-a-CD technique provides such a compact platform, and its major features are introduced here. Since this thesis focuses on how to transfer the blood analysis process from the macro world into the micro/nano world, conventional blood analysis systems are compared with other POC systems.
2.1 Point-of-care Diagnostics
Diagnostics have already made great contributions to health care in the developed world, e.g. ensuring safe blood banking, providing appropriate and timely care to patients and crucial surveillance data for both emergency public health interventions and long-term public health strategies. Evaluating and improving patients’ medical conditions need effective diagnostic tools. For the most part, new diagnostic systems developed by biomedical engineers are in response to the needs of the medical community in only the developed countries due to the new technologies’ necessity for highly regulated and quality-weighed environments of centralized laboratories.
fulfill the needs of developing countries. A major task for the biomedical engineering community is to develop POC tests, which allows the test to be brought conveniently and immediately to the patient, meeting the needs of people from various living environment.
The knowledge of what actual constraints and requirements exist in developing countries is important in developing appropriate POC diagnostics for low resource settings. The laboratories in such environments face not only traditional constraints (e.g. low water quality, insufficient power supply and inconsistent refrigeration quality) [5-7], but also additional challenges, which are listed as follows:
1. Inequality of laboratory facilities and capacities within a country and among countries.
2. Poor external quality control and laboratory management systems. 3. Lack of basic essential equipment and laboratory consumables. 4. Unreliable quality of reagents and unsecured supply chains. 5. Insufficiently skilled staff and limited training opportunities.
These factors result in POC diagnostic tests possessing low complexity, while keeping the same level of diagnostic accuracy. The definition of complexity comprises of the number of manual operation steps, the number of instruments involved, the level of necessary training, and the need for user interpretation. The accuracy of the result is characterized by the detection limit, the clinical sensitivity, and specificity. In addition, practical POC testing should be low cost and have short turn-around time. Generic guidelines developed by the World Health Organization (WHO) for the development of POC devices used in the developing world can give more detailed information [8]:
1. Affordable by those at risk of infection. 2. Sensitive (few false positives).
3. Specific (few false negatives).
6. Equipment-free.
7. Delivered to those who need it.
Apart from clinical needs and user requirements, the political regulation also has a strong impact on the design of POC devices. For example, the US Food and Drug Administration (FDA) defines POC diagnostics as “simple” and as having “insignificant risk of an erroneous result”. The design specifications are as follows:
1. Fully automated instrument or unitized, using direct and unprocessed specimens/capillary blood (finger stick), nasal swabs, or urine. 2. Needs only basic specimen and reagent manipulation.
3. Needs no operator calibration, interpretation and intervention during the analysis steps, no technical or specialized training, no electronic or mechanical
maintenance.
Control reagent Test
reagent
Positive result
Positive result Negative result
Invalid result
Thick SmearSmearThin
Methanol fixed
Thick Smear
Thin Smear Blood from finger stick
(a) (b) (c)
Figure 2.1:Schematics of conventional POC testing procedures (a) An agglutination diagnostic test. (b) A lateral-flow test such as for malaria antigen detection. (c) Light
microscopy using Giemsa stain for the detection of malaria. Figures adapted from Ref [12-14].
reported detection of glucose with an optical method. Breslauer et al [19] developed camera-enabled mobile phones for the diagnosis and screening of hematologic and infectious diseases (Figure 2.4).
Chip insertion door
Power button Battery
indicator
Figure 2.2: Picture of a cell phone based automated analysis system, which contains an iPod docked on a recharge port and a disposable microfluidic chip sitting on the
door. Figure adapted from Ref [15].
Cell phone with built-in camera
Filters and LED
Figure 2.4: Picture of a camera-enabled mobile phone with filters and LED installed for the diagnosis and screening of hematologic and infectious diseases. Figure
adapted from Ref [19].
2.2 Lab-on-a-CD Technology
CD Motor
Detection Module
Figure 2.5: Schematics of a Lab-on-a-CD system.
2.2.1 Microfluidic Pumps
Mechanical pumps [43] are based on well-developed, commercially available components. The generated pressure is a volume-dependent force, which scales as L3 (L, characteristic length corresponding to the capillary diameter), and a diverse range of flow rates is available, from less than nL s-1 to L s-1. Electro-osmotic, electrowetting, and electrohydrodynamic pumps [44-49] possess better performance in small and long channels compared to mechanical pumping because they all scale as surface forces (L2). No moving parts are needed, and the average flow rates for these pumps are from 1 nL s-1 to 1 µL s-1. By oscillating the sound field at the solid/fluid boundary, the acoustic pump produces a constant fluid motion with a flow rate up to 20 µL s-1. The problem for this type of micropump is that heat can be generated in sample fluids due to the dissipation of acoustic energy. The centrifugal pump herein means the rotating circular platform. Its flow rates depend on disc geometry, spinning speed, and fluid properties, ranging from less than 10 nL s-1 to greater than 100 µL s-1. The advantages of centrifugal pumps are revealed with its simple driving mechanism, which reduces the need for an external pumping system, and its relative insensitivity to physicochemical properties, such as pH, ionic strength, or chemical composition, which are important factors for AC and DC electrokinetic means of pumping.
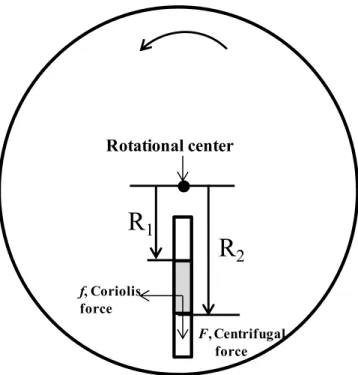
Four types of forces may be produced on a liquid plug on a rotating CD. The first one is centrifugal force that commonly occurred in a rotating and non-inertial reference frame and is defined as an outward force away from the rotational center (Figure 2.6). The centrifugal force occurring at a liquid plug on a rotational platform can be defined as:
A r dr
F
dP 2
(2.2)
where dr is the length of the liquid segment. Integrating this pressure difference along the whole length (R1 to R2) of the liquid plug, we can calculate the pumping pressure acting on this liquid plug, which is given by Equation 2.3:
2 ( )
1 2
1 2 2 2 R R
P
(2.3)
Since the pressure induced by centrifugal force is known, we can infer the flow rate in a rectangular channel. It is assumed that it is a laminar and incompressible flow with a non-slip boundary condition (Poiseuille flow).The volumetric flow rate Q can be
L PWH Q 12 3 (2.4)
Where ∆P is pressure drop and µ is dynamic viscosity. W, H and L are the channel’s width, height, and length respectively. Substituting ∆P in Equation 2.3 to Equation 2.4, the flow rate can be expressed as a function of rotating speed:
L WH R R Q 24 )
( 1 3
2 2 2 2 (2.5)
R
2R
1Rotational center
F, Centrifugal force
f, Coriolis force
Figure 2.6: Schematic forces acting on a liquid plug on a rotating platform.
The movement of the sample in a rotational platform is affected by another factor, called the Coriolis effect, which is the behavior added by the Coriolis acceleration. The Coriolis acceleration is perpendicular both to the direction of the velocity of the moving mass and to the frame's rotation axis, and the magnitude of the Coriolis acceleration is proportional to the velocity of the object. The induced Coriolis force can be expressed as:
F2mV (2.6)
ω
<
ω
0ω
>
ω
0f
ωf
cf
c/f
ω< 1
f
c/f
ω> 1
(a)
(b)
Figure 2.7: Flow switching in a symmetric, inverse Y-structure. (a) At low frequencies ω, where the Coriolis force is negligible, the flow evenly flows through
both outlets. (b) At frequencies beyond ω0, a larger Coriolis force can guide up to
100% of the flow into one outlet according to the direction of rotation. Figure adapted from Ref [53].
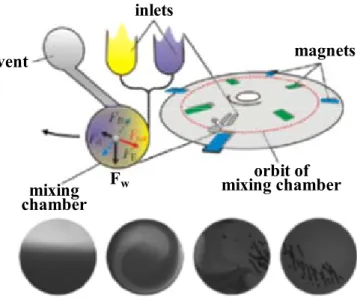
Furthermore, if the angular frequency of a rotating CD varies, a third force, called Euler force, will be generated as a function of the angular acceleration. Based on Newton’s second law of motion, Euler force FE acting on the fluid elements can be derived
from r
dt d
m
vent
inlets
magnets
orbit of mixing chamber mixing
chamber Fw
Figure 2.8: Changes of rotation lead to an Euler force (FE) on the bead and the
liquid. Advective currents due to the FE can speed up mixing. Figure adapted from Ref [54].
Another dominant force acting on microfluidic platforms is capillary force. It is different from the previous forces because it does not rely on the rotation of the CD platform. Capillary force exists in any microfluidic channel, and can be either a driving force or a resisting force, depending on the surface tension of the fluid and the surface energy of the channel surface. Surface tension, caused by the inter-molecular attractive forces of the liquid, is the force that holds a liquid together. Take the interface between water and air, for example. All the water molecules close to the surface are pulled inwards, forming a spherical droplet. This tensile force divided by the length of the contact line on the interface (N/m) is defined as surface tension (
).When liquids are in contact with solids, the formation of droplets or thin films depends on the force balance of surface tension and surface energy.
Affinity of a flat surface towards a certain liquid is defined in terms of the “flat” (or
intrinsic, or Young’s) contact angle,
LA SL SA flat
)
cos( (2.7)
where γrepresents the surface energies (or surface tensions), subscript S stands for solid,
L – for liquid, A - for air The solid-liquid surface energy can be approximately estimated via the other two as follows [55]:
LA SA LA
SA
SL
2 (2.8)
The surface is called (hydro-, oleo-, etc.)-phobic if 90, and -philic if otherwise.
Due to the surface tension, a pressure gradient exists across the interface. Assuming a droplet forms a curve interface in a cylindrical channel (radius: R), the pressure difference across the interface can be deduced from the following force balance:
cos()(2R)(Pi Pj)R2 (2.9) where Piand Pjare pressures on both sides of the interface. As P2cos()/R, the capillary action makes a great contribution to the force balance on a microscale channel.
2.2.2 Microfluidic Valves
a multi-step assay, sample fluid flows through different sites in sequence. For example, the sample needs to remain at specific places for processing and is then released to the next chambers. Based on the differences of actuating mechanisms, microfluidic valves can be divided into passive valves and active valves. Passive valves involve the control of geometries and material properties of channels as well as the rotational speed, while active valves employ external excitation to control the opening or closing of the valves.
Inspired by the siphon effect, a hydrophilic channel, like Figure 2.9 D, can serve as a microfluidic valve, called a siphon valve [58-60]. The siphon valves are inverted U-shaped channels bent at a crest point located radially farther inward with hydrophilic inner surfaces, fluidically connecting two chambers. The outflow chamber has a higher relative energy potential than the inflow chamber within a centrifugal acceleration field. At a high angular frequency ωc, the centrifugal force Fc prevails over the capillary force Fθ in the inbound section, localizing the liquid in the first chamber at a level below the
crest of the siphon. When the angular frequency is reduced or the rotation ceases, liquid spontaneously primes the siphon by capillary action. Maintaining this capillary priming until the advancing meniscus has passed the crest point of the siphon and settles below the position of the receding meniscus in the first chamber. Now a low angular frequency is sufficient to drive the fluid and finally connect these two chambers. Once these two chambers are connected, the movement of fluid will not cease until air is sucked into the inbound channel. These valves depend exclusively on the surface properties of the channels and require precise control of rotation, so their usages are limited.
Rotational center
Plug
Hydrophobic patch
|ω| >
ω
c|ω| >
ω
c|ω| >
ω
c|ω| <
ω
cC
A B
D
Figure 2.9: Principal centrifugal approach and schematic sketch of the three valving techniques on the centrifugal platform. (A, B) Hydrophobic valves (C) Geometric capillary valve (D) Siphon valve. By adjusting the rotational speed ω, we can control
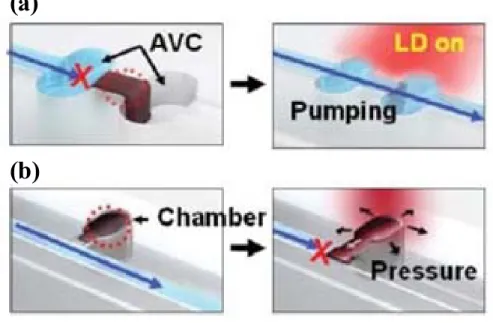
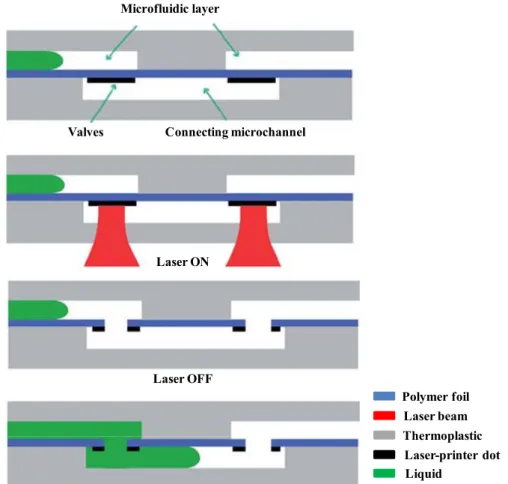
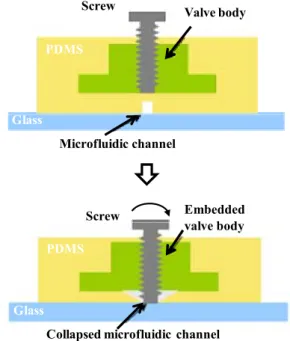
Among many active microvalves used in microfluidic applications, optofluidic valves, opened by directing optical energy from a solid-state laser, are particularly attractive for disposable biochip applications because they are simple to implement, cost-effective and biocompatible. Park et al reported phase change based microvalves using paraffin wax mixed with nanoheaters (Figure 2.10) [61], and Garcia-Cordero et al used a laser to localize heating to melt an orifice in the polymer layer, connecting previously isolated fluidic components or compartments (Figure 2.11) [62]. The disadvantage of this kind of valve is that they are only for single use. Researchers are still trying to develop more robust active microfluidic valves. For example, Markov et al [63] fabricated a tape underlayment rotary-node microvalve (Figure 2.12), and Park et al [64] created a membrane-type microvalve in rectangular microfluidic channels through seal photopolymerization (Figure 2.13).
(a)
(b)
Figure 2.10: Schematic of laser controlled microvalves using paraffin wax. (a) To open the normally closed valve, the laser beam is focused at the valve location and the molten ferrowax flows to the assistant valve chamber, opening the valve. (b) To
close the normally opened valve, the laser beam is focused at the pre-loaded ferrowax chamber located adjacent to the main channel and the molten ferrowax bursts into the main microchannel, closing the channel. Figure adapted from Ref
Polymer foil Laser beam Thermoplastic Laser-printer dot Liquid
Microfluidic layer
Valves Connecting microchannel
Laser ON
Laser OFF
Figure 2.11: Schematic of laser melted microvalves. A main channel is separated from a connecting channel by a piece of polymer foil (valve closed). A laser beam is
Microfluidic channel
Collapsed microfluidic channel Glass
Glass
PDMS PDMS
Screw
Screw
Valve body
Embedded valve body
Figure 2.12: A schematic representation of a tape underlayment rotary-node valve and its working principle.
Gas pressure PDMS microfluidic device
Polymer seal PDMS microfluidic device
Pneumatic channel
Fluidic channel
Flexible membrane
2.3 Blood Analysis
Blood analysis is the most commonly-used diagnostic method nowadays due to the definitive information of patients’ medical conditions provided by blood tests.
2.3.1 Conventional Blood Analysis Methods
Traditional blood analysis includes sample collection, preparation and detection. These three processes are commonly conducted in diverse locations and at different time periods. Blood samples are taken from patients by nurses at hospitals or clinics. Five to ten mL of whole blood is stored in labeled tubes (Figure 2.14 a). These tubes are then collected and sent to central laboratories for further processing by specific laboratory technicians. Plasma is separated from blood cells by centrifuging the tubes, effectively trapping the blood cells in the sediment and lifting the plasma up to the supernatant (Figure 2.14 b). The plasma is extracted for subsequent quantitative detections. These detections can be conducted using colorimetric analysis methods and electrochemical analysis methods. Large scale spectrometers are employed in the colorimetric measurements and standard electrochemical working stations are utilized in the electrochemical detections (Figure 2.14 c, d). This blood analysis regime has been successfully applied to provide accurate results for physicians in the diagnosis of symptomatic patients or in the preventative program.
process, e.g. mislabeled samples or deteriorated samples during transportation, would lead to failure of testing.
People have to pay attention to the method of recognizing the test results, although there is no mistake involved in the process flow. Normally, it takes a few days after taking blood samples from the patient to release the test result to the patient. Unfortunately, the processing time would readily be doubled if the result is doubted and the request to re-measure the blood is made. Considering the issue described above, the patient will feel more confident in the blood result if the procedures for labeling and transporting blood samples are eliminated and the measurement can be performed with a customer-friendly analysis device at the patients’ side.
The completed cost of the blood test comes from the sample acquisition and transportation, analytical equipment, reagents and the associated labor cost. Cost savings can be achieved by switching the multistep laboratory process to a one-step patient-side alternative. For example, blood sampling is performed by pricking the finger into receptacle instead of by a nurse. Sample storage, transportation and processes in the patient-care department and laboratory would be eliminated so long as the patient-side device is designed appropriately.
countries. Moreover, a formal lab environment and experienced professionals are often not accessible in the field. Developing simpler, more robotic and affordable devices becomes necessary.
(a) (b)
(c) (d)
Figure 2.14: (a) Sample taking (b) Sample processing (c) Spectrometer used to conduct optical measurement (Beckman 64, UV/Vis) (d) Blood glucose meter for electrochemical measurement (Yellow Springs Instruments 23A). Figures adapted
from www.labx.com.
2.3.2 Point-of-care Blood Analysis Systems
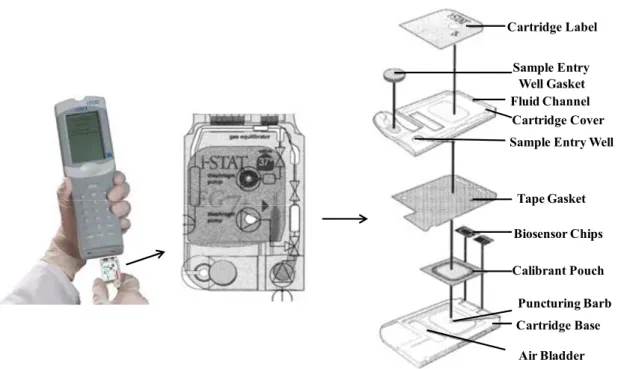
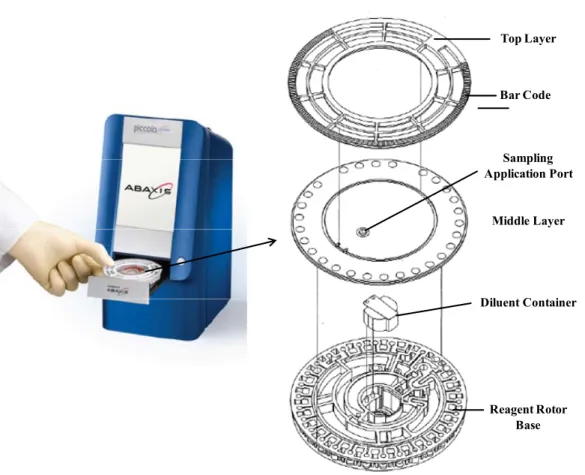
whole blood sample, which is represented by i-STAT from Abbott; and colorimetric measurement on plasma extracted from whole blood, which is demonstrated by Piccolo xpress of Abaxis.
Cartridge Label Sample Entry
Well Gasket Fluid Channel
Cartridge Cover
Calibrant Pouch Tape Gasket Biosensor Chips Sample Entry Well
Puncturing Barb Cartridge Base
Air Bladder
Figure 2.15: Portable blood analyzer from I-STAT and the exploded view of its cartridge. Figure adapted from Ref [65].
Reagent Rotor Base Diluent Container
Middle Layer Sampling Application Port
Bar Code Top Layer
Figure 2.16: A compact blood analyzer from Abaxis and the exploded view of its cartridge. Figure adapted from Ref [66].
Assays
developed
Blood filtered Vertically
through paper
Top side
of device
Bottom side
of device
Blood
sampling
Figure 2.17: Schematic of blood test on µPAD. A circular filter membrane catches the red blood cells from a drop of blood. The membrane below contains three microfluidic chambers that can measure the liver enzymes alkaline phosphatase
(ALP) and aspartate aminotransferase (AST) as well as serum protein. Colors indicate levels of the enzymes and serum protein, and can be digitized by a cell phone or desktop scanner for further analysis. Figure adapted from Ref [67].
2.4 Summary
2.5 References
1. Small, P.M. and Perkins, M.D., More rigour needed in trials of new diagnostic agents for tuberculosis. Lancet, 2000. 356 (9235): p. 1048-1048.
2. Belizario, V., Pasay, C., Bersabe, M., de Leon, W., Guerrero, D. and Bugaoisan, V., Field evaluation of malaria rapid diagnostic tests for the diagnosis of P. falciparum and non-P. falciparum infections. The Southeast Asian Journal of Tropical Medicine and Public Health, 2005. 36 (3): p. 552-561.
3. Lona, C., Alcantarab, S., Luchavezb, J., Tsuyuokac, R. and Belld, D., Positive control wells: a potential answer to remote-area quality assurance of malaria rapid diagnostic tests. Transactions of the Royal Society of Tropical Medicine and Hygiene, 2005. 99 (7): p. 493-498.
4. Barat, L., Chipipa, J., Kolczak, M. and Sukwa, T., Does the availability of blood slide microscopy for malaria at health centers improve the management of persons with fever in Zambia? The American journal of tropical medicine and hygiene, 1999. 60 (6): p. 1024-1030.
5. Bates, I. and Maitland, K., Are laboratory services coming of age in Sub-Saharan Africa? Clinical Infectious Diseases, 2006. 42 (3): p. 383-384.
6. Petti, C.A., Polage, C.R., Quinn, T.C., Ronald, A.R. and Sandel, M.A., Laboratory medicine in Africa: a barrier to effective health care. Clinical Infectious Diseases, 2006. 42 (3): p. 377-382.
7. Ridderhof, J.C., van DeunII, A., KamIII, K.M., NarayananIV, P.R. and AzizV, M.A., Roles of laboratories and laboratory systems in effective tuberculosis programmes. Bulletin of the World Health Organization, 2007. 85 (5): p. 354-359.
9. Duffy, D. C., Gillis, H. L., Lin, J., Sheppard Jr, N. F., and Kellogg, G. J., Microfabricated centrifugal microfluidic systems: Characterization and multiple enzymatic assays. Analytical Chemistry, 1999. 71 (20): p. 4669-4678.
10. Verpoorte, E., Microfluidic chips for clinical and forensic analysis. Electrophoresis, 2002. 23 (5): p. 677-712.
11. Yager, P., Edwards, T., Fu, E., Helton, K., Nelson, K., Tam, M. R., and Weigl, B. H., Microfluidic diagnostic technologies for global public health. Nature, 2006.
442 (7101): p. 412-418.
12. Bührer-Sékula, S., Smits, H., Gussenhoven, G., Van Leeuwen, J., Amador, S., Fujiwara, T., Klatser, P. R. and Oskam, L., Simple and fast lateral flow test for classification of leprosy patients and identification of contacts with high risk of developing leprosy. Journal of Clinical Microbiology, 2003. 41 (5): p. 1991-1995.
13. Cole Jr, J.R., Sulzer, C.R. and Pursell, A.R., Improved microtechnique for the leptospiral microscopic agglutination test. Applied microbiology, 1973. 25 (6): p. 976-980.
14. Payne, D., Use and limitations of light microscopy for diagnosing malaria at the primary health care level. Bulletin of the World Health Organization, 1988. 66 (5): p. 621-626.
15. Stedtfeld, R. D., Tourlousse, D. M., Seyrig, G., Stedtfeld, T. M., Kronlein, M., Price, S., Ahmad, F., Gulari, E., Tiedje, J. M., and Hashsham, S. A., Gene-Z: a device for point of care genetic testing using a smartphone. Lab on a Chip, 2012.
12 (8): p. 1454-1462.
17. Nie, Z., Nijhuis, C. A., Gong, J., Chen, X., Kumachev, A., Martinez, A. W., and Whitesides, G. M., Electrochemical sensing in paper-based microfluidic devices. Lab on a Chip, 2009. 10 (4): p. 477-483.
18. Yang, X., Forouzan, O., Brown, T. P., & Shevkoplyas, S. S., Integrated separation of blood plasma from whole blood for microfluidic paper-based analytical devices. Lab on a Chip, 2011. 12 (2): p. 274-280.
19. Breslauer, D. N., Maamari, R. N., Switz, N. A., Lam, W. A., & Fletcher, D. A., Mobile phone based clinical microscopy for global health applications. PLoS One, 2009. 4 (7): p. e6320.
20. Terray, A., Oakey, J., and Marr, D.W.M., Microfluidic control using colloidal devices. Science, 2002. 296 (5574): p. 1841-1844.
21. Sia, S.K. and Whitesides, G.M., Microfluidic devices fabricated in poly
(dimethylsiloxane) for biological studies. Electrophoresis, 2003. 24 (21): p. 3563-3576.
22. McDonald, J.C. and Whitesides, G.M., Poly (dimethylsiloxane) as a material for fabricating microfluidic devices. Accounts of Chemical Research, 2002. 35 (7): p. 491-499.
23. Wang, C.H. and Lee, G.B., Automatic bio-sampling chips integrated with micro-pumps and micro-valves for disease detection. Biosensors and Bioelectronics, 2005. 21 (3): p. 419-425.
24. Zhang, C., Xing, D. and Li, Y., Micropumps, microvalves, and micromixers within PCR microfluidic chips: Advances and trends. Biotechnology advances, 2007. 25 (5): p. 483-514.
25. Unger, M. A., Chou, H. P., Thorsen, T., Scherer, A., & Quake, S. R., Monolithic microfabricated valves and pumps by multilayer soft lithography. Science, 2000.
26. Yang, Y.N., Hsiung, S.K. and Lee, G.B., A pneumatic micropump incorporated with a normally closed valve capable of generating a high pumping rate and a high back pressure. Microfluidics and Nanofluidics, 2009. 6 (6): p. 823-833.
27. Huang, C.W., Huang, S.B. and Lee, G.B., Pneumatic micropumps with serially connected actuation chambers. Journal of Micromechanics and Microengineering, 2006. 16 (11): p. 2265-2272.
28. Wang, C.H. and Lee, G.B., Pneumatically driven peristaltic micropumps utilizing serpentine-shape channels. Journal of Micromechanics and Microengineering, 2006. 16 (12): p. 341-348.
29. Ahn, C. H., Choi, J. W., Beaucage, G., Nevin, J. H., Lee, J. B., Puntambekar, A., and Lee, J. Y., Disposable Smart lab on a chip for point-of-care clinical
diagnostics. Proceedings of the IEEE, 2004. 92 (1): p. 154-173.
30. Chin, C.D., Linder, V. and Sia, S.K., Lab-on-a-chip devices for global health: Past studies and future opportunities. Lab on a Chip, 2007. 7 (1): p. 41-57.
31. Srinivasan, V., Pamula,V.K. and Fair, R.B., An integrated digital microfluidic lab-on-a-chip for clinical diagnostics on human physiological fluids. Lab on a Chip, 2004. 4 (4): p. 310-315.
32. Srinivasan, V., Pamula, V.K. and Fair, R.B., Droplet-based microfluidic lab-on-a-chip for glucose detection. Analytica chimica acta, 2004. 507 (1): p. 145-150.
33. Toner, M. and Irimia, D., Blood-on-a-chip. Annual Review of Biomedical Engineering, 2005. 7: p. 77-103.
34. Madou, M., Zoval, J., Jia, G., Kido, H., Kim, J., and Kim, N., Lab on a CD. Annual Review of Biomedical Engineering, 2006. 8: p. 601-628.
36. Singer, P.A., et al., Grand challenges in global health: the ethical, social and cultural program. PLoS medicine, 2007. 4 (9): p. e265.
37. Weigl, B.H., Bardell, R.L. and Cabrera, C.R., Lab-on-a-chip for drug development. Advanced Drug Delivery Reviews, 2003. 55 (3): p. 349-377.
38. Haeberle, S., Schmitt, N., Zengerle, R., and Ducrée, J., Centrifugo-magnetic pump for gas-to-liquid sampling. Sensors and Actuators A: Physical, 2007. 135
(1): p. 28-33.
39. Lastochkin, D., Zhou, R., Wang, P., Ben, Y., and Chang, H. C., Electrokinetic micropump and micromixer design based on ac faradaic polarization. Journal of applied physics, 2004. 96 (3): p. 1730-1733.
40. Lemoff, A.V. and Lee, A.P., An AC magnetohydrodynamic micropump. Sensors and actuators B: Chemical, 2000. 63 (3): p. 178-185.
41. Nguyen, N. T., Meng, A. H., Black, J., and White, R. M., Integrated flow sensor for in situ measurement and control of acoustic streaming in flexural plate wave micropumps. Sensors and Actuators A: Physical, 2000. 79 (2): p. 115-121.
42. Tsai, J.H. and Lin, L., Active microfluidic mixer and gas bubble filter driven by thermal bubble micropump. Sensors and Actuators A: Physical, 2002. 97: p. 665-671.
43. Madou, M. J., Lee, L. J., Daunert, S., Lai, S., and Shih, C. H., Design and fabrication of CD-like microfluidic platforms for diagnostics: microfluidic functions. Biomedical Microdevices, 2001. 3 (3): p. 245-254.
44. García-Sánchez, P. and Ramos, A., The effect of electrode height on the performance of travelling-wave electroosmotic micropumps. Microfluidics and Nanofluidics, 2008. 5 (3): p. 307-312.
46. Wong, P. K., Wang, T. H., Deval, J. H., and Ho, C. M., Electrokinetics in micro devices for biotechnology applications. IEEE/ASME Transactions on
Mechatronics, 2004. 9 (2): p. 366-376.
47. Garcia-Sanchez, P., Ramos, A., Green, N., and Morgan, H., Experiments on AC electrokinetic pumping of liquids using arrays of microelectrodes. IEEE
Transactions on Dielectrics and Electrical Insulation, 2006. 13 (3): p. 670-677.
48. Miao, J. Y., Xu, Z. L., Zhang, X. Y., Wang, N., Yang, Z. Y., and Sheng, P., Micropumps based on the enhanced electroosmotic effect of aluminum oxide membranes. Advanced Materials, 2007. 19 (23): p. 4234-4237.
49. Wang, L., L. Flanagan, and Lee, A.P., Side-wall vertical electrodes for lateral field microfluidic applications. Journal of Microelectromechanical Systems, 2007.
16 (2): p. 454-461.
50. Madou, M.J., Fundamentals of microfabrication: the science of miniaturization. 2002: CRC.
51. Ducrée, J., Haeberle, S., Brenner, T., Glatzel, T., and Zengerle, R., Patterning of flow and mixing in rotating radial microchannels. Microfluidics and Nanofluidics, 2006. 2 (2): p. 97-105.
52. Kim, J., Kido, H., Rangel, R. H., and Madou, M. J., Passive flow switching valves on a centrifugal microfluidic platform. Sensors and actuators B: Chemical, 2008.
128 (2): p. 613-621.
53. Brenner, T., Glatzel, T., Zengerle, R., and Ducrée, J., Frequency-dependent
transversal flow control in centrifugal microfluidics. Lab on a Chip, 2005. 5 (2): p. 146-150.
55. Israelachvili, J.N., Intermolecular and surface forces. 2011: Academic press.
56. Andersson, P., Jesson, G., Kylberg, G., Ekstrand, G., and Thorsén, G., Parallel nanoliter microfluidic analysis system. Analytical Chemistry, 2007. 79 (11): p. 4022-4030.
57. Duffy, D.C., Gillis, H. L., Lin, J., Sheppard, N. F., Kellogg, G. J., Microfabricated centrifugal microfluidic systems: characterization and multiple enzymatic assays. Analytical Chemistry, 1999. 71 (20): p. 4669-4678.
58. Steigert, J., Brenner, T., Grumann, M., Riegger, L., Lutz, S., and Zengerle, R., Integrated siphon-based metering and sedimentation of whole blood on a hydrophilic lab-on-a-disk. Biomedical Microdevices, 2007. 9(5): p. 675-679.
59. Haeberle, S. and Zengerle, R., Microfluidic platforms for lab-on-a-chip applications. Lab on a Chip, 2007. 7 (9): p. 1094-1110.
60. Siegrist, J., Gorkin, R., Clime, L., Roy, E., Peytavi, R., Kido, H., Michel Bergeron, M., Veres, T., and Madou, M., Serial siphon valving for centrifugal microfluidic platforms. Microfluidics and Nanofluidics, 2010. 9 (1): p. 55-63.
61. Park, J., Cho, Y., Lee, B., Lee, J., and Ko, C., Multifunctional microvalves control by optical illumination on nanoheaters and its application in centrifugal
microfluidic devices. Lab on a Chip, 2007. 7 (5): p. 557-564.
62. Garcia-Cordero, J. L., Kurzbuch, D., Benito-Lopez, F., Diamond, D., Lee, L. P., and Ricco, A. J., Optically addressable single-use microfluidic valves by laser printer lithography. Lab on a Chip, 2010. 10 (20): p. 2680-2687.
64. Park, W., Han, S. and Kwon, S., Fabrication of membrane-type microvalves in rectangular microfluidic channels via seal photopolymerization. Lab on a Chip, 2010. 10 (20): p. 2814-2817.
65. Erickson, K.A. and Wilding, P., Evaluation of a novel point-of-care system, the i-STAT portable clinical analyzer. Clinical Chemistry, 1993. 39 (2): p. 283-287.
66. Schembri, C., Burd, T., Kopf-Sill, A., Shea, L., and Braynin, B., Centrifugation and capillarity integrated into a multiple analyte whole blood analyser. Journal of Automatic Chemistry, 1995. 17 (3): p. 99-104.
67. Vella, S. J., Beattie, P. D., Cademartiri, R., Laromaine, A., Martinez, A. W., Phillips, S. T., Mirica, K. M., and Whitesides, G. M., Measuring Markers of Liver Function Using a Micro-Patterned Paper Device Designed for Blood from a Fingerstick. Analytical Chemistry, 2012. 84 (6), pp 2883–2891.
68. Allan, Z.C. and Fisher, M.A., Environmental effects on assays in microfluidic paper-based analytical devices. Abstracts of Papers of the American Chemical Society, 2011. 241.
69. Phillips, S.T., Fluidic "Timers" for paper-based microfluidic devices. Abstracts of Papers of the American Chemical Society, 2010. 240.
70. Schilling, K. M., Lepore, A. L., Kurian, J. A., and Martinez, A. W., Fully Enclosed Microfluidic Paper-Based Analytical Devices. Analytical Chemistry, 2012. 84 (3): p. 1579-1585.
71. Yang, X. X., Forouzan, O., Brown, T. P., & Shevkoplyas, S. S., Integrated separation of blood plasma from whole blood for microfluidic paper-based analytical devices. Lab on a Chip, 2012. 12 (2): p. 274-280.
73. Martinez, A.W., Microfluidic paper-based analytical devices: from POCKET to paper-based ELISA. Bioanalysis, 2011. 3 (23): p. 2589-2592.
74. Klasner, S. A., Price, A. K., Hoeman, K. W., Wilson, R. S., Bell, K. J., and Culbertson, C. T., Paper-based microfluidic devices for analysis of clinically relevant analytes present in urine and saliva. Analytical and Bioanalytical Chemistry, 2010. 397 (5): p. 1821-1829.
75. Liu, X. Y., Cheng, C. M., Martinez, A. W., Mirica, K. A., Li, X. J., Phillips, S. T., Mascareñas, M., and Whitesides, G.M., A portable microfluidic paper-based device for ELISA, IEEE 24th International Conference on Micro Electro Mechanical Systems. 2011. p. 75-78.
76. Carvalhal, R.F., Carrilho, E. and Kubota, L.T., The potential and application of microfluidic paper-based separation devices. Bioanalysis, 2010. 2 (10): p. 1663-1665.
77. Ellerbee, A. K., Phillips, S. T., Siegel, A. C., Mirica, K. A., Martinez, A. W., and Striehl, P., Quantifying Colorimetric Assays in Paper-Based Microfluidic Devices by Measuring the Transmission of Light through Paper. Analytical Chemistry, 2009. 81 (20): p. 8447-8452.
78. Phillips, S.T., Strategies for running multiple quantitative assays simultaneously in paper-based microfluidic devices. Abstracts of Papers of the American Chemical Society, 2011. 242.
79. Dungchai, W., Chailapakul, O. and Henry, C.S., Use of multiple colorimetric indicators for paper-based microfluidic devices. Analytica chimica acta, 2010.
674 (2): p. 227-233.
Platelet Reactivity to ADP Detected by a Point-of-Care Assay A 12-Month Follow-Up. Circulation, 2009. 119 (2): p. 237-242.
81. Tefferi, A. and Vardiman, J.W., Classification and diagnosis of
myeloproliferative neoplasms: The 2008 World Health Organization criteria and point-of-care diagnostic algorithms. Leukemia, 2008. 22 (1): p. 14-22.
82. Wang, J., Electrochemical biosensors: Towards point-of-care cancer diagnostics. Biosensors & bioelectronics, 2006. 21 (10): p. 1887-1892.
83. Sibbing, D., Braun, S., Morath, T., Mehilli, J., Vogt, W., and Schomig, A., Platelet Reactivity After Clopidogrel Treatment Assessed With Point-of-Care Analysis and Early Drug-Eluting Stent Thrombosis. Journal of the American College of Cardiology, 2009. 53 (10): p. 849-856.
84. Steinhubl, S. R., Talley, J. D., Braden, G. A., Tcheng, J. E., Casterella, P. J., and Moliterno, D. J., Point-of-care measured platelet inhibition correlates with a reduced risk of an adverse cardiac event after percutaneous coronary intervention - Results of the GOLD (AU-Assessing Ultegra) multicenter study. Circulation, 2001. 103 (21): p. 2572-2578.
85. Sohn, A. H., Garrett, D. O., Sinkowitz-Cochran, R. L., Grobskopf, L. A., Levine, G. L., and Stover, B. H., Prevalence of nosocomial infections in neonatal
intensive care unit patients: Results from the first national point-prevalence survey. Journal of Pediatrics, 2001. 139 (6): p. 821-827.
86. Price, M. J., Endemann, S., Gollapudi, R. R., Valencia, R., Stinis, C. T., and Levisay, J. P., Prognostic significance of post-clopidogrel platelet reactivity assessed by a point-of-care assay on thrombotic events after drug-eluting stent implantation. European Heart Journal, 2008. 29 (8): p. 992-1000.
88. Maisel, A. S., Koon, J., Krishnaswamy, P., Kazenegra, R., Clopton, P., and Gardetto, N.,, Utility of B-natriuretic peptide as a rapid, point-of-care test for screening patients undergoing echocardiography to determine left ventricular dysfunction. American Heart Journal, 2001. 141 (3): p. 367-374.
89. McCoy, D., Kembhavi, G., Patel, J., and Luintel, A., The Bill & Melinda Gates Foundation's grant-making programme for global health. The Lancet, 2009. 373