Advances in Radio Science, 3, 167–174, 2005 SRef-ID: 1684-9973/ars/2005-3-167
© Copernicus GmbH 2005
Advances in
Radio Science
Recent Applications and Advances of Numerical Modeling and
Wavefield Inversion in Nondestructive Testing
R. Marklein1, K. J. Langenberg1, K. Mayer1, J. Miao1, A. Shlivinski1, A. Zimmer1, W. M ¨uller2, V. Schmitz2, C. Kohl3, and U. Mletzko4
1Fachgebiet Theoretische Elektrotechnik, Fachbereich Elektrotechnik / Informatik, Universit¨at Kassel (UNIK),
34109 Kassel, Germany
2Fraunhofer-Institut f¨ur Zerst¨orungsfreie Pr¨ufverfahren (IZFP), Universit¨at des Saarlandes, Geb¨aude 37,
66123 Saarbr¨ucken, Germany
3Bundesanstalt f¨ur Materialforschung und Pr¨ufung (BAM), 12200 Berlin, Germany 4Materialpr¨ufanstalt (MPA) Stuttgart, Universit¨at Stuttgart, 70511 Stuttgart, Germany
Abstract. This paper presents recent advances and future
challenges of the application of different linear and nonlin-ear inversion algorithms in acoustics, electromagnetics, and elastodynamics. The presented material can be understood as an extension of our previous work on this topic. The in-version methods considered in this presentation vary from linear schemes, like the Synthetic Aperture Radar (SAR) applied electromagnetics and the Synthetic Aperture Fo-cussing Technique (SAFT) as its counterpart in ultrasonics, and the linearized Diffraction Tomography (DT), to nonlin-ear schemes, like the Contrast Source Inversion (CSI) com-bined with different regularization approaches. Inversion results of the above mentioned inversion schemes are pre-sented and compared for instance for time-domain ultrasonic data from the Fraunhofer-Institute for Nondestructive Testing (IZFP, Saarbr¨ucken, Germany). Convenient tools for nonde-structive evaluation of solids can be electromagnetic and/or elastodynamic waves; since their governing equations, in-cluding acoustics, exhibit strong structural similarities, the same inversion concepts apply. In particular, the heuristic SAFT algorithm can be and has been utilized for all kinds of waves, once a scalar approximation can be justified. Relating SAFT to inverse scattering in terms of diffraction tomogra-phy, it turns out that linearization is the most stringent inher-ent approximation. A comparison of the inversion results using the linear time-domain inversion scheme SAFT and well tested nonlinear frequency-domain inversion schemes demonstrates the considerable potential to extend and im-prove the ultrasonic imaging technique SAFT while consult-ing the mathematics of wavefield inversion, yet, in particular if the underlying effort is considered, the relatively simple and effective SAFT algorithm works surprisingly well. Since SAFT is a widely accepted imaging tool in ultrasonic NDE it seems worthwhile to check its formal restrictions and
as-Correspondence to: R. Marklein ([email protected])
sumptions whether they could be overcome and whether they would outperform the standard and original SAFT algorithm.
1 Ultrasonic data: linear and nonlinear inversion re-sults
Convenient tools for NDE of solids can be electromagnetic and/or ultrasonic waves; since their governing equations ex-hibit strong structural similarities, the same modeling and inversion concepts apply (Marklein, 2002; Marklein et al., 2001, 2002a,b).
168 R. Marklein et al.: Numerical Modeling and Wavefield Inversion in Nondestructive Testing © Copernicus GmbH 2005
LOGO
Recent Applications and Advances of Numerical Modeling and
Wavefield Inversion in Nondestructive Testing
R. Marklein1, K. J. Langenberg1, K. Mayer1, J. Miao1, A. Shlivinski1, A. Zimmer1, W. M ¨uller2, V. Schmitz2, C. Kohl3, and U. Mletzko4
1Fachgebiet Theoretische Elektrotechnik, Fachbereich Elektrotechnik / Informatik, Universit ¨at Kassel (UNIK), D–34109 Kassel, Germany
2Fraunhofer–Institut f ¨ur Zerst¨orungsfreie Pr¨ufverfahren (IZFP), Universit¨at des Saarlandes, Geb¨aude 37, D–66123 Saarbr¨ucken, Germany
3Bundesanstalt f¨ur Materialforschung und Pr ¨ufung (BAM), D-12200 Berlin, Germany 4Materialpr¨ufanstalt (MPA) Stuttgart, Universit¨at Stuttgart, D-70511 Stuttgart, Germany
Abstract. This paper presents recent advances and future
challenges of the application of different linear and nonlin-ear inversion algorithms in acoustics, electromagnetics, and elastodynamics. The presented material can be understood as an extension of our previous work on this topic. The in-version methods considered in this presentation vary from linear schemes, like the Synthetic Aperture Radar (SAR) ap-plied electromagnetics and the Synthetic Aperture Focussing Technique (SAFT) as its counterpart in ultrasonics, and the linearized Diffraction Tomography (DT), to nonlinear schemes, like the Contrast Source Inversion (CSI) combined with different regularization approaches. Inversion results of the above mentioned inversion schemes are presented and compared for instance for time-domain ultrasonic data from the Fraunhofer–Institute for Nondestructive Testing (IZFP, Saarbr¨ucken, Germany). Convenient tools for nondestruc-tive evaluation of solids can be electromagnetic and/or elas-todynamic waves; since their governing equations, including acoustics, exhibit strong structural similarities, the same in-version concepts apply. In particular, the heuristic SAFT al-gorithm can be and has been utilized for all kinds of waves, once a scalar approximation can be justified. Relating SAFT to inverse scattering in terms of diffraction tomography, it turns out that linearization is the most stringent inherent ap-proximation. A comparison of the inversion results using the linear time-domain inversion scheme SAFT and well tested nonlinear frequency-domain inversion schemes demonstrates the considerable potential to extend and improve the ultra-sonic imaging technique SAFT while consulting the math-ematics of wavefield inversion, yet, in particular if the un-derlying effort is considered, the relatively simple and effec-tive SAFT algorithm works surprisingly well. Since SAFT is a widely accepted imaging tool in ultrasonic NDE it seems worthwhile to check its formal restrictions and assumptions whether they could be overcome and whether they would outperform the standard and original SAFT algorithm.
Correspondence to: R. Marklein ([email protected])
1 Ultrasonic data: linear and nonlinear inversion re-sults
Convenient tools for NDE of solids can be electromagnetic and/or ultrasonic waves; since their governing equations ex-hibit strong structural similarities, the same modeling and inversion concepts apply (Marklein, 2002; Marklein et al., 2001, 2002a,b). In particular, the heuristic synthetic
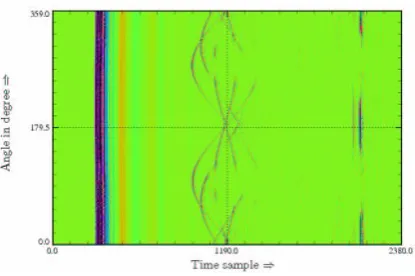
aper-Fig. 1. Measured ultrasonic (elastodynamic) multi–monostatic (multi–pulse–echo) time domain data set for an aluminum cylinder with six air-filled holes.
ture focusing technique (SAFT) algorithm can be — and has been — utilized for all kinds of waves, once a scalar ap-proximation can be justified. Fig. 1 shows a typical multi-monostatic (multi-pulse-echo) ultrasonic data set which is processed by the SAFT algorithm. Relating SAFT to in-verse scattering in terms of diffraction tomography, it turns out that linearization is the most stringent inherent approx-imation. Hence, the results of nonlinear inversion schemes such as Contrast Source Inversion (CSI), where CSI has been applied in remote sensing very successfully (van den Berg et al., 2003; Marklein et al., 2001), are compared to the out-put of SAFT for a carefully designed ultrasonic experiment (Marklein et al., 2002a,b).
Fig. 1. Measured ultrasonic (elastodynamic) multi-monostatic (multi-pulse-echo) time domain data set for an aluminum cylinder with six air-filled holes.
much better than the SAFT results. Figure 5 shows a compar-ison of CSI results for experimental and synthetic data. The synthetic data are obtained with a Domain Integral Equation (DIE) solver in the frequency domain. It can be seen that due to phase errors and noise in the measurements of the CSI the reconstructions of the synthetic data are much better.
2 Ultrasonic data: inhomogeneous anisotropic case
(InASAFT)
Non-destructive testing of defects in nuclear power plant dis-similar pipe weldings play an important role in safety inspec-tions (see Fig. 6). Traditionally the imaging of such defects is performed using the SAFT algorithm, however since parts of the dissimilar welded structure are made of an anisotropic material, this algorithm may fail to produce correct results.
Here we present results of a modified SAFT algorithm that enables a correct imaging of cracks in complex in-homogeneous anisotropic structures by accounting for the true nature of the wave propagation in such structures. The algorithm is called inhomogeneous anisotropic SAFT (InASAFT) (Shlivinski et al., 2004a,b). The InASAFT gorithm is shown to yield better results over the SAFT al-gorithm for complex environments, but the InASAFT suf-fers from the same difficulties of the SAFT algorithm, i.e. “ghost” images and lack of clearly focused images. However these artifacts can be identified through numerical modeling of the wave propagation in the structure, e.g. with the Elas-todynamic Finite Integration Technique (EFIT) (Marklein, 2002). Here we consider a realistic dissimilar weld. Fig-ure 6 (left) shows a polished cut of a weld where its model-ing, based on the design “blue-prints”, can be seen in Fig. 6 (right). Figure 7 (left) shows a synthetic B-scan as a result of the modeling with EFIT (Marklein, 2002), and Fig. 7 (right) displays the InASAFT reconstruction. The crack inside the weld is reconstructed correctly. The experimental B-scan and InASAFT image is given in Fig. 8, where the two focused points in the black ellipse correspond to the crack tips.
3 Electromagnetic data: Ground Penetrating Radar
(GPR) application
Figure 9 shows the geometry of a concrete test specimen as a computer model, which was actually realized by the Federal Highway Research Institute in Germany. The specimen tains two circular cylindrical tubes of infinite electrical con-ductivity with a diameter of 100 mm as an appropriate model for tendon ducts. The reinforcement is perfectly conducting, it exhibits two different mesh sizes of 75 mm and 50 mm. The specimen has the dimensions 2 m×1.5 m×0.7 m, and the concrete material is supposed to be homogeneous and lossless with a relative permittivityεr=2. For the 3-D
simu-lation of electromagnetic wave propagation and scattering, a plane wave impinging perpendicularly to the surface is cho-sen, which has the base band pulse structure shown in Fig. 9 (−3 dB cut-off frequency: '0.9 GHz); the electric field strength is linearly polarized parallel to the tendon ducts. The numerical method to solve Maxwell’s equations is based on the Finite Integration Technique, and here we use a commer-cially available implementation (CST, 2004). Figure 10 ex-hibits 2-D slices out of the 3-D wave field along the line L1 as indicated in Fig. 9, i.e. a line through the coarser reinforce-ment. Typically, even though the highest frequency wave-length is much larger than the grid spacing, the plane pene-trates the reinforcement and leaves it again as a nearly plane wave, nevertheless much weaker in amplitude than before. Hence, the scattering by the tendon ducts is also obvious re-sulting in a 3-D data field when “scanned” along the surface; these data are 2-D with regard to the scan coordinate, and the third dimension is time. Two slices along the lines L1 and L2 of Fig. 9 of the data are displayed in Fig. 11: The slice along L1 through the coarser grid clearly exhibits the hyper-bolic diffraction curves of the tendon ducts, whereas they are not visible along the finer grid. This is confirmed applying a linear diffraction tomographic inverse scattering scheme FT-SAFT (Mayer et al., 1990) to the 3-D data: Fig. 12 clearly shows images of the tendon ducts only below the coarser grid. Thus, simulations of that kind define a limiting grid size for GPR tendon duct imaging, but it turns out that this upper bound cannot yet be met by experiments.
4 Concluding remarks and future work
R. Marklein et al.: Numerical Modeling and Wavefield Inversion in Nondestructive Testing 169
2 R. Marklein et al.: Numerical Modeling and Wavefield Inversion in Nondestructive Testing
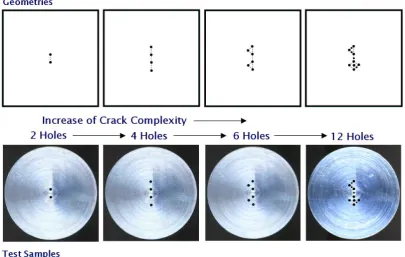
Fig. 2. Stepwise increase of crack complexity: (top) samples geometries of two, four, six and twelve holes; (bottom) aluminum samples.
Fig. 3. Left: SAFT reconstruction of the multi-monostatic (multi-pulse-echo) data set; Right: SAFT reconstruction embedded in the 3-D geometry of the test sample.
Here we restrict ourselves to the scalar case, the extension and application of CSI to the vector case in ultrasonic and electromagnetic NDE is a future challenge. First approaches can be found in (Abubakar, 2000; Pelekanos & Sevroglou, 2003). Fig. 2 shows the geometries and photographs of the four aluminum samples with two, four, six, and twelve air-filled circular cylinders which are in the experiments embed-ded in a water tank. Multi-monostatic (multi-pulse-echo) and multi-bistatic (multi-pitch-catch) ultrasonic data sets (Fig. 1
and Fig. 4a) have been carefully measured. The SAFT re-constructions are given in Fig. 3 and Fig. 4b. Nonlinear CSI inversion results presented in Fig. 4d-f are in general much better than the SAFT results. Fig 5 shows a compari-son of CSI results for experimental and synthetic data. The synthetic data are obtained with a Domain Integral Equation (DIE) solver in the frequency domain. It can be seen that due to phase errors and noise in the measurements of the CSI the reconstructions of the synthetic data are much better.
Fig. 2. Stepwise increase of crack complexity: (top) samples geometries of two, four, six and twelve holes; (bottom) aluminum samples.
2 R. Marklein et al.: Numerical Modeling and Wavefield Inversion in Nondestructive Testing
Fig. 2. Stepwise increase of crack complexity: (top) samples geometries of two, four, six and twelve holes; (bottom) aluminum samples.
Fig. 3. Left: SAFT reconstruction of the multi-monostatic (multi-pulse-echo) data set; Right: SAFT reconstruction embedded in the 3-D geometry of the test sample.
Here we restrict ourselves to the scalar case, the extension and application of CSI to the vector case in ultrasonic and electromagnetic NDE is a future challenge. First approaches can be found in (Abubakar, 2000; Pelekanos & Sevroglou, 2003). Fig. 2 shows the geometries and photographs of the four aluminum samples with two, four, six, and twelve air-filled circular cylinders which are in the experiments embed-ded in a water tank. Multi-monostatic (multi-pulse-echo) and multi-bistatic (multi-pitch-catch) ultrasonic data sets (Fig. 1
and Fig. 4a) have been carefully measured. The SAFT re-constructions are given in Fig. 3 and Fig. 4b. Nonlinear CSI inversion results presented in Fig. 4d-f are in general much better than the SAFT results. Fig 5 shows a compari-son of CSI results for experimental and synthetic data. The synthetic data are obtained with a Domain Integral Equation (DIE) solver in the frequency domain. It can be seen that due to phase errors and noise in the measurements of the CSI the reconstructions of the synthetic data are much better.
Fig. 3. Left: SAFT reconstruction of the multi-monostatic (multi-pulse-echo) data set; Right: SAFT reconstruction embedded in the 3-D
geometry of the test sample.
the InASAFT, is working well and in combination with nu-merical modeling tools, like EFIT, the effects of lineariza-tion, for instance artifacts in the reconstruclineariza-tion, can be in-terpreted. Obviously, like in the ultrasonic case, simulated electromagnetic data imaging using FT-SAFT leads to an in-tuitive physical understanding of GPR probing of embedded structures in concrete. The still existing discrepancy between simulation and experiments will be investigated in greater detail in the future, and transmission data will be included as well. Since SAFT/FT-SAFT are a widely accepted imag-ing tools in ultrasonic NDE it seems worthwhile to check its
formal restrictions and assumptions whether they could be overcome and whether they would outperform the standard and original SAFT/FT-SAFT algorithm.
R. Marklein et al.: Numerical Modeling and Wavefield Inversion in Nondestructive Testing 3 z in mm ⇒ z in mm ⇒ z in mm ⇒ z in mm ⇒ Angle in degree ⇒ z in mm ⇒
Time sample⇒
x in mm⇒
xin mm⇒
xin mm⇒
x in mm⇒ xin mm⇒
0.0 585.0 1170.0 15.0
181.0 347.0
-12.5 -7.5 -2.5 2.5 7.5 12.5 -12.5 -7.5 -2.5 2.5 7.5 12.5
-12.5 -7.5 -2.5 2.5 7.5 12.5 -12.5 -7.5 -2.5 2.5 7.5 12.5
-12.5 -7.5 -2.5 2.5 7.5 12.5 -12.5 -7.5 -2.5 2.5 7.5 12.5
-12.5 -7.5 -2.5 2.5 7.5 12.5 12.5 12.5 12.5 12.5 12.5 12.5
-12.5 -7.5 -2.5 2.5 7.5 12.5 -12.5 -7.5 -2.5 2.5 7.5 12.5 -1.0 1.0 0.0 1.0 0.0 0.3 0.0 0.3 0.0 0.3 ... . . . . . . . . . . . . . . . . . . . . ... ... . . . . . . . . . . . . . . . . . . . . . ... ... . . . . . . . . . . . . . . . . . . . . ... ... . . . . . . . . . . . . . . . . . . . . ... ... . . . . . . . . . . . . . . . . . . . . . ... ... . . . . . . . . . . . . . . . . . . . . ...
(a)
(b)
(c)
(d)
(e)
(f )
Fig. 4. a) Measured ultrasonic multi-bistatic (multi-pitch-catch) time-domain data set for the transmitter at 0◦; b) Time-domain SAFT
reconstruction; c) Actual profile; d) Frequency-domain CSI reconstruction using data at six different frequencies, no a priori information used; e) Frequency-domain CSI reconstruction using single frequency data and a priori information, the contrast is imaginary valued; f) Frequency-domain CSI reconstruction using data at four different frequencies and a priori information, the contrast is imaginary valued.
2 Ultrasonic data: inhomogeneous anisotropic case (InASAFT)
Non-destructive testing of defects in nuclear power plant dis-similar pipe weldings play an important role in safety inspec-tions (see Fig. 6). Traditionally the imaging of such defects is performed using the SAFT algorithm, however since parts
of the dissimilar welded structure are made of an anisotropic material, this algorithm may fail to produce correct results.
Here we present results of a modified SAFT algorithm that enables a correct imaging of cracks in complex in-homogeneous anisotropic structures by accounting for the true nature of the wave propagation in such structures. Fig. 4. (a) Measured ultrasonic multi-bistatic (multi-pitch-catch) time-domain data set for the transmitter at 0◦; (b) Time-domain SAFT reconstruction; (c) Actual profile; (d) Frequency-domain CSI reconstruction using data at six different frequencies, no a priori information used; (e) Frequency-domain CSI reconstruction using single frequency data and a priori information, the contrast is imaginary valued;
R. Marklein et al.: Numerical Modeling and Wavefield Inversion in Nondestructive Testing 171
4 R. Marklein et al.: Numerical Modeling and Wavefield Inversion in Nondestructive Testing
Fig. 5. Top: CSI reconstructions of experimental data and synthetic data; Bottom: CSI reconstructions of synthetic data which are obtained by an Domain Integral Equation (DIE) solver in the frequency domain.
The algorithm is called inhomogeneous anisotropic SAFT (InASAFT) (Shlivinski et al., 2004a,b). The InASAFT gorithm is shown to yield better results over the SAFT al-gorithm for complex environments, but the InASAFT suf-fers from the same difficulties of the SAFT algorithm, i.e. ”ghost” images and lack of clearly focused images. However these artifacts can be identified through numerical modeling of the wave propagation in the structure, e.g. with the Elas-todynamic Finite Integration Technique (EFIT) (Marklein, 2002). Here we consider a realistic dissimilar weld. Fig. 6 (left) shows a polished cut of a weld where its modeling, based on the design ”blue-prints”, can be seen in Fig. 6 (right). Fig. 7 (left) shows a synthetic B-scan as a result of the modeling with EFIT (Marklein, 2002), and Fig. 7 (right) displays the InASAFT reconstruction. The crack inside the weld is reconstructed correctly. The experimental B-scan and InASAFT image is given in Fig. 8, where the two focused points in the black ellipse correspond to the crack tips.
3 Electromagnetic data: Ground Penetrating Radar (GPR) application
Fig. 9 shows the geometry of a concrete test specimen as a computer model, which was actually realized by the Federal Highway Research Institute in Germany. The specimen tains two circular cylindrical tubes of infinite electrical con-ductivity with a diameter of 100 mm as an appropriate model for tendon ducts. The reinforcement is perfectly conducting, it exhibits two different mesh sizes of75mm and50mm.
The specimen has the dimensions2m×1.5m×0.7m,
and the concrete material is supposed to be homogeneous and lossless with a relative permittivityε
r= 2. For the 3–D simulation of electromagnetic wave propagation and scatter-ing, a plane wave impinging perpendicularly to the surface is chosen, which has the base band pulse structure shown in Fig. 9 (−3dB cut–off frequency:'0.9GHz); the
elec-tric field strength is linearly polarized parallel to the tendon ducts. The numerical method to solve Maxwell’s equations is based on the Finite Integration Technique, and here we use a commercially available implementation (CST, 2004). Fig. 10 exhibits 2–D slices out of the 3–D wave field along the line L1 as indicated in Fig. 9, i.e. a line through the coarser reinforcement. Typically, even though the highest frequency wavelength is much larger than the grid spacing, the plane penetrates the reinforcement and leaves it again as a nearly plane wave, nevertheless much weaker in amplitude than before. Hence, the scattering by the tendon ducts is also obvious resulting in a 3–D data field when ”scanned” along the surface; these data are 2–D with regard to the scan co-ordinate, and the third dimension is time. Two slices along the lines L1 and L2 of Fig. 9 of the data are displayed in Fig. 11: The slice along L1 through the coarser grid clearly exhibits the hyperbolic diffraction curves of the tendon ducts, whereas they are not visible along the finer grid. This is con-firmed applying a linear diffraction tomographic inverse scat-tering scheme FT-SAFT (Mayer et al., 1990) to the 3–D data: Fig. 12 clearly shows images of the tendon ducts only below the coarser grid. Thus, simulations of that kind define a lim-iting grid size for GPR tendon duct imaging, but it turns out
Fig. 5. Top: CSI reconstructions of experimental data and synthetic data; Bottom: CSI reconstructions of synthetic data which are obtained
by an Domain Integral Equation (DIE) solver in the frequency domain.
R. Marklein et al.: Numerical Modeling and Wavefield Inversion in Nondestructive Testing 5
Fig. 6. Left: Polished cut of the dissimilar weld. Note the grain orientation in each of the weld parts; Right: ”Blue-print” modeling.
Fig. 7. Left: Synthetic B-scan as a result of the EFIT modeling; Right: InASAFT reconstruction.
that this upper bound cannot yet be met by experiments.
4 Concluding remarks and future work
We have presented latest results of the numerical modeling and linear and nonlinear inversion of electromagnetic and ultrasonic synthetic as well as experimental data. A com-parison of the ultrasonic inversion results using the linear time-domain inversion scheme SAFT and well tested non-linear frequency-domain inversion schemes demonstrates the considerable potential to extend and improve the ultrasonic imaging technique SAFT while consulting the mathematics of wavefield inversion, yet, in particular if the underlying ef-fort is considered, the relatively simple and effective SAFT algorithm works surprisingly well. Even the extension of SAFT to the inhomogeneous anisotropic case, which yields the InASAFT, is working well and in combination with nu-merical modeling tools, like EFIT, the effects of
lineariza-tion, for instance artifacts in the reconstruclineariza-tion, can be in-terpreted. Obviously, like in the ultrasonic case, simulated electromagnetic data imaging using FT-SAFT leads to an in-tuitive physical understanding of GPR probing of embedded structures in concrete. The still existing discrepancy between simulation and experiments will be investigated in greater detail in the future, and transmission data will be included as well. Since SAFT/FT-SAFT are a widely accepted imag-ing tools in ultrasonic NDE it seems worthwhile to check its formal restrictions and assumptions whether they could be overcome and whether they would outperform the standard and original SAFT/FT-SAFT algorithm.
Final conclusions: Not very much remains to be done re-garding the theoretical formulation of linear wavefield in-version, yet improvements with nonlinear inversion can cer-tainly be made. Ockham’s razor is simple: Will it work in practice? Presently, we are working on the development and implementation of the vector case in electromagnetics and ultrasonics as proposed by Abubakar (2000) and Pelekanos
Fig. 6. Left: Polished cut of the dissimilar weld. Note the grain orientation in each of the weld parts; Right: “Blue-print” modeling.
R. Marklein et al.: Numerical Modeling and Wavefield Inversion in Nondestructive Testing 5
Fig. 6. Left: Polished cut of the dissimilar weld. Note the grain orientation in each of the weld parts; Right: ”Blue-print” modeling.
Fig. 7. Left: Synthetic B-scan as a result of the EFIT modeling; Right: InASAFT reconstruction.
that this upper bound cannot yet be met by experiments.
4 Concluding remarks and future work
We have presented latest results of the numerical modeling and linear and nonlinear inversion of electromagnetic and ultrasonic synthetic as well as experimental data. A com-parison of the ultrasonic inversion results using the linear time-domain inversion scheme SAFT and well tested non-linear frequency-domain inversion schemes demonstrates the considerable potential to extend and improve the ultrasonic imaging technique SAFT while consulting the mathematics of wavefield inversion, yet, in particular if the underlying ef-fort is considered, the relatively simple and effective SAFT algorithm works surprisingly well. Even the extension of SAFT to the inhomogeneous anisotropic case, which yields the InASAFT, is working well and in combination with nu-merical modeling tools, like EFIT, the effects of
lineariza-tion, for instance artifacts in the reconstruclineariza-tion, can be in-terpreted. Obviously, like in the ultrasonic case, simulated electromagnetic data imaging using FT-SAFT leads to an in-tuitive physical understanding of GPR probing of embedded structures in concrete. The still existing discrepancy between simulation and experiments will be investigated in greater detail in the future, and transmission data will be included as well. Since SAFT/FT-SAFT are a widely accepted imag-ing tools in ultrasonic NDE it seems worthwhile to check its formal restrictions and assumptions whether they could be overcome and whether they would outperform the standard and original SAFT/FT-SAFT algorithm.
Final conclusions: Not very much remains to be done re-garding the theoretical formulation of linear wavefield in-version, yet improvements with nonlinear inversion can cer-tainly be made. Ockham’s razor is simple: Will it work in practice? Presently, we are working on the development and implementation of the vector case in electromagnetics and ultrasonics as proposed by Abubakar (2000) and Pelekanos
6 R. Marklein et al.: Numerical Modeling and Wavefield Inversion in Nondestructive Testing
Fig. 8. Left: Experimental B-scan; Right: InASAFT reconstruction.
Fig. 9. Left: Geometry of a concrete test specimen as a computer model; Right: Excitation signal.
& Sevroglou (2003).
References
Abubakar, A.: Three-Dimensional Nonlinear Inversion of Electrical Conductivity, Delft University Press, Delft, 2000.
CST MICROWAVE STUDIO, http://www.cst.de.
Marklein, R.: The Finite Integration Technique as a General Tool to Compute Acoustic, Electromagnetic, Elastodynamic, and Cou-pled Wave Fields, in Review of Radio Science: 1999-2002 URSI, edited by W. R. Stone, IEEE Press, Piscataway, 201-244, 2002. Marklein, R., Balasubramanian, K., Qing, A., and Langenberg,
K. J.: Linear and nonlinear iterative scalar inversion of multi-frequency multi-bistatic experimental electromagnetic scattering data, Inverse Problems, 17, 1597–1610, 2001.
Marklein, R., Balasubramanian, K., Langenberg, K. J., Miao, J., and Sinaga, S. M.: Applied Linear and Nonlinear Scalar Inverse Scattering: A Comparative Study, Proceedings of the XXVIIth
General Assembly of the International Union of Radio Science (URSI), CD-ROM, 2002.
Marklein, R., Mayer, K., Hannemann, R., Krylow, T., Balasubra-manian, K., Langenberg, K. J., and Schmitz, V.: Linear and non-linear inversion algorithms applied in nondestructive evaluation, Inverse Problems, 18, 1733-1759, 2002.
Mayer, K., Marklein, R., Langenberg, K. J., and Kreutter, T.: Three-dimensional imaging system based on Fourier transform synthetic aperture focusing technique, Ultrasonics, 28, 241-255, 1990.
Pelekanos, G. and Sevroglou, V.: Journal of Computational and Ap-plied Mathematics, 151, 129-140, 2003.
Shlivinski, A., Langenberg, K. J., and Marklein, R.: Ultrasonic Modelling and Imaging in Dissimilar Welds, Proceedings of the 30th MPA-Seminar in Conjunction with the 9th German-Japanese Seminar, Stuttgart, 2004.
Shlivinski, A., Langenberg, K. J., Marklein, R., Schmitz, V., M ¨uller, W., and Mletzko, U.; Modelling of Elastic Wave Propagation and
Fig. 8. Left: Experimental B-scan; Right: InASAFT reconstruction.
6 R. Marklein et al.: Numerical Modeling and Wavefield Inversion in Nondestructive Testing
Fig. 8. Left: Experimental B-scan; Right: InASAFT reconstruction.
Fig. 9. Left: Geometry of a concrete test specimen as a computer model; Right: Excitation signal.
& Sevroglou (2003).
References
Abubakar, A.: Three-Dimensional Nonlinear Inversion of Electrical Conductivity, Delft University Press, Delft, 2000.
CST MICROWAVE STUDIO, http://www.cst.de.
Marklein, R.: The Finite Integration Technique as a General Tool to Compute Acoustic, Electromagnetic, Elastodynamic, and Cou-pled Wave Fields, in Review of Radio Science: 1999-2002 URSI, edited by W. R. Stone, IEEE Press, Piscataway, 201-244, 2002. Marklein, R., Balasubramanian, K., Qing, A., and Langenberg,
K. J.: Linear and nonlinear iterative scalar inversion of multi-frequency multi-bistatic experimental electromagnetic scattering data, Inverse Problems, 17, 1597–1610, 2001.
Marklein, R., Balasubramanian, K., Langenberg, K. J., Miao, J., and Sinaga, S. M.: Applied Linear and Nonlinear Scalar Inverse Scattering: A Comparative Study, Proceedings of the XXVIIth
General Assembly of the International Union of Radio Science (URSI), CD-ROM, 2002.
Marklein, R., Mayer, K., Hannemann, R., Krylow, T., Balasubra-manian, K., Langenberg, K. J., and Schmitz, V.: Linear and non-linear inversion algorithms applied in nondestructive evaluation, Inverse Problems, 18, 1733-1759, 2002.
Mayer, K., Marklein, R., Langenberg, K. J., and Kreutter, T.: Three-dimensional imaging system based on Fourier transform synthetic aperture focusing technique, Ultrasonics, 28, 241-255, 1990.
Pelekanos, G. and Sevroglou, V.: Journal of Computational and Ap-plied Mathematics, 151, 129-140, 2003.
Shlivinski, A., Langenberg, K. J., and Marklein, R.: Ultrasonic Modelling and Imaging in Dissimilar Welds, Proceedings of the 30th MPA-Seminar in Conjunction with the 9th German-Japanese Seminar, Stuttgart, 2004.
Shlivinski, A., Langenberg, K. J., Marklein, R., Schmitz, V., M ¨uller, W., and Mletzko, U.; Modelling of Elastic Wave Propagation and Fig. 9. Left: Geometry of a concrete test specimen as a computer model; Right: Excitation signal.
R. Marklein et al.: Numerical Modeling and Wavefield Inversion in Nondestructive Testing 7
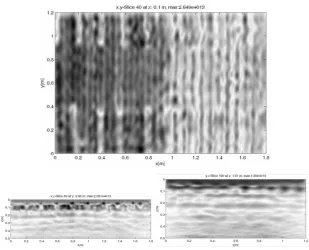
Fig. 10. 2-D slices out of the 3-D wave field along the lines L1 and L2 in Fig. 9a.
Fig. 11. Received signals along lines L1 (left) and L2 (right) of Fig. 9 (left) (logarithmic scale:−60dB).
Imaging of Defects in Dissimilar Welds, Proceedings of the 4th International Conference on NDE in Relation to Structural In-tegrity for Nuclear and Pressurised Components, London, 2004. van den Berg, P. M., Abubakar, A., and Fokkema, J. T.: Extended
Contrast Source Inversion, Radio Science 38, VIC-1–VIC-10, 2003.
R. Marklein et al.: Numerical Modeling and Wavefield Inversion in Nondestructive Testing 173
R. Marklein et al.: Numerical Modeling and Wavefield Inversion in Nondestructive Testing 7
Fig. 10. 2-D slices out of the 3-D wave field along the lines L1 and L2 in Fig. 9a.
Fig. 11. Received signals along lines L1 (left) and L2 (right) of Fig. 9 (left) (logarithmic scale:−60dB).
Imaging of Defects in Dissimilar Welds, Proceedings of the 4th International Conference on NDE in Relation to Structural In-tegrity for Nuclear and Pressurised Components, London, 2004. van den Berg, P. M., Abubakar, A., and Fokkema, J. T.: Extended Contrast Source Inversion, Radio Science 38, VIC-1–VIC-10, 2003.
Fig. 11. Received signals along lines L1 (left) and L2 (right) of Fig. 9 (left) (logarithmic scale:−60 dB).
8 R. Marklein et al.: Numerical Modeling and Wavefield Inversion in Nondestructive Testing
Fig. 12. Linear diffraction tomographic inverse scattering scheme to the 3-D data.
Fig. 13. Three orthogonal slices through the 3-D FT-SAFT image volume of experimental data. Fig. 12. Linear diffraction tomographic inverse scattering scheme to the 3-D data.
8 R. Marklein et al.: Numerical Modeling and Wavefield Inversion in Nondestructive Testing
Fig. 12. Linear diffraction tomographic inverse scattering scheme to the 3-D data.
Fig. 13. Three orthogonal slices through the 3-D FT-SAFT image volume of experimental data.
References
Abubakar, A.: Three-Dimensional Nonlinear Inversion of Electrical Conductivity, Delft University Press, Delft, 2000.
CST MICROWAVE STUDIO, http://www.cst.de.
Marklein, R.: The Finite Integration Technique as a General Tool to Compute Acoustic, Electromagnetic, Elastodynamic, and Cou-pled Wave Fields, in Review of Radio Science: 1999-2002 URSI, edited by: Stone, W. R., IEEE Press, Piscataway, 201-244, 2002. Marklein, R., Balasubramanian, K., Qing, A., and Langenberg, K. J.: Linear and nonlinear iterative scalar inversion of multi-frequency multi-bistatic experimental electromagnetic scattering data, Inverse Problems, 17, 1597–1610, 2001.
Marklein, R., Balasubramanian, K., Langenberg, K. J., Miao, J., and Sinaga, S. M.: Applied Linear and Nonlinear Scalar Inverse Scattering: A Comparative Study, Proceedings of the XXVIIth General Assembly of the International Union of Radio Science (URSI), CD-ROM, 2002.
Marklein, R., Mayer, K., Hannemann, R., Krylow, T., Balasubra-manian, K., Langenberg, K. J., and Schmitz, V.: Linear and non-linear inversion algorithms applied in nondestructive evaluation, Inverse Problems, 18, 1733–1759, 2002.
Mayer, K., Marklein, R., Langenberg, K. J., and Kreutter, T.: Three-dimensional imaging system based on Fourier transform syn-thetic aperture focusing technique, Ultrasonics, 28, 241–255, 1990.
Pelekanos, G. and Sevroglou, V.: Journal of Computational and Ap-plied Mathematics, 151, 129–140, 2003.
Shlivinski, A., Langenberg, K. J., and Marklein, R.: Ultrasonic Modelling and Imaging in Dissimilar Welds, Proceedings of the 30th MPA-Seminar in Conjunction with the 9th German-Japanese Seminar, Stuttgart, 2004.