O R I G I N A L R E S E A R C H
Open Access
Point-spread function reconstructed PET
images of sub-centimeter lesions are not
quantitative
O. L. Munk
1*, L. P. Tolbod
1, S. B. Hansen
1and T. V. Bogsrud
1,2* Correspondence:[email protected] 1
Department of Nuclear Medicine & PET Centre, Aarhus University Hospital, Aarhus, Denmark Full list of author information is available at the end of the article
Abstract
Background:PET image reconstruction methods include modeling of resolution degrading phenomena, often referred to as point-spread function (PSF) reconstruction. The aim of this study was to develop a clinically relevant phantom and characterize the reproducibility and accuracy of high-resolution PSF reconstructed images of small lesions, which is a prerequisite for using PET in the prediction and evaluation of responses to treatment.
Sets of small homogeneous18F-spheres (range 3–12 mm diameter, relevant for small lesions and lymph nodes) were suspended and covered by a11C-silicone, which provided a scattering medium and a varying sphere-to-background ratio. Repeated measurements were made on PET/CT scanners from two vendors using a wide range of reconstruction parameters. Recovery coefficients (RCs) were measured for clinically used volume-of-interest definitions.
Results:For non-PSF images, RCs were reproducible and fell monotonically as the sphere diameter decreased, which is the expected behavior. PSF images converged slower and had artifacts: RCs did not fall monotonically as sphere diameters decreased but had a maximum RC for sphere sizes around 8 mm, RCs could be greater than 1, and RCs were less reproducible. To some degree, post-reconstruction filters could suppress PSF artifacts. Conclusions:High-resolution PSF images of small lesions showed artifacts that could lead to serious misinterpretations when used for monitoring treatment response. Thus, it could be safer to use non-PSF reconstruction for quantitative purposes unless PSF reconstruction parameters are optimized for the specific task.
Keywords:Positron emission tomography, Reconstruction, Point spread function, Standardized uptake value (SUV), Quantitative imaging, Image artifacts
Background
The spatial resolution and signal-to-noise ratio of PET images have improved significantly due to image reconstruction methods that include modeling of resolution degrading phenomena, particularly detector effects such as crystal size, inter-crystal scattering, and crystal penetration, but also positron range and angle deviation from 180° during electron-positron annihilation. This more accurate system matrix is used in statistical reconstruction algorithms, also referred to as resolution recovery, resolution modeling, or point-spread function (PSF) reconstruction [1, 2]. Today, all major vendors of clinical whole-body PET/CT systems provide PSF reconstruction algorithms for clinical PET
imaging. PSF reconstruction produces images with improved isotropic spatial resolution, reduced spill-in/spill-out, and ultimately increased activity concentration (Bq/mL) or stan-dardized uptake value (SUV) in small lesions that are thus more easily detected and characterized. These benefits have been demonstrated as higher recovery coefficients (RCs) in NEMA phantom studies [3] and improved lesion detectability in patient studies [4].
There is a growing interest for using PET in the prediction and evaluation of early re-sponses to treatment, such as chemotherapy, radiotherapy, and local ablative therapy, e.g., of liver metastases, in order to identify non-responders as soon as possible to optimize their treatment strategy [5–8]. PET images used to plan and evaluate thera-peutic strategies should have a high spatial resolution and good contrast-to-noise ratio, but foremost the measurements need to be quantitative and reproducible. PSF images have distinct noise texture [3, 9] and artifacts such as edge overshoot and hyper-resolution of focal uptake [10–12]. These unwanted effects on the quantification of small structures need to be thoroughly studied in a clinical relevant setting as these ar-tifacts are not revealed by the standard NEMA image quality test [13]. The NEMA image quality measurement is widely used to compare the image quality of different imaging systems where a phantom containing six fillable spheres of different sizes (10– 37 mm diameter) are imaged so that the hot spheres have a fixed activity concentration four and eight times that of the background. However, NEMA phantom and other commercially available phantoms have limitations with respect to evaluation of small lesions as their spheres are too large compared to the size of small lesions that can be detected in clinical practice. Furthermore, the fillable acrylic glass spheres in the phantoms separate the hot spheres from the background activity by a non-radioactive layer, which does not mimic the physiologic reality and cause quantitative errors [14], particularly for small diameters.
In this study, we developed a new phantom to produce clinically relevant measure-ments to study the performance of PSF reconstruction algorithms for the quantification of small sub-centimeter lesions in direct contact with surrounding tissue. We scanned phantoms with small sub-centimeter spheres at a wide range of sphere-to-background ratios (1:1 to 15:1). PET data were acquired on PET/CT systems from two vendors, we reconstructed images with and without PSF, and we explored effects of convergence and post-reconstruction filtering. We measured activity concentrations and RCs based on volumes of interests (VOIs) commonly used for cancer diagnostics to assess whether PSF reconstructed images of small lesions provide accurate quantification, which is needed for treatment response monitoring or tracer kinetic modeling.
Methods
Preparation of wall-less sub-centimeter sphere phantoms
free air. The second set was suspended and covered by 250-mL two-component sili-cone (Magic Gel 1000, Raytech, Italy) that provided a scattering medium. The third set was embedded in 250-mL 11C-silicone that was prepared by mixing a small volume of
11
C solution into one of the silicone components using a magnetic stirrer before adding the second component, which allowed us to study the spheres at varying sphere-to-background ratios. We verified that18FDG did not move by diffusion from the spheres into the silicone. New phantoms were prepared for each PET scan and placed in the scanner with a large source of the18FDG-reference (around 25 mL remaining from the sphere production). The sphere production method using molds was originally developed by Skretting and co-workers [15], and in this study it was further improved by the surrounding non-diffusible scatter medium that allowed us to construct a clinical relevant phantom mimicking small homogeneous hot lesions in direct contact with surrounding tissue.
Phantom scans
PET list mode data acquisitions were performed on two widely used clinical PET/CT systems: Siemens Biograph 64 Truepoint TrueV (Siemens Healthcare, Erlangen, Germany) and GE Discovery 690 (GE Healthcare, Milwaukee, WI, USA). The scanners have similar spatial resolutions when measured according to the NEMA NU2-2007 using filtered back projection [13]: 4.4 [16] and 4.7 mm FWHM [17]. Both PET/CT sys-tems include iterative PSF reconstruction algorithms that further improve the spatial resolutions. List mode data were divided into 10 min frames and reconstructed with PSF. The data were decay-corrected using the18F half-life and corrected for scatter and attenuation using CT images. For Siemens Biograph 64, list mode data were separated in prompt and random sinograms, and images were reconstructed using attenuation weighted ordered subset expectation maximization without PSF (Iterative3D) and with PSF (TrueX). For GE Discovery 690, list mode data were reconstructed using VuePoint FX SharpIR algorithm with time-of-flight (TOF) and PSF. Iterative reconstruction algorithms without resolution modeling are not available for GE Discovery 690. We explored the reconstruction algorithms with varying number of iterations (keeping the number of subsets constant), width of post-filters, and size of the reconstruction matri-ces with focus on high-resolution imaging of small lesions (see figures for details).
Image analyses
(Amax), background-corrected 3D isocontour at 50% max (A50bg), and average
activ-ity concentration (Aavg). Amax and A50bg are measures that are available on most
visualization tools and therefore reflect how physicians perceive lesions during image reading when extracting SUV measures [19]. In contrast, Aavg is rarely used
clinically because it requires a VOI that exactly covers the lesion, and the exact di-mensions of a lesion are usually not known and cannot be reliably deduced from clinical PET images (particularly not for the smallest diameters). The activity con-centrations were used to calculate RCs (RCmax, RC50bg, and RCavg) defined as the
measured activity concentration divided by the true activity concentration. The RCs and the true sphere-to-background ratio were calculated frame-by-frame in the dynamic series. Both measures are ratios and independent of decay correction. The shorter half-life of the 11C background generated an increasing true sphere-to-background ratio as function of time.
Results
Visual inspection of hot spheres in free air
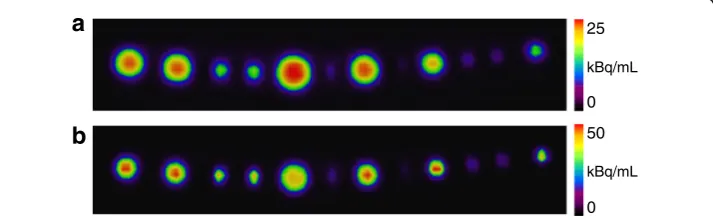
PET data of a set of hot spheres suspended in free air were reconstructed with and without PSF (Fig. 1). Visual inspection of the images reconstructed without PSF (Fig. 1a) revealed the expected monotonic relation between the measured ac-tivity concentration and the size of a sphere [18]. All spheres contained the same activity concentration, but limited spatial resolution and spill-out lead to mono-tonically lower RC (lower measured activity concentration) for smaller spheres. On the PSF image (Fig. 1b), the spheres had higher measured activity concentra-tion, but the relation between the measured activity concentration and the size of a sphere was non-monotonic with a maximum value around 8 mm. The experi-ment was reproduced with a new set of spheres suspended in free air that was scanned on three different Siemens Biograph TrueV PET/CT systems with the same results: a monotonic relation between RC and sphere size on images recon-structed without PSF, and a non-monotonic relation with a maximum value at 8 mm on the PSF images.
25
0
kBq/mL
50
0
kBq/mL
a
b
Recovery as function of sphere size and sphere-to-background ratio
Three sets of spheres were prepared from the same 18FDG-solution and suspended in free air, silicone and 11C-silicone. The three sets were placed in the scanner with an
18
FDG-reference, and list mode data were acquired. Images were reconstructed with and without PSF. Figure 2 shows the RC50bg as function of the true
sphere-to-background ratio for the spheres suspended in 11C-silicone that were scanned using Siemens Biograph Truepoint TrueV PET/CT. All RCs were initially around 1, since the initial sphere-to-background was around 1 resulting in equal amount of spill-in and spill-out of signal between spheres and the background [18]. For the images recon-structed without PSF (Fig. 2a), the monotonic relation between RC and sphere size de-veloped as the true sphere-to-background ratio increased, and spill-out from spheres to the background became more important. For the PSF images (Fig. 2b), the RCs were slightly increasing for the 6–10 mm spheres as the true sphere-to-background ratios increased, whereas the RCs for the smallest spheres (3–4 mm) decreased as the true sphere-to-background ratios increased. The non-monotonic relation between RC and sphere size was independent of the true sphere-to-background ratio. The experiment was repeated on a GE Discovery 690 PET/CT scanner with a new set of spheres. Figure 3 shows two PSF reconstructions from the GE Discovery 690 PET/CT where the higher spatial resolution on Fig. 3b (large matrix) leads to higher RCs, particularly for the 6-mm sphere, and exactly the same distinct features and non-monotonic rela-tion between RC and sphere size as PSF images from the Siemens Biograph Truepoint TrueV PET/CT. RCmaxcurves were similar RC50bgbut noisier (data not shown).
Reproducibility of RC measurements
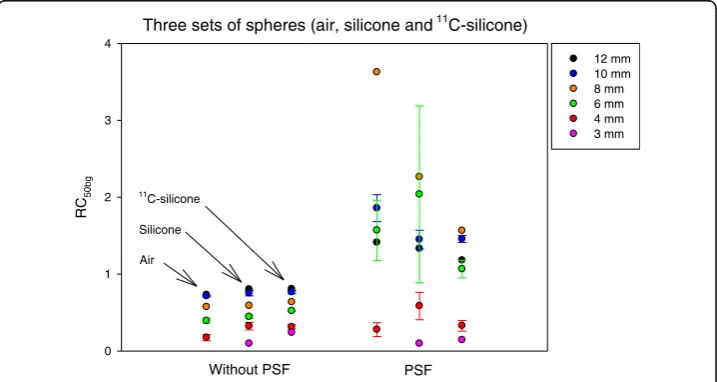
For images without PSF, the RCs followed the same and reproducible pattern for each sphere size, which depends on the surrounding medium: RCair≤RCsilicone≤RC11C-silicone
(Fig. 4). This also showed that the phantom production was highly reproducible. In
a Spheres in 11C-silicone (without PSF) b
True sphere-to-background ratio
1 5 10 15
RC
50bg
0.0 0.5 1.0 1.5 2.0
Spheres in 11C-silicone (PSF)
True sphere-to-background ratio
1 5 10 15
RC
50bg
0.0 0.5 1.0 1.5 2.0
12 mm 10 mm 8 mm 6 mm 4 mm 3 mm
Fig. 2Spheres in11C-silicone scanned on Siemens Biograph 64 Truepoint PET/CT. Two image series based
on the same PET raw data were analyzed.aWithout PSF (Iterative3D, 4 iterations, 16 subsets, 2-mm Gauss-ian filter, 336 × 336 matrix, voxel size 2.0 × 2.0 × 2.0 mm3); andbWith PSF (TrueX with PSF, 4 iterations, 21
subsets, 2-mm Gaussian filter, 336 × 336 matrix, voxel size 2.0 × 2.0 × 2.0 mm3). The x-axes are the true
sphere-to-background ratio from 1:1 to 15:1. The y-axes are RCs measured as RC50bg. For 10, 6, and 4 mm
spheres, the lines are mean values and error bars are ± standard deviation. With PSF, the RC50bgcan be > 1,
contrast, PSF images reconstructed using the same PET raw data lead to higher, non-monotonic, and less reproducible RCs.
RC as function of iterations
The three metrics (Amax, A50bg, and Aavg) all exhibited the same trend where RCs
in-creased with inin-creased number of iterations. The RCs for both maximum-based metrics were similar but with RCmax(data not shown) being slightly higher than RC50bg. The
convergence speed (RCs vs iterations) was markedly slower when using PSF
a Spheres in 11 b
C-silicone (PSF - small matrix)
True sphere-to-background ratio
1 5 10 15
RC
50bg
0.0 0.5 1.0 1.5 2.0
Spheres in 11C-silicone (PSF - large matrix)
True sphere-to-background ratio
1 5 10 15
RC
50bg
0.0 0.5 1.0 1.5 2.0
12 mm 10 mm 8 mm 6 mm 4 mm 3 mm
Fig. 3Spheres in11C-silicone scanned on GE Discovery 690 PET/CT. Two image series, both with PSF, based on the same PET raw data were analyzed.aVuePoint FX SharpIR with TOF and PSF (3 iterations, 24 subsets 4-mm 2D Gaussian filter, and [1, 1, 6] axial convolution filter, 192 × 192 matrix, voxel size 3.7 × 3.7 × 3.3 mm3) with moderate spatial resolution; andbVuePoint FX SharpIR with TOF and PSF (4 iterations, no
post-filter, 256 × 256 matrix, voxel size 2.0 × 2.0 × 3.3 mm3) with higher spatial resolution. VOI definition, symbols, and axes are as described in Fig. 2. Similar to Fig. 2b, this PSF algorithm also leads to images where RCs can be non-monotonic function of sphere size with RC50bg> 1, and with the highest RCs for
8–10 mm spheres
Three sets of spheres (air, silicone and 11C-silicone)
RC
50bg
0 1 2 3 4
12 mm 10 mm 8 mm 6 mm 4 mm 3 mm
Without PSF PSF
11
C-silicone
Silicone
Air
Fig. 4The three sets of spheres made from the same18FDG-solution were scanned using Siemens
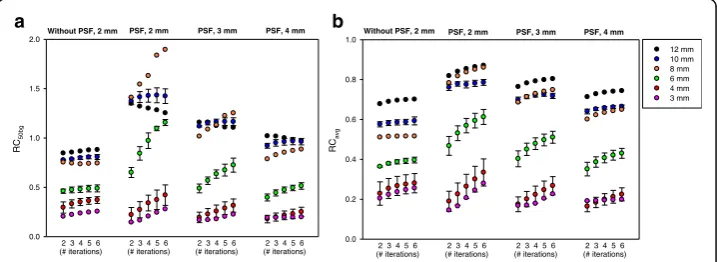
reconstruction (Fig. 5). For the smallest 3–4 mm spheres, PSF reconstruction could in fact lead to lower RCs than reconstruction without PSF, but RCs were always found to increase with number of iterations. Without PSF, RC50bg was a monotonically
increas-ing function of sphere size and always less than 1. With PSF, a non-monotonic relation between RC and sphere size was pronounced when using many iterations and narrow post-filters. The 8-mm sphere had a particularly high RC50bg. RCavg, which is based on
a large VOI with volume equal to the physical sphere, was more robust to edge over-shoot caused by PSF reconstruction than maximum-based measures such as RC50bg
(Fig. 5b).
Optimized reconstruction parameters
The majority of the tested combinations of iterations and post-filter widths lead to RC50bglarger than 1 and a clearly non-monotonic relationship between RC and sphere
size (Fig. 5a). However, the use of wider post-filters suppressed the PSF artifact and re-stored the monotonic relationship but at the cost of lower spatial resolution. Very wide post-filters removed the PSF artifacts but also the benefit of higher RCs using PSF re-construction. For the data in Fig. 5a, there was not one optimal set of reconstruction parameters for all sphere sizes. The use of 4 iterations, 21 subsets, and a 3-mm Gauss-ian filter produced images that restored the monotonic relation between RC and lesion size while still providing higher RCs than images reconstruction without PSF for sphere sizes around 6–12 mm. The PSF artifacts were much less pronounced when images are evaluated using Aavg (Fig. 5b). RCavg values were always less than 1, and only for the
narrow 2-mm post-filter a non-monotonic behavior was observed for all iterations.
Discussion
Contemporary reconstruction algorithms all include PSF, which provide improved spatial resolution and better lesion detectability [4]. In this project, we developed a phantom to mimic small lesions in a patient, which allowed us to evaluate the accuracy
RC 50bg 0.0 0.5 1.0 1.5 2.0
2 3 4 5 6 (# iterations)
2 3 4 5 6 (# iterations)
2 3 4 5 6 (# iterations)
2 3 4 5 6 (# iterations)
Without PSF, 2 mm PSF, 2 mm PSF, 3 mm PSF, 4 mm
RC avg 0.0 0.2 0.4 0.6 0.8 1.0 12 mm 10 mm 8 mm 6 mm 4 mm 3 mm
2 3 4 5 6 (# iterations)
2 3 4 5 6 (# iterations)
2 3 4 5 6 (# iterations)
2 3 4 5 6 (# iterations)
Without PSF, 2 mm PSF, 2 mm PSF, 3 mm PSF, 4 mm
a b
Fig. 5Spheres in11C-silicone scanned on Siemens Biograph 64 Truepoint PET/CT. RC
50bg(a) and RCavg(b)
as function of iterations and sphere size for true sphere-to-background ratio around 8:1. Images were recon-structed with varying iterations (the number of subset was kept constant: 16 without PSF and 21 with PSF) and post-filter widths using a 336 × 336 × 109 matrix with a voxel size 2.0 × 2.0 × 2.0 mm3. For 10, 6, and
4 mm spheres, the symbols are mean values and error bars are ± standard deviation. Note: the VOI used for the 3 mm consists of only 1 voxel. Thus, for the 3-mm sphere RCavgis equal to RCmax. With PSF and a
and precision of RCs in small lesions. Our results confirm previous findings that PSF reconstruction leads to higher lesion detectability. However, we found that PSF recon-struction produced image artifacts such as RCs that are not a monotonic function of le-sion size (Fig. 1) for all tumor-to-background ratios (Figs. 2 and 3), and RCs that are noisy and could have values greater than 1 (Fig. 4). It is crucial to understand the PSF artifacts otherwise they can lead to serious unwanted consequences when using SUV measures to monitor disease and treatment response. We note that the PSF artifacts are present on two different PET/CT systems (Figs. 2 and 3) and are thus not caused by vendor-specific implementations of PSF in their reconstruction algorithms.
A limitation of this study is that our phantom did not include all challenging charac-teristics of real patient scans such as varying patient sizes, image noise, location and shape of lesions, and respiratory movement, but the setup was useful to optimize PSF reconstruction parameters for quantification. The experiment including production of the spheres was highly reproducible as seen for reconstruction without PSF (Fig. 4). For the three sets of spheres, the RCs depended on the surrounding medium as expected. In free air, the positron range is large leading to the lowest RCs, with silicone as scatter-ing medium the RCs will be slightly higher, and with11C-silicone background there will be less spill-over and RCs will be highest. Thus, for a late image in the dynamic series with low 11C-background activity, similar RCs should be expected for spheres of the same size but with a tendency: RCair≤RCsilicone≤RC11C-silicone. However, RCs were less
reproducible for PSF reconstruction.
In practice, the physical size of a lesion is difficult to derive from PET images due to spill-out and partial volume effects [18]. Thus, in clinical studies the quantification is generally based on the maximum voxel value or the average values inside a 3D isocon-tour [19], and we have shown that this may lead to wrong conclusions. As an example, imagine a patient with a small (sphere-shaped) tumor being treated with 6 cycles of chemotherapy. After 2 cycles, the tumor diameter shrinks from 12 to 8 mm with the remaining tumor tissue having unchanged physiology. The treatment appears to be ef-fective, the tumor volume has been reduced by more than a factor 3, and the patient has a chance to be completely cured after the remaining treatments. However, the pa-tient had a PET scan acquired after 2 cycles of chemotherapy being compared to a pre-treatment PET baseline scan. As illustrated in Fig. 1b (compare the 12-mm sphere to the 8-mm sphere), the conclusion based on SUVs could be that SUVmaxhas increased
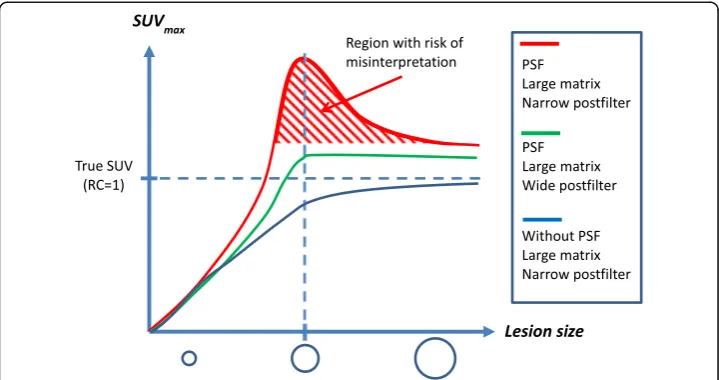
after the treatment, which usually indicates disease progression. This misinterpretation is caused by PSF artifacts and could lead to a wrong decision, e.g., to change or stop an effective treatment. Thus, it is important to optimize image reconstruction parameters to suppress PSF artifacts for images used for treatment response monitoring because the artificial non-monotonic relation between SUV and lesion size is counterintuitive based on previous experiences from the PET literature as illustrated in Fig. 6. We ex-pect that this PSF artifact is only present for high-resolution imaging of small lesions, as studied here, whereas the RC for larger lesion should not be affected by edge over-shoot using PSF reconstruction. For larger lesions, average-based RCs should approach 1 with maximum-based RCs being a bit higher due to noise.
improves detection for the larger lesions (6–12 mm diameters). These results may be explained by lack of convergence, and similar observations have been made in studies of small lesions and myocardial defects [20, 21] that also found that TOF reconstruc-tion require fewer iterareconstruc-tions to converge. Figure 5 illustrates that inclusion of PSF de-lays convergence. Without PSF, RCs were monotonic functions of sphere size and slightly increased as function of iterations. With PSF, the maximum-based measures, RC50bgand RCmax, converged slower than RCavg(compare Fig. 5a–b) probably because
the maximum voxel value is more dependent on higher-frequency features, voxel noise and edge artifacts in the image. For all spheres, RCavgand RCmaxcontinued to increase
as function of iterations (we stopped at 6 iterations 21 subsets, which is more than commonly used). This effect was particularly pronounced for the 6–8 mm spheres when using the 2-mm post-filter. The overshooting artifact leading to RC > 1 could be related to a broad PSF kernel. It has been shown that narrower PSF kernel reduces the overshooting artifact [2, 22], and that the artifact persists even when the width of the PSF matches the size of the system’s PSF [23]. It is not possible to change the PSF ker-nel width on commercial clinical scanners, but our results indicate that their standard PSF kernels may be too broad. However, wider post-filters suppressed the PSF artifacts and restored the expected relation that the RC fall monotonically as the sphere size de-creases (Fig. 5), but the post-filter should not be too wide because this would unneces-sarily reduce the RCs. As an example, TrueX with 4 iterations, 21 subsets, and a 3-mm Gaussian filter produced images that suppressed edge artifacts sufficiently to restore the expected monotonic relation between RCs and sphere size, but still provided maximum-based RCs that can be slightly larger than 1 (e.g., up to 1.2 for RC50bg). The
Fig. 6Schematic illustration regarding the challenges in choosing optimal reconstruction parameters in a clinical setting. The SUVmaxvalues are shown as a function of lesion size (SUV curve) up to 12 mm for
wider 4-mm Gaussian filter was needed to also avoid RCs larger than 1, while still providing RCs that are around 20% higher than without PSF for spheres larger than 6 mm diameter.
The best choice of PSF reconstruction parameters will be a trade-off between lesion detectability and avoiding PSF artifacts affecting quantification, which should be optimized for the specific task. In this work, we studied accuracy and precision of RCs (and SUV values) that allowed us to optimize PSF reconstruction parameters for quantification. For detection, the PSF reconstruction parameters should optimize the signal-to-background ratio while also accounting for image noise, which was not studied here. PSF reconstruction leads to decreased noise at the individual voxel level but with increased correlation among nearby voxels, which leads to distinct noise texture being less granular but lumpier [9, 22]. The lumpy noise decreases reproducibility when quantifying VOIs of a similar or smaller size as the PSF noise structures, as we have demonstrated (Fig. 4). Thus, PSF images should be used with caution for quantitative analyses of small lesions.
The phenomena described are relevant not only for the measurement of SUV but for visual assessment of PET images, as well. In this work, we have studied the perform-ance of PSF reconstruction algorithms for the quantification of tracer uptake in small, sub-centimeter lesions at varying lesion-to-background ratios. It must be anticipated that the phenomena described is valid for thin tissue layers, as well, e.g., pleura and peritoneum, the narrow periphery of cystic and necrotic tumors and for vessel walls. Also, variation in apparent cortical brain uptake could be caused by variation in cortical thickness rather than variation in metabolic activity. As a result of the same phenom-ena, it must also be anticipated that the SUV might be biased in small liver lesions (e.g., liver cysts) with reduced uptake compared to surrounding normal liver tissue, as well as in the lumen of arteries with increased uptake in the vessel wall (e.g., arteritis). In these special cases, the quantitative properties of high-resolution PET images should be validated using dedicated phantoms preferably avoiding artificial non-radioactive layers caused by plastic walls in commercial fillable phantoms [14]. A recent study ex-plored the use of PSF reconstructed images for volume segmentation in delineation of tumor volumes in radiotherapy planning [24]. Compared to our study, they used a NEMA phantom with extra spheres and reconstructed images using wider filters, i.e., with lower spatial resolution, but interestingly, they identified problems related to lar-ger spheres and recommended not to use PSF reconstruction for volume segmentation using adaptive thresholding methods. For multicenter studies, the measured SUV values are further impacted by the use of different scanners and reconstruction algo-rithms. NEMA studies can be made to harmonize SUV quantification, and a method to make SUV values comparable without applying wide post-filters that would obscure le-sion detection has recently been suggested [25]. However, quantitative PET imaging of small lesions still require further investigations.
Conclusions
safer to use non-PSF reconstruction for quantitative purposes unless PSF reconstruc-tion parameters are optimized to suppress PSF artifacts.
Additional files
Additional file 1: Figure A1.The mold used to produce the twelve spheres [15]. The mold has an upper and lower part that can be split. A thin 0.4 mm diameterfishing line is placed through twelve spheres before assembling the two parts. The18F-gel mixture is withdrawn into a syringe and injected into the lower part of the mold to avoid air bubbles.
The vertical hole in the top and bottom of each sphere has a 0.6 mm inner diameter. Thus, the spheres can only be filled with an18F mixture that is homogenous. The18F mixture is held in place by capillary forces until it settles. Then, the two
parts of the mold is split, and a string of 12 homogenous spheres are released.Figure A2.Top: A string with twelve18F spheres (yellow) in air. Bottom: A string with twelve18F spheres (yellow) suspended in11C silicone (blue). (DOCX 185 kb)
Acknowledgements
We acknowledge late Arne Skretting, medical physicist (The Intervention Centre, Oslo University Hospital, Oslo, Norway), for pivotal discussions on the experimental setup and data interpretation.
Authors’contributions
All authors conceived the study and participated in its design. OLM produced the sphere phantoms. OLM and LPT PET scanned the phantoms. OLM carried out the data analyses and drafted the manuscript. All authors participated in the interpretation of the data. All authors read and approved the final manuscript.
Competing interests
The authors declare that they have no competing interests.
Author details
1Department of Nuclear Medicine & PET Centre, Aarhus University Hospital, Aarhus, Denmark.2Department of
Radiology and Nuclear Medicine, Oslo University Hospital, Oslo, Norway.
Received: 30 July 2016 Accepted: 10 December 2016
References
1. Panin VY, Kehren F, Michel C, Casey M. Fully 3-D PET reconstruction with system matrix derived from point source measurements. IEEE Trans Med Imaging. 2006;25:907–21.
2. Sureau FC, Reader AJ, Comtat C, et al. Impact of image-space resolution modeling for studies with the high-resolution research tomograph. J Nucl Med. 2008;49:1000–8.
3. Tong S, Allesio AM, Kinahan PE. Noise and signal properties in PSF-based fully 3D PET image reconstruction: an experimental evaluation. Phys Med Biol. 2010;55:1453–73.
4. Andersen FL, Klausen TL, Loft A, Beyer T, Holm S. Clinical evaluation of PET image reconstruction using a spatial resolution model. Eur J Radiol. 2013;82:862–9.
5. Somer EJ, Pike LC, Marsden PK. Recommendations for the use of PET and PET-CT for radiotherapy planning in research projects. Br J Radiol. 2012;85:e544–8.
6. de Geus-Oei LF, Vriens D, van Laarhoven HW, van der Graaf WT, Oyen WJ. Monitoring and predicting response to therapy with 18 F-FDG PET in colorectal cancer: a systematic review. J Nucl Med. 2009;50 Suppl 1:43S–54S. 7. Bussink J, Kaanders JH, van der Graaf WT, Oyen WJ. PET-CT for radiotherapy treatment planning and response
monitoring in solid tumors. Nat Rev Clin Oncol. 2011;8:233–42.
8. Dimitrakopoulou-Strauss A. PET-based molecular imaging in personalized oncology: potential of the assessment of therapeutic outcome. Future Oncol. 2015;11:1083–91.
9. Rahmim A, Tang J. Noise propagation in resolution modeled PET imaging and its impact on detectability. Phys Med Biol. 2013;58:6945–68.
10. Watson CC. Estimating effective model kernel widths for PSF reconstruction in PET. IEEE Nuclear Science Symposium and Medical Imaging Conference, 2011; IEEE New York:2368–2374.
11. Watson CC. Measurement of the physical PSF for an integrated PET/MR using targeted positron beams. IEEE Nuclear Science Symposium and Medical Imaging Conference, 2012; IEEE New York: 2089–2095.
12. Rahmim A, Qi J, Sossi V. Resolution modeling in PET imaging: theory, practice, benefits, and pitfalls. Med Phys. 2013;40:064301.
13. National Electrical Manufacturers Association (NEMA). Standards publication NU 2-2012: performance measurements of positron emission tomographs. Rosslyn: NEMA; 2012.
14. Berthon B, Marshall C, Edwards A, Evans M, Spezi E. Influence of cold walls on PET image quantification and volume segmentation: a phantom study. Med Phys. 2013;40:082505.
15. Skretting A, Glomset O, Bogsrud TV. A phantom for investigation of tumour signal and noise in PET reconstruction with various smoothing filters: experiments and comparisons with simulated intensity diffusion. Radiat Prot Dosimetry. 2010;139:191–4.
16. Jakoby BW, Bercier Y, Watson CC, Bendriem B, Townsend DW. Performance characteristics of a new LSO PET/CT scanner with extended axial field-of-view and PSF reconstruction. IEEE Trans Nucl Sci. 2009;56:633–9. 17. Bettinardi V, Presotto L, Rapisarda E, Picchio M, Gianolli L, Gilardi MC. Physical performance of the new hybrid
PET∕CT Discovery-690. Med Phys. 2011;38:5394–411.
19. Boellaard R, Delgado-Bolton R, Oyen WJ, et al. FDG PET/CT: EANM procedure guidelines for tumour imaging: version 2.0. Eur J Nucl Med Mol Imaging. 2015;42:328–54.
20. Schaefferkoetter J, Casey M, Townsend D, El Fakhri G. Clinical impact of time-of-flight and point response modeling in PET reconstructions: a lesion detection study. Phys Med Biol. 2013;58:1465–78.
21. Schaefferkoetter J, Ouyang J, Rakvongthai Y, Nappi C, El Fakhri G. Effect of time-of-flight and point spread function modeling on detectability of myocardial defects in PET. Med Phys. 2014;41:062502.
22. Blinder SA, Dinelle K, Sossi V. Scanning rats on the high resolution research tomograph (HRRT): a comparison study with a dedicated micro-PET. Med Phys. 2012;39:5073–83.
23. Tong S, Alessio AM, Thielemans K, Stearns C, Ross S, Kinahan PE. Properties of edge artifacts in PSF-Based PET reconstruction, IEEE Nuclear Science Symposium and Medical Imaging Conference, 2010, IEEE New York: 3649–3652
24. Matheoud R, Ferrando O, Valzano S, et al. Performance comparison of two resolution modeling PET reconstruction algorithms in terms of physical figures of merit used in quantitative imaging. Phys Med. 2015;31:468–75.
25. Quak E, Le Roux PY, Hofman MS, et al. Harmonizing FDG PET quantification while maintaining optimal lesion detection: prospective multicentre validation in 517 oncology patients. Eur J Nucl Med Mol Imaging. 2015;42:2072–82.
Submit your manuscript to a
journal and benefi t from:
7Convenient online submission
7Rigorous peer review
7Immediate publication on acceptance
7Open access: articles freely available online
7High visibility within the fi eld
7Retaining the copyright to your article