MURDOCH RESEARCH REPOSITORY
This is the author’s final version of the work, as accepted for publication following
peer review but without the publisher’s layout or pagination.
Tyne, J., Loneragen, N., Krutzen, M., Allen, S. and Bejder, L. (2010)
An integrated data management and video system for sampling
aquatic benthos. Marine Freshwater Research,
61 (9). pp. 1023-1028..
Copyright © CSIRO.
An integrated data management and video system for sampling aquatic benthos
Julian A. TyneA,C, Neil R. LoneraganA, Michael Krützen B,A, Simon J. AllenA and Lars BejderA
A Centre for Fish and Fisheries Research, Cetacean Research Unit, School of Biological Sciences and
Biotechnology, Murdoch University, South Street, Murdoch, WA 6150, Australia.
B Evolutionary Genetics Groups, Anthropological Institute and Museum, University of Zurich,
Winterthurerstr. 190, CH-8057 Zurich, Switzerland.
C Corresponding author. Email: [email protected]
Abstract. Remote video systems can be expensive, slow to deploy and the data recorded may not be available until the system has been retrieved. To overcome these issues, a rapid, non-destructive and cost-effective remote video and data management system was developed to record benthic habitats in Shark Bay, Western Australia. This system comprises a downward-oriented video camera, linked to a laptop computer, attached to the apex of a stainless steel pyramid to film a 1-m2 area of
benthos. The video image of the substratum, spatial coordinates, depth and temperature are recorded in a database at the time of deployment. A web interface was developed to manage the database and examine the video images to determine the percentage cover of seagrass, sponge type (conical/non-conical) and the total number of sponges in the quadrat. Using this system, 1380 video quadrats were collected from a study area of, 248 km2, ranging in water depth from 2 m to 16 m. An
Introduction
Sampling methods for determining the nature and extent of marine benthos depend on the focus of the study, the nature and scale of the study site and practical and economic considerations (Bale and Kenny 2005; Murphy and Jenkins 2010). Typically, monitoring marine communities in remote sites is expensive, so methods that reduce the time and costs of sampling are desirable (Preskitt et al. 2004).
Rigorous sampling programs to test hypotheses about pat-terns and processes in marine habitats are important for under-standing natural processes (Underwood and Chapman 2005). Traditional sampling methods for marine benthic habitats, such as grabs, cores and trawls, remove part of the benthos, disturb the area being studied and prevent repeated sampling at the same site (Smith and Rumohr 2005). Furthermore, destructive sampling techniques are typically prohibited in marine protected areas (e.g. Watson et al. 2005), so alternative methods must be sought.
The most frequently used method for studying shallow, marine habitats (o20 m) involves SCUBA divers performing an underwater visual census (UVC) (Watson et al. 2005). This approach has physical and environmental limitations (Stobart et al. 2007; Murphy and Jenkins 2010), and bias due todifferences between divers, including their behaviour, levels of experience and subjective
decision-making (Edgar et al. 2004). Remote underwater video systems (RUVS) and baited remote underwater video systems (BRUVS) have been used to minimise the limitations of UVC and the biases inherent in the presence of divers in the study environment (Harvey et al. 2007; Stobart et al. 2007). These remote video techniques are relatively non-destructive, cost-effective, retain a
permanent record of the information and are not limited by depth (Harvey et al. 2007). However, these systems can be relatively slow to deploy and retrieve and have been predominantly used to count and measure fish (Willis and Babcock 2000; Watson et al. 2005; Cappo et al. 2007; Harvey et al. 2007; Stobart et al. 2007).
The focus of our study was on sessile benthic organisms that are generally patchy in distribution and abundance (Underwood and Chapman 2005), and require an intensive sampling regime to obtain accurate and precise estimates of abundance. This, in conjunction with cost and time constraints, provided an opportunity to develop and deploy an alternative remote video sampling method. Here, we present an integrated data management and video system that was developed to study aquatic benthic habitats. While the system was developed to study the presence and absence of sponges, sponge type (conical/non-conical), sponge abundance and percentage seagrass cover in 1380 1-m2 quadrats over an area of ,248 km2, it is also widely applicable to study other aquatic
organisms such as coral reefs (Ninio et al. 2003) and abalone (Hart et al. 2008). The system was designed to meet the following criteria:
(1) be cost-effective and non-destructive;
(3) allow the efficient deployment and retrieval of video camera and frame to capture, store and view data in a database in the field, thus reducing data entry duplication and ensuring data integrity; and
(4) provide a system for storing and maintaining data (including backup) that readily interfaces with other software.
This research formed part of a study to investigate the distribution of sponges and seagrass in the Western Gulf of Shark Bay, Western Australia, and test whether the distribution of sponges influenced the distribution of dolphins showing sponging behaviour, that is, using sponges as tools for foraging (Krützen et al. 2005).
Material and methods
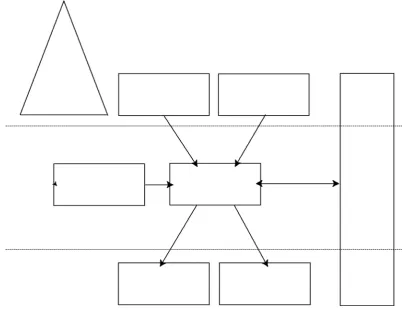
The architecture of the system consisted of a collection of stand-alone electronic, software and hardware units that were linked to allow data acquired in the field to be captured and stored in a database, and retrieved and summarised to allow the progress of the field sampling to be followed and modified if necessary (Fig. 1). Data collection involved deploying the frame and camera at fixed points along 12 transects and recording videos of the benthic habitats directly onto a laptop computer. Each transect consisted of 23 sample points separated by 500 m. At each sample point, five deployments of the camera and frame were made, including two heading north and two heading south, separated by 150 m. A total of 115 videos were recorded for each transect. Each transect was, 2 km apart and the sampling strategy, transects and points were selected to take into account that benthic organisms are patchy in distribution and abundance (Underwood and Chapman 2005). Environmental data, namely the coordinates of the frame/quadrat, were recorded from a Garmin Global Positioning System (GPS) and water depth and water temperature were both recorded from the Lowrance (Tulsa, OK, US) depth sounder.
Camera and frame
To gather information on the presence and absence of sponges on the sea floor in a time- and cost-effective manner, a black and white bullet video camera (1/30 Sony charge-coupled device sensor
512 ₃ 582 pixels), waterproof to 30 m, with infrared illumination was connected via a 25-m cable to a USB video capture card on a laptop computer. The video camera was powered by a 12-V DC power supply. Ulead Video Studio 6.00 SE software (http://www.ulead.com/) was used to capture video input from the USB capture card.
In air, the camera’s horizontal viewing angle was stated as 908, equivalent to an underwater viewing angle of, 608. Using the principles of trigonometry, a height of 1 m would have been sufficient to view the complete 1-m2 quadrat underwater.
However, the vertical viewing angle was not stated. To deter-mine the height of the camera underwater without knowing the vertical viewing angle, the camera was positioned at various heights above a 1-m2 quadrat in water. A height of 1.85 m above the seafloor was found to capture
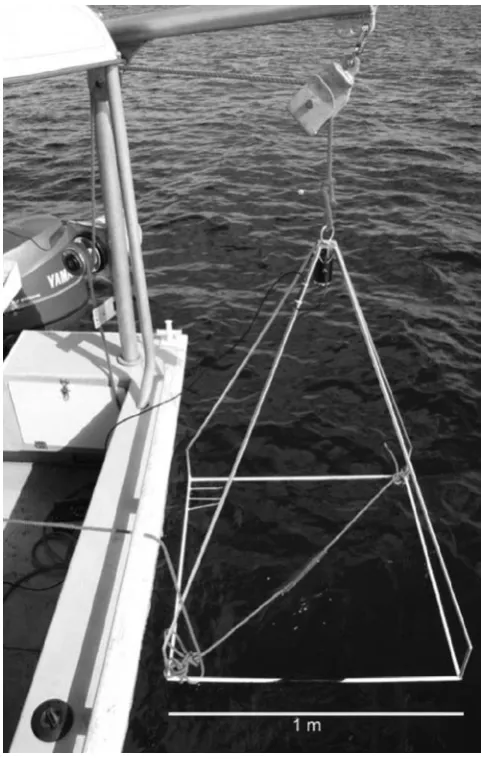
constructed. A range of digital cameras with varying focal lengths and viewing angles could be used in this system. However, the dimensions of the frame and height above the substratum required to capture the 1-m2 quadrat would need to be re-calculated, depending on the viewing angles of the
camera. The video camera was mounted at the apex of the pyramid. A hoist equipped with an electrical winch was constructed on the sampling boat to deploy and retrieve the frame (Fig. 2). The total weight of the frame, camera and cable is ,5 kg and cost only AUD$600, including the cost of materials, equipment and construction. This system is light enough to be deployed and retrieved either by electrical winch or by hand in shallow water (up to 16 m in Shark Bay).
Database development, field sampling and data acquisition
A relational database was developed in MS Access to store all the field data electronically. This system eliminates the manual data entry stage and the need to record large amounts of data on paper. It also reduces the potential for data loss and manages the interrogation and manipulation of data using the Structured Query Language (SQL), which is designed to retrieve and manage data in relational databases. This system also provides a good interface for accessing data from other applications, such as geographic information systems (e.g. ArcGIS) and statistical analyses packages (e.g. SPSS, MS Excel). MS Access was chosen as the database because of its ready availability and capacity to integrate with many other software applications. Three groups of queries were developed to summarise the data in formats for:
(1) IDRISI GIS software (Eastman 2006) to produce spatial distribution maps of sponges and seagrass; (2) statistical software packages, such as MS Excel and SPSS to summarise and analyse data; and (3) the web to analyse the videos and update and search the data.
The sample site coordinates were calculated and entered into the database before field sampling. These coordinates were then downloaded to the boat’s GPS before each sampling trip. At each sampling site, the frame and camera were lowered to the sea floor and a video of the benthic habitat was recorded onto the laptop computer. Environmental data, (e.g. temperature, depth) and spatial data (i.e. latitude and longitude) associated with each sampling point were taken from the GPS and depth sounder on the boat and manually entered into the database at the same time the video was recorded. The camera and frame were then retrieved and the boat moved to the next sampling site where the camera and frame were re-deployed.
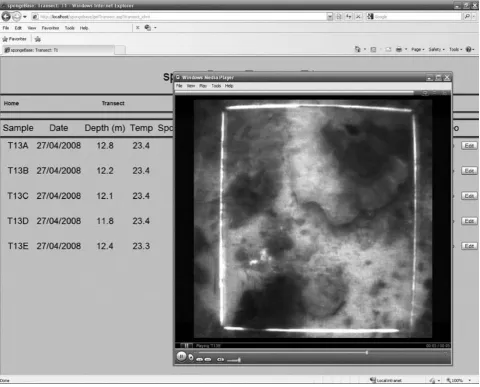
A web interface front-end to the database was developed to facilitate quick data entry in the field. This interface was also used in the laboratory to examine the videos and record the
presence/absence of sponges and seagrasses and sponge type (conical/non-conical), sponge abundance (Fig. 3) and the percentage cover of seagrass. The web interface allowed sample
information to be searched by sample site, by transect or by samples that required video analysis. To view the data collected at a sample site, a search was performed and the link for the captured video was clicked. The video was displayed using Microsoft Windows Media Player. The video was
Integration with other software
With the data recorded digitally in real-time, they are immediately available for exploring,
summarising and statistical analyses. The data were examined as they were being collected in the field. This allowed the sampling strategy to be readily modified if need be; for example, increase the number of samples should the initial analysis dictate. The data stored in the database were made available to other software. To produce GIS distribution maps, the database was accessed directly by the IDRISI GIS software; for statistical analysis we chose to export data first to MS Excel spreadsheets and then access the spreadsheets from other software (SPSS). The web interface accessed the database through a web server using Open Data-base Connectivity (ODBC).
Results and discussion
The camera system was deployed to collect spatial (latitude and longitude), biotic and abiotic environmental data from 1380 sites (samples) along 12 transects, covering an area of, 248 km2. The
camera system was successfully deployed in water depths of 2 m to 16 m (Tyne 2008). The maximum number of samples taken on any one day was 180, with an average of 16.4 (₃1.3 s.e.) samples captured per hour over a 15-day period (Table 1).
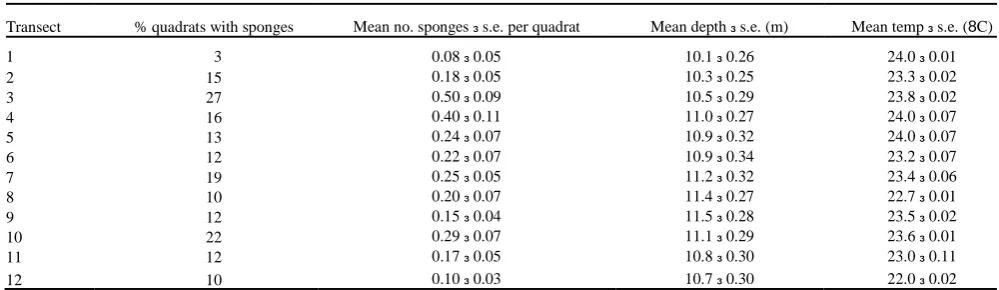
The percentage of quadrats with sponges and the mean number of sponges per quadrat varied among transects. For example, Transects 3 and 4 had the highest percentage of quadrats containing sponges (50% and 40%, respectively) while Transects 1, 8 and 12 had less than 11% of quadrats with sponges (Table 2). This difference among quadrats and the fact that only 196 of the 1380 quadrats contained sponges indicates that the distribution of sponges is patchy and emphasises the need for an intense sampling program to provide accurate estimates of the distribution and abundance. Data on the presence/absence of sponges, the percentage cover of seagrass and environmental
characteristics such as depth are being analysed using logistic regression (SPSS), Generalised Linear Models (Quinn and Keough 2002) and Digital Elevation Models to determine how their distribution varies with depth and location (J. A. Tyne, N. R. Loneragan, A. Kopps, S. J. Allen, M. Krützen and L. Bejder, unpubl. data) and to test whether a relationship exists between the distribution of sponges and that of sponging dolphins (Kru¨tzen et al. 2005; Sargeant et al. 2007).
The benthic sampling method developed here enabled the rapid deployment of a video camera quadrat system and real-time storage of data in the database on the benthic habitats of the Western Gulf of Shark Bay, Western Australia. The cost of this system was less than AUD$1000 which was an important consideration for this study and it was deployed by hand from a small vessel (5.5 m in length). The camera system was quick to deploy and retrieve at each sampling site and, like other video techniques (Willis et al. 2000; Edgar et al. 2004; Harvey et al. 2004; Murphy and Jenkins 2010), avoids biases associated with SCUBA divers such as diver behaviour, experience and subjective decision-making.
Like many field study sites, the Western Gulf of Shark Bay is remote, located, 200 km from the closest regional centre. Sampling in remote areas such as Shark Bay highlights the need for the correct tools and sufficient backup equipment to be available should any problems arise. As data were stored in electronic format, backup procedures were an important daily task. In this study, data were backed-up on an external hard drive and a thumb drive each day to limit the risk of any data loss as a result of hardware failure.
Possible modifications to the system
Future modifications to the system could be made in two areas: the structure and extent of the database; and the camera system. The data structure developed in this study could be created on a larger relational database management system, such as SQL Server
(http://technet.microsoft.com/en-us/library/cc917601. aspx) or Oracle
(http://www.oracle.com/technology/obe/ 11gr1_db/appdev/msamigrate/msamigrate.htm), which would allow the system to be incorporated in a larger marine data management system. In such a system, MS Access could be used to acquire data in the field and data would be uploaded to the central database after returning from the field. Field data acquisition is often carried out in remote areas and, increasingly, remote areas are gaining access to the internet. Thus, it may be possible to input data directly into a central database from the field using a web interface via the internet. The current database can be extended to include data from different field sites, which would allow comparisons between different marine systems.
This sampling system may also be adapted for other purposes. The camera for this system was black and white, but colour options are available. Modifying the sampling method by introducing a colour camera with a wider viewing angle and greater resolution would enable the camera to be positioned closer to the sea floor. This would allow benthic organisms to be identified to a lower taxonomic level and hence provide a more detailed description of the community. The camera in this system was mounted directly above the quadrat. However, additional cameras could be mounted at varying angles to the quadrat, which would give an alternative perspective of the marine benthos, similar to stereo video systems (Harvey et al. 2004; Watson et al. 2007). Underwater lights could be added to the camera frame to increase illumination in deeper waters or at night, and multiple cameras could be used to give an estimate of the size and structure of the benthos. Random point-count
methodology (Kohler and Gill 2006) could be employed to analyse video images to determine habitat characteristics (Dumas et al. 2009). A flow meter and a conductivity, temperature and depth (CTD) sensor could be attached to the frame to measure water flow and determine the physical properties of sea water at each benthic habitat study site. Any modifications to increase the sophistication of the existing system will increase the cost and weight of the system.
The methods for ecological assessment and monitoring are dictated by the purpose of the study (Preskitt et al. 2004; Underwood and Chapman 2005). The sampling methodology developed here was designed to determine the presence or absence of sessile organisms in the marine benthic community and to count them. It also proved to be effective for estimating the area covered by seagrass. It is possible that this remote video system could be used to monitor mobile organisms passing though the benthic habitat, such as fish (Willis and Babcock 2000) and crustaceans (Trenkel
Acknowledgements
The authors would like to thank Shark Bay Resources and Mitsui for their extensive logistical support in this project and the Useless Loop community for making us feel so at home while conducting field work. Financial support was provided by National Geographic Society, Sea World Research and Rescue Foundation, Claraz-Schenkung Switzerland, The A.H. Schultz Foundation, Switzerland, Julius-Klaus Foundation Switzerland, University of Zurich and Murdoch University. We would also like to thank Murray Lindau for constructing the camera frame and Anna Kopps and Marty Pepper for their invaluable assistance in the field. We thank the two anonymous referees and the editor of MFR for their time and constructive comments on the manuscript.
References
Bale, A. J., and Kenny, A. J. (2005). Sediment analysis and seabed character-isation. In ‘Methods for the Study of Marine Benthos’. (Eds A. Eleftheriou and A. McIntyre.) pp. 43–81. (Blackwell Publishing: Oxford.)
Cappo, M., De’ath, G., and Speare, P. (2007). Inter-reef vertebrate communities of the Great Barrier Reef Marine Park determined by baited underwater video stations. Marine Ecology Progress Series
350, 209–221. doi:10.3354/ MEPS07189
Dumas, P., Bertaud, A., Peignon, C., Le´opold, M., and Pelletier, D. (2009). A ‘‘quick and clean’’ photographic method for the description of coral reef habitats. Journal of Experimental Marine
Biology and Ecology368, 161–168. doi:10.1016/J.JEMBE.2008.10.002
Eastman, J. R. (2006). IDRISI Andes. Clark University, Worcester, MA. Edgar, G. J., Barrett, N. S., and Morton, A. J. (2004). Biases associated with the use of underwater visual census techniques to quantify the density and size-structure of fish populations. Journal of Experimental MarineBiology
and Ecology 308, 269–290. doi:10.1016/J.JEMBE.2004.03.004Hart, A. M., Fabris, F. P., Brown, J.,
and Murphy, D. (2008). Digital video surveys of abalone (Haliotis sp.) stocks by commercial fishers in Western Australia. Fisheries Research 93, 305–314. doi:10.1016/J.FISHRES.2008.06.002 Harvey, E., Fletcher, D., Shortis, M., and Kendrick, G. (2004). A comparison of underwater visual distance estimates made by scuba divers and a stereo-video system: implications for underwater visual census of reef fish abundance. Marine and Freshwater Research55, 573–580.
doi:10.1071/MF03130
Harvey, E. S., Cappo, M., Butler, J. J., Hall, N., and Kendrick, G. A. (2007). Bait attraction affects the performance of remote video stations in assessment of demersal fish community structure. Marine
EcologyProgress Series 350, 245–254. doi:10.3354/MEPS07192
Kohler, K. E., and Gill, S. M. (2006). Coral Point Count with Excel extensions (CPCe): A Visual Basic program for the determination of coral and substrate coverage using random point count methodology. Computers & Geosciences 32, 1259–1269. doi:10.1016/J.CAGEO.2005.11.009
Krützen, M., Mann, J., Heithaus, M. R., Connor, R. C., Bejder, L., et al. (2005). Cultural transmission of tool use in bottlenose dolphins. Proceedings of the National Academy of Sciences of the United
Murphy, H. M., and Jenkins, G. P. (2010). Observational methods used in marine spatial monitoring of fishes and associated habitats: a review. Marine and Freshwater Research 61, 236–252.
doi:10.1071/MF09068Ninio, R., Delean, S., Osborne, K., and Sweatman, H. (2003). Estimating cover of benthic organisms from underwater video images: variability associated with multiple
observers. Marine Ecology Progress Series 265, 107–116. doi:10.3354/MEPS265107
Preskitt, L. B., Vroom, P. S., and Smith, C. M. (2004). A rapid ecological assessment (REA) quantitative survey method for benthic algae using photoquadrats with scuba. Pacific Science58, 201–209. doi:10.1353/ PSC.2004.0021
Quinn, G. P., and Keough, M. J. (2002). ‘Experimental Design and Data Analysis for Biologists.’ (Cambridge University Press: New York.)
Sargeant, B. L., Wirsing, A. J., Heithaus, M. R., and Mann, J. (2007). Can environmental heterogeneity explain individual foraging variation in wild bottlenose dolphins (Tursiops sp.). Behavioral Ecology
and Socio-biology 61, 679–688. doi:10.1007/S00265-006-0296-8
Smith, C. J., and Rumohr, H. (2005). Imaging techniques. In ‘Methods for the Study of Marine Benthos’. 3rd edn. (Eds A. Eleftheriou and A. McIntyre.) pp. 87–111. (Blackwell Publishing: Oxford.) Stobart, B., Garcı´a-Charton, J. A., Espejo, C., Rochel, E., Gon˜i, R., et al. (2007). A baited underwater video technique to assess shallow-water Mediterranean fish assemblages: Methodological
evaluation. Journal ofExperimental Marine Biology and Ecology 345, 158–174. doi:10.1016/ J.JEMBE.2007.02.009
Trenkel, V., Le Loc’h, F., and Rochet, M.-J. (2007). Small-scale spatial and temporal interactions among benthic crustaceans and one fish species in the Bay of Biscay. Marine Biology151, 2207– 2215. doi:10.1007/ S00227-007-0655-7
Tyne, J. A. (2008). Short video of frame descent and benthic habitat of two samples in the Western Gulf of Shark Bay 2008. Available at
Underwood, A. J., and Chapman, M. G. (2005). Design and analysis in benthic surveys. In ‘Methods for the Study of Marine Benthos’. 3rd edn. (Eds A. Eleftheriou and A. McIntyre.) pp. 1–42. (Blackwell Publishing: Oxford.)
Watson, D., Harvey, E. S., Anderson, M., and Kendrick, G. A. (2005). A comparison of temperate reef fish assemblages recorded by three under-water stereo-video techniques. Marine Biology148, 415– 425. doi:10.1007/ S00227-005-0090-6
Watson, D., Harvey, E., Kendrick, G., Nardi, K., and Anderson, M. (2007). Protection from fishing alters the species composition of fish assemblages in a temperate-tropical transition zone. Marine
Biology152, 1197–1206. doi:10.1007/S00227-007-0767-0
Willis, T. J., and Babcock, R. C. (2000). A baited underwater video system for the determination of relative density of carnivorous reef fish. Marineand Freshwater Research 51, 755–763.
Willis, T. J., Millar, R. B., and Babcock, R. C. (2000). Detection of spatial variability in relative density of fishes: comparison of visual census, angling, and baited underwater video. Marine Ecology
Table 1. The number of marine benthic samples recorded each day and hour in the Western Gulf of Shark Bay, Western Australia
Day Hours on water No. of quadrats Quadrats per hour
1 2.1 35 17.0
2 2.3 77 33.9
3 2.5 25 9.9
4 10.3 156 15.1
5 10.5 160 15.3
6 1.6 35 22.6
7 7.2 90 12.6
8 5.3 95 17.9
9 3.0 46 15.3
10 4.5 88 19.8
11 9.4 128 13.6
12 5.3 103 19.4
13 6.1 112 18.4
14 10.1 180 17.8
15 4.3 50 11.8
Total 84.2 1380 16.4
Table 2. Summary of the data on sponges and environmental data for each transect in the Western Gulf of Shark Bay, Western Australia
A total of 115 quadrats were videoed along each transect and 1380 quadrats were recorded over the whole study area
Transect % quadrats with sponges Mean no. sponges ₃ s.e. per quadrat Mean depth ₃ s.e. (m) Mean temp ₃ s.e. (8C)
1 3 0.08 ₃ 0.05 10.1 ₃ 0.26 24.0 ₃ 0.01
2 15 0.18 ₃ 0.05 10.3 ₃ 0.25 23.3 ₃ 0.02
3 27 0.50 ₃ 0.09 10.5 ₃ 0.29 23.8 ₃ 0.02
4 16 0.40 ₃ 0.11 11.0 ₃ 0.27 24.0 ₃ 0.07
5 13 0.24 ₃ 0.07 10.9 ₃ 0.32 24.0 ₃ 0.07
6 12 0.22 ₃ 0.07 10.9 ₃ 0.34 23.2 ₃ 0.07
7 19 0.25 ₃ 0.05 11.2 ₃ 0.32 23.4 ₃ 0.06
8 10 0.20 ₃ 0.07 11.4 ₃ 0.27 22.7 ₃ 0.01
9 12 0.15 ₃ 0.04 11.5 ₃ 0.28 23.5 ₃ 0.02
10 22 0.29 ₃ 0.07 11.1 ₃ 0.29 23.6 ₃ 0.01
11 12 0.17 ₃ 0.05 10.8 ₃ 0.30 23.0 ₃ 0.11