Please cite this article as: M. Mahdizadeh and M. Eftekhari, A Novel Cost Sensitive Imbalanced Classification Method based on New Hybrid Fuzzy Cost Assigning Approaches, Fuzzy Clustering and Evolutionary Algorithms, International Journal of Engineering (IJE), TRANSACTIONS B: Applications Vol. 28, No. 8, (August 2015) 1160-1168
International Journal of Engineering
J o u r n a l H o m e p a g e : w w w . i j e . i r
A Novel Cost Sensitive Imbalanced Classification Method based on New Hybrid
Fuzzy Cost Assigning Approaches, Fuzzy Clustering and Evolutionary Algorithms
M. Mahdizadeh*, M. Eftekhari
Department of Computer Engineering, Shahid Bahonar University of Kerman, Kerman, Iran
P A P E R I N F O
Paper history: Received 20April 2015
Received in revised form 10June 2015 Accepted 30 July2015
Keywords:
Cost Sensitive Learning Fuzzy Clustering
Fuzzy Rule-based Classification Systems Evolutionary Algorithms
Lateral Tuning
A B S T R A C T
In this paper, a new hybrid methodology is introduced to design a cost-sensitive fuzzy rule-based classification system. A novel cost metric is proposed based on the combination of three different concepts: Entropy, Gini index and DKM criterion. In order to calculate the effective cost of patterns, a hybrid of fuzzy c-means clustering and particle swarm optimization algorithm is utilized. This hybrid algorithm finds difficult minority instances; then, their misclassification cost will be calculated using the proposed cost measure. Also, to improve classification performance, the lateral tuning of membership functions (in data base) is employed by means of a genetic algorithm. The performance of the proposed method is compared with some cost-sensitive classification approaches taken from the literature. Experiments are performed over 37 imbalanced datasets from KEEL dataset repository; the classification results are evaluated using the area under the curve (AUC) as a performance measure. Results reveal that our hybrid cost-sensitive fuzzy rule-based classifier outperforms other methods in terms of classification accuracy.
doi: 10.5829/idosi.ije.2015.28.08b.08
1. INTRODUCTION1
The classification modeling creates a model to map between a set of instances and a set of class labels. It is used to classify new data and is a well-studied technique in data mining and machine learning [1]. There is a range of classification modeling algorithms such as neural network, k-nearest neighbor, support vector machine (SVM), fuzzy rule based classification systems (FRBCSs), decision tree, and Bayesian network. Because the FRBCSs provide an interpretable model for the user, they are very useful tools in machine learning [2]. The proposed method uses FRBCS as the classifier.
Training data for classification problems, significantly influences the classification accuracy. Most standard learning algorithms assume or expect balanced class distributions or equal misclassification
1*Corresponding Author’s Email:
[email protected] (M. Mahdizadeh)
costs. One of the main problems in data mining is the class imbalance problem. It occurs, in the binary case, when there exists a considerable difference between the number of instances in each class. The minority class refers to a class with less data, while the majority class refers to that with most number of instances. This situation is difficult while trying to identify the minority class. Therefore, many methods have been proposed to address the imbalanced learning problem which is divided into two main categories: data sampling and algorithmic modification. In the first approach, training instances are modified in such a way as to balance the sample size for different classes based on a resampling strategy. The second one modifies current classification algorithms to consider the imbalanced distribution of data [3-6].
special metric is proposed to evaluate misclassification of a minority sample as a majority one. If a majority sample is misclassified as a minority one, the associated cost is 1. Guessing the correct class does not bear any cost. In this study, a cost-sensitive FRBCS is introduced for imbalanced classification problems; it is efficient in terms of classification accuracy. This method is based on the following three stages:
Cost modification: a special metric is employed to compute the misclassification cost of minority class instances. To do this, minority instances whose labeling may be difficult, are selected and their cost values change according to the proposed metric. Fuzzy rule-based classifier generation: fuzzy rules
are generated for classifying and limiting the number of rules to a constant (named Q).
Lateral tuning: finally, genetic algorithm (GA) is utilized to tune a set of membership functions; a new metric is also proposed for fitness evaluation. In order to assess the performance of the proposed approach, 37 imbalanced datasets, that are imbalanced binary classification problems, are used from the KEEL repository [7]. The AUC measure is employed to check the accuracy of the model. To check whether there exist significant differences among the results, some non-parametric statistical tests are employed.
This paper is arranged as follows. First, section 2 introduces the problem of imbalanced datasets and the evaluation measures; section 3 describes in detail, each stage of the proposed approach; section 4 shows the results from 37 datasets; and the conclusions of this work is given in section 5.
2. IMBALANCED DATASETS IN CLASSIFICATION
In this section, the concept of imbalanced datasets is described. Then, some evaluating measures are introduced for this kind of problems.
2. 1. Imbalanced Dataset Any dataset that shows an unequal distribution between its classes can be considered imbalanced. Since the imbalanced classification problem is implicit in most real world applications (e.g. risk management, finance, e-mail or micro seismic hazards in coal mines), it has attracted most academia, industries and government funding agencies [8]. In most applications, a minority class usually represents the concept of interest. Therefore, it is necessary to predict minority instances with the highest precision without decreasing the precision of the majority instances. This goal is hard to obtain.
On the other hand, standard classifier algorithms have a bias towards the majority class. Consequently,
the instances that belong to the minority class are not classified correctly in comparison with the majority class. As mentioned before, there are two main types of solutions to solve the problem of imbalanced datasets: Solutions at the data level: in this kind of solution, it
is expected to balance the class distribution on training data by over-sampling the minority class (minority instances) or under-sampling the majority class (majority instances) [3, 5].
Solutions at the algorithmic level: these solutions try to adapt existing classifier learning algorithms to bias towards the small class, such as [4, 6].
2. 2. Evaluation Measures Evaluation measures have a fundamental role in the classification. To evaluate the performance of classifiers, the most direct way is an analysis based on the confusion matrix. In a binary class, samples can be divided into four groups after a classification process [9]. Accuracy is the most commonly used measure for these purposes:
). (
)
(TP TN TP FP TN FN
Accuracy (1)
However, to classify the class imbalance problem, accuracy does not distinguish between the number of correct labels of different classes. Thus, instead of using accuracy, more suitable metrics are taken into account. One appropriate metric that could be used to measure the performance of classification over imbalanced datasets is AUC:
2 ) 1
( TPrate FPrate
AUC (2)
where TPrate is the percentage of positive cases that is
correctly predicted to be positive and FPrate the
percentage of negative cases that is incorrectly predicted to be positive.
3. PROPOSED METHOD: COST SENSITIVE FUZZY RULE BASED IMBALANCED CLASSIFIER (CS-FRBIC)
We know that it is more difficult to label data which is close to the boundaries than data located far away from them. Therefore, the proposed method finds the examples whose classification is difficult. Amongst them, the minority examples are chosen and their cost will be changed. These costs are used in the weighting formula of fuzzy rule-based classifier. Finally, lateral tuning can be applied to obtain a more accurate model.
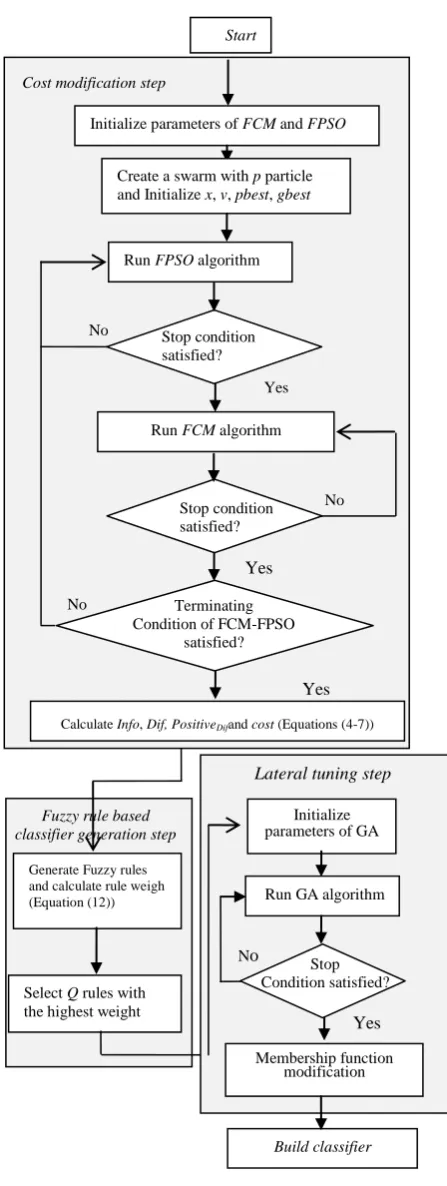
As shown in Figure 1, our proposed research framework consists of some steps. In the first step, FCM-FPSO [10] is used to cluster the training data and to find the difficult instances. Then, the variable costs of minority instances are modified. In the second step, the fuzzy rule base classifier is generated. In the final step, lateral tuning of the involved membership functions is employed. In the following sections, each step is described in detail.
3. 1. Step1: Cost Modification In this phase, the misclassification cost of minority samples is computed. In most works, if a dataset has k classes, the cost matrix is k×k [11-13]. In these works, if a minority sample is misclassified as a majority one, the associated misclassification cost is a constant number such as Imbalanced Ratio (IR is defined as the ratio of the number of instances of the majority class to the minority class); this penalty is the same for all minority samples. In our method, binary datasets are used, but the cost matrix is not a 2×2 matrix (it is an n×2 matrix: n is the number of instances). To obtain this matrix, first the difficult minority samples are found and then their cost is just changed. The cost of misclassification of the rest of samples is 1.
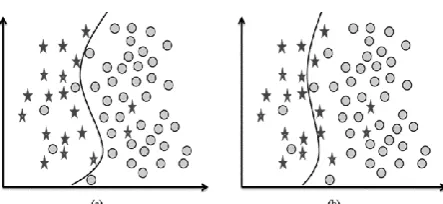
Figure 2 illustrates the borderline (Figure 2(b)) and difficult samples (in terms of imbalanced classification) of a binary dataset (Figure 2(a)). If an example is close to the decision boundary of a class, classification may be difficult, and if an example is far away from the decision boundary of a class, may be easy to classify. The classification difficulty degree of an example which is regarded as its distribution characteristic may be expressed by some metric information measuring its degree of closeness to decision boundaries (it is correct for imbalanced classification).
If our method can predict the difficult minority samples correctly, better classifiers will be built and more minority samples will be predicted correctly (see Figure 3(a)). If difficult minority samples are misclassified, the decision region generated by the algorithm is close to those instances. Consequently, the instances that belong to the minority classes are misclassified more often than those belonging to the
majority class (Figure 3 (b)). Figure 1. The framework of proposed method
Lateral tuning step
Initialize parameters of GA
Run GA algorithm
Membership function modification
Stop Condition satisfied?
Build classifier No
Yes Initialize parameters of FCM and FPSO
Create a swarm with p particle and Initialize x, v, pbest, gbest
Run FPSO algorithm
Run FCM algorithm
Calculate Info, Dif, PositiveDifand cost (Equations (4-7))
Terminating Condition of FCM-FPSO
satisfied? Yes
Yes No
Start
No Cost modification step
Yes No
Stop condition satisfied? Stop condition satisfied?
Generate Fuzzy rules and calculate rule weigh (Equation (12))
Select Q rules with the highest weight
Fuzzy rule based classifier generation step
Figure 2. (a) Difficult samples. (b) Borderline samples
Figure 3. (a) Classifying the difficult minority samples correctly. (b) Misclassifying the difficult minority samples
Cost-sensitive learning algorithms associate high misclassification costs for minority instances which misguide the search towards the minority class. If the cost associated with minority instances is too high, or if the specific cost-sensitive algorithm is easily biased towards the minority class, it can be observed that the decision region generated by the algorithm is far away from those instances. Therefore, it is needed to bias those algorithms in a way that they push the boundary towards the minority instances, but still classify both classes correctly. On the other hand, cost-sensitive solutions seek to minimize the high cost errors. So, if the algorithm associates high misclassification costs for the difficult minority instances rather than other minority instances, misclassification probability of these instances will decrease and therefore the final classifier will be more accurate.
Even in the cases that there are clear boundaries among the labeled data of different classes, data in the same class still has some characteristics representing its degree of proximity to the class boundaries. It is easy to understand that the characteristic of a data point located far away from the class boundaries is different from that of a data point located near the class boundaries. Thus, the difficulty degree of classification for each training sample can be defined by a fuzzy measure. For the sake of assigning a degree of difficulty to each training sample near the class boundary, it is necessary to have a suitable metric for measuring this difficulty for each pattern. One suitable way that is proposed in this
research is to fuzzify the boundary region of classification via an optimal fuzzy clustering approach. Thus, to find difficult samples, clustering the training data is employed and the degrees of membership are computed for each sample. Then, the concept of entropy is utilized to find the classification difficulty degree of an example [14].
To cluster the training data, an optimal fuzzy clustering method named FCM-FPSO is applied; parameter settings and terminating conditions are originally taken from the recommendations given in Izakian’s paper [10]. The output of the algorithm (X) indicates the membership degree of each instance to clusters (classes).
}. ,..., 1 and ,..., 1 |
{ i n j c
X ij (3)
µij represents the membership degree of ith sample (xi)
with respect to class j. n and c are the number of samples and classes respectively. The fuzzy memberships of a training instance represent the degree which the instance belongs to different classes. If an instance can be easily labeled, its membership degree to a class is one and that to another class is zero. If it is difficult to classify, the instance may be close to the class boundaries. In this case, its membership degree to different classes has a non-zero value. After calculating fuzzy memberships, we employ the concept of entropy to characterize the difficulty of each training instance and to calculate its fuzzy information [14]:
ij c
j ij i
x
Info
2 1 log )
(
(4)If Info(xi) is a value close to zero, xi can be labeled
easily. If Info(xi) > 0.9, xi is defined as a sample which
is difficult to be labeled, the set of difficult samples for labeling is called Dif and is defined as follows:
}. 9 . 0 ) ( |
{
xi Infoxi
Dif (5)
The set of difficult minority instances is defined as follows:
}. ) ( and |
{
j j j
Dif x x Dif classx
Positive (6)
And finally, the costs of this set are calculated. So, a novel cost metric is utilized to change the misclassification cost of minority instances according to the following equation:
Dif i
i c c c IR x Positive
x) . . , cost( 3
3 2
1 (7)
wherec1, c2, c3 are the concept of entropy, Gini index
c
j ij ij
c1 1 log2 . (8)
c
j ij
c 1 2
2 1 . (9)
.
2 1
3
c j ij
c (10)
3. 2. Step2: Fuzzy Rule Based Classifier Generation In this work, fuzzy rule-based classification systems are used, because they are flexible and useful structures.
A simple approach for generating fuzzy rules is to partition the domain interval of each input attribute using a pre-specified number of fuzzy sets. In this paper, 14 possible linguistic terms for each attribute are defined, as shown in Figure 4 [16].
Furthermore, the fuzzy system also uses “don’t care” as an additional linguistic term which indicates that the variable matches any input value with maximum matching degree (don'tcare(x)1). The fuzzy rule base determines the relationship among the variables and establishes an association between the space of features and classes.
Given a partitioning of pattern space, one approach (to construct a rule-base) is to consider all possible combinations of antecedent to generate the fuzzy rules. That is, for each attribute, one of the 14 fuzzy sets shown in Figure 4 and “don’t care” can be used when generating a fuzzy rule. The trick is to consider all antecedent combinations (which is 15n for n -dimensional problem). The number of rules generated with this scheme can be quite large. So, to construct a rule-base for each dataset used in this paper, first each attribute of the problem is normalized into a real number in the interval [0, 1] before extracting fuzzy rules. Then, fuzzy rule base of our FRBCS is generated by means of the following steps:
First, N rules are generated (N is the number of instances). To generate a fuzzy rule for an instance
: ) , ,...., ( p1 pn p
p x x C
x
Figure 4. Four fuzzy partitions for each attribute membership function
Compute the matching degree µ(xpi) of the example
to the different fuzzy regions. Then, calculate the following degree for each attribute:
14
1 ( ), 1,...,14. )
( )
(BK B xpi j B xpi k
P
j
k
(11)
Bk represents the kth membership function (see
Figure 4).
Assign the xpi to the fuzzy region with the greatest
P(Bk). Then, each antecedent fuzzy set of the
generated fuzzy rule replaced with don’t care if
P(Bk) < 0.23.
Generate a rule for the example, whose antecedent is determined by the selected fuzzy region and whose consequent is the label of class of the example. In FRBCS, rule weighting has often been used as a
simple mechanism to tune the classifier. Compute the rule weight [17] by:
) ( )
(
) ( )
(
1 1
m
p A p p C
x A p p
m
p A p p C
x A p p
j
CS x CS
x
CS x CS
x PCF
CS
j j
p j
j j
p j
(12)
where CSp is the misclassification cost of xp.
A compact rule base can be constructed in the following manner. The generated rules are divided into two groups according to their consequent classes. The rules in each group are sorted in descending order of rule weighting criterion (Equation (12)). Finally, Q rules with the highest weight from each group are selected; they construct our fuzzy rule-based classifier.
3. 3. Step3: Lateral Tuning The aim of this step is to improve the performance of FRBCSs using a post-processing genetic tuning step. The GA is considered to tune a compact set of fuzzy classification rules with high values of CS-PCF obtained in the previous stage. Then, the lateral displacement of labels, considering only one parameter, is performed based on reference [18]. In this way, membership functions (MFs) achieve a better covering degree while maintaining the original shapes; it results in accuracy improvement without a significant loss in interpretability of fuzzy labels. In other words, the fuzzy partition is adopted to solve this problem in an optimal way through an evolutionary tuning in which the lateral position of the linguistic labels is handled.
A set of labels S represents a fuzzy partition and )
5 . 0 , 5 . 0 [
i
. αi expresses the bounds of the domain of
Figure 5. Lateral displacement of a membership function
The tuning of the membership function parameters can be considered a search problem to which GAs can be applied. In this algorithm, each gene represents modification of the membership function parameters. Length of a chromosome is equal to the number of labels and shows the lateral displacement of labels. To evaluate each chromosome, the modifications to the membership function parameters are first applied and the training data is then classified. After that, the following metric is utilized to calculate fitness function:
np
j j
AUC
fit (1 ) 1cost . (13)
where costj represents the misclassification cost of xj
and np is the number of misclassified training data. The GA tries to minimize the misclassification cost. Therefore, a chromosome with the lowest fitness is selected. Ten independent runs are considered to produce the results.
4. EXPERIMENTAL STUDY
In this study, our aim is to show the improvement achieved in FRBCS by combining cost-sensitive and lateral tuning models. In the following sections, the datasets available in the literature are first introduced so as to carry out the experimental study. Then, we will conduct an analysis to determine the performance of different cost-sensitive approaches used for imbalanced classification.
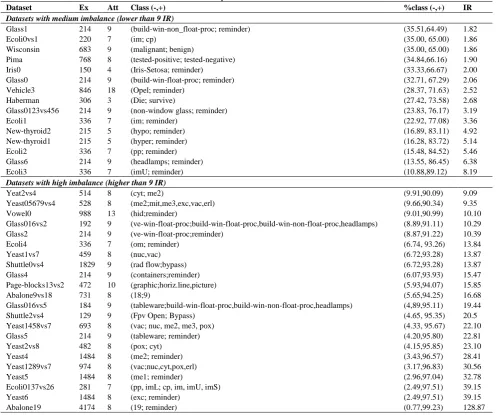
4. 1. Datasets and Parameters In order to analyze the CS-FRBIC method against some cost-sensitive learning algorithms, 37 datasets from KEEL dataset repository are employed. In this work, different datasets with different degree of IR are used: medium imbalance and highly imbalance. Table 1 summarizes the properties of the selected datasets. This table denotes, for each dataset, the number of examples (Ex), number of attributes (Att), class name, class distribution and Imbalanced Ratio (IR).
The 5-fold cross validation model is employed to carry out different experiments, the combination of 4 of
them as training and the remaining ones for testing. For each dataset, the average of test accuracies in the five partitions is considered. The datasets used in this study use the partitions provided by the keel repository in the imbalanced classification dataset section. Table 2 shows the parameters for the implementation of the algorithms employed in the proposed method.
4. 2. Performance Analysis and Comparison In this section, the set-up of experimental framework used is presented to develop the analysis of our proposal. First, the performance of CS-FRBIC method on medium imbalanced datasets is checked. Then, in order to analyze the quality of our approach against the algorithms used in comparison, the experiments on highly imbalanced datasets are performed.
4. 2. 1. Analysis of Proposed Method on Medium Imbalanced Datasets The following part of the study considers the performance of the proposed method (CS-FRBIC) in contrast with other cost-sensitive learning proposals. Table 3 shows the average AUC results in training and test for the medium imbalanced data-sets considered.
By rows, we can observe the results for the CS-C4.5 [20], CS-SVM [21], CS-FH-GBML [17], CS-3NN [22], CS-MLPNN [23], CS-AdaC2 [9, 24], FRBIC (proposed method without performing cost modification (step2+step3)), CS-FRBICwl (proposed method without performing lateral tuning (step1+step2)) and the CS-FRBIC method. The best average case in test is highlighted in bold.
The results in these tables for CS-FH-GBML and 3-NN methods are extracted from Lopez’s paper [4] and for CS-AdaC2 method is obtained from [24]. The results for CS-C4.5, CS-SVM and CS-MLPNN are extracted from KEEL Software.
The results in Table 3 show that the proposed method achieves the highest average in most datasets. Our results clearly show that the use of the proposed cost method implies a higher performance for the FRBCS in imbalanced datasets.
4. 2. 2. Analysis of Proposed Method on Highly Imbalanced Datasets The following part of the study considers the performance of the CS-FRBIC method in contrast to other cost-sensitive learning and FRBCSs learning methods. Table 4 shows the results of performance (using the AUC metric) of the CS-FRBIC method and the algorithms employed for comparison; that is, the C4.5, SVM, FH-GBML, CS-3NN, CS-MLPNN, CS-AdaC2, GP-COACH9 (the basic GP-COACH method with 9 labels) [25], GP-COACH-H [26], GA-FS+GL [27], FRBIC and CS-FRBICwl; AUCTr (the AUC over the training data-set) and AUCTst
TABLE 2. Parameter specification for the algorithms employed in the proposed method.
Algorithms Parameters
FCM-FPSO
Initialization = randomly population size = 50 K=10
Vmin = -7 Vmax = 7 C1,C2 = 2 Wmin = 0.1
GA
Wmax = 0.9
number of iteration (FPSO) =100 number of iteration (FCM) =3 number of iteration (FCM-FPSO) =100 population size = 70
Mutation probability = 0.001 Crossover probability = 0.75 number of iteration = 100
TABLE 3. Average results for our method and other cost-sensitive methods for the medium imbalanced datasets
AUCTst AUCTr Algorithms 0.8564 0.9347 CS- C4.5 0.7998 0.8106 CS-SVM 0.8544 0.9159 CS-FHGBML 0.8190 0.8191 CS-3NN 0.8106 0.8211 CS-MLPNN 0.8556 0.8567 CS-AdaC2 0.8135 0.8348 FRBIC 0.8724 0.8860 CS-FRBICwl 0.8937 0.9004 CS-FRBIC
TABLE 1. Summary of imbalanced datasets
IR %class (-,+) Class (-,+) Att Ex Dataset
Datasets with medium imbalance (lower than 9 IR)
1.82 (35.51,64.49) (build-win-non_float-proc; reminder) 9 214 Glass1 1.86 (35.00, 65.00) (im; cp) 7 220 Ecoli0vs1 1.86 (35.00, 65.00) (malignant; benign) 9 683 Wisconsin 1.90 (34.84,66.16) (tested-positive; tested-negative) 8 768 Pima 2.00 (33.33,66.67) (Iris-Setosa; reminder) 4 150 Iris0 2.06 (32.71, 67.29) (build-win-float-proc; reminder) 9 214 Glass0 2.52 (28.37, 71.63) (Opel; reminder) 18 846 Vehicle3 2.68 (27.42, 73.58) (Die; survive) 3 306 Haberman 3.19 (23.83, 76.17) (non-window glass; reminder)
9 214 Glass0123vs456 3.36 (22.92, 77.08) (im; reminder) 7 336 Ecoli1 4.92 (16.89, 83.11) (hypo; reminder) 5 215 New-thyroid2 5.14 (16.28, 83.72) (hyper; reminder) 5 215 New-thyroid1 5.46 (15.48, 84.52) (pp; reminder) 7 336 Ecoli2 6.38 (13.55, 86.45) (headlamps; reminder) 9 214 Glass6 8.19 (10.88,89.12) (imU; reminder) 7 336 Ecoli3
Datasets with high imbalance (higher than 9 IR)
9.09 (9.91,90.09) (cyt; me2) 8 514 Yeat2vs4 9.35 (9.66,90.34) (me2;mit,me3,exc,vac,erl) 8 528 Yeast05679vs4 10.10 (9.01,90.99) (hid;reminder) 13 988 Vowel0 10.29 (8.89,91.11) (ve-win-float-proc;build-win-float-proc,build-win-non-float-proc,headlamps) 9 192 Glass016vs2 10.39 (8.87,91.22) (ve-win-float-proc;reminder) 9 214 Glass2 13.84 (6.74, 93.26) (om; reminder) 7 336 Ecoli4 13.87 (6.72,93.28) (nuc,vac) 8 459 Yeast1vs7 13.87 (6.72,93.28) (rad flow;bypass) 9 1829 Shuttle0vs4 15.47 (6.07,93.93) (containers;reminder) 9 214 Glass4 15.85 (5.93,94.07) (graphic;horiz.line,picture) 10 472 Page-blocks13vs2 16.68 (5.65,94.25) (18;9) 8 731 Abalone9vs18 19.44 (4,89,95.11) (tableware;build-win-float-proc,build-win-non-float-proc,headlamps) 9 184 Glass016vs5 20.5 (4.65, 95.35) (Fpv Open; Bypass)
9 129 Shuttle2vs4
22.10 (4.33, 95.67)
(vac; nuc, me2, me3, pox) 8 693 Yeast1458vs7 22.81 (4.20,95.80) (tableware; reminder) 9 214 Glass5 23.10 (4.15,95.85) (pox; cyt) 8 482 Yeast2vs8 28.41 (3.43,96.57) (me2; reminder) 8 1484 Yeast4 30.56 (3.17,96.83) (vac;nuc,cyt,pox,erl) 8 974 Yeast1289vs7 32.78 (2.96,97.04) (me1; reminder) 8 1484 Yeast5 39.15 (2.49,97.51)
TABLE 4. Average results for our method and other cost-sensitive methods for the highly imbalanced datasets
AUCTst AUCTr
Algorithms
0.8029
0.9809
CS- C4.5
0.7521 0.7703
CS-SVM
0.8227 0.9300
CS-FHGBML
0.8221 0.8129
CS-3NN
0.6782 0.6875
CS-MLPNN
0.7910 0.7983
CS-AdaC2
0.7936 0.8910
GP-COACH-9
0.8020 0.9050
GP-COACH-H
0.8106 0.8412
GA-FS+GL
0.7793 0.8631
FRBIC
0.8428 0.8771
CS-FRBICwl
0.8627
0.8928 CS-FRBIC
In these tables, in these tables, the results for CS-FH-GBML and 3-NN methods are extracted from Lopez’s papers [4] and for CS-AdaC2 are obtained from [24]. The results for GA-FS+GL are obtained from its original papers [27]. The results for CS-C4.5, CS-SVM and CS-MLPNN are extracted from KEEL Software. Observing the table of average results, it is obvious that our method has the best average results. It means that our method is the best performing FRBCS in highly imbalanced datasets.
5. CONCLUSIONS
In this paper, we discussed a challenging and critical problem in knowledge discovery and data engineering fields: the imbalanced learning problem. Our aim was to obtain an accurate and compact fuzzy rule based classifier with a low computational cost.
A novel framework was presented to design cost-sensitive FRBCS algorithms. The framework was based on the identification of difficult instances and cost modification of minority ones. An entropy-based concept was utilized to detect the difficult instances and to give the cost to them. This measure was calculated after performing an accurate fuzzy clustering using FPSO.
In the following part, the contributions of this paper are listed so as to produce a novel cost-sensitive FRBCS algorithm:
Finding difficult minority samples and just changing their cost. The misclassification cost of the remaining samples is 1. But in previous works, if a minority sample was misclassified as a majority one, the associated misclassification was a constant number such as IR and this penalty was the same for all minority samples.
Applying fuzzy versions of Gini index and DKM criterion to calculate the final cost functions.
Defining novel cost function and matrix according to the geometric mean of entropy, Gini index and DKM criterion.
Utilizing a new fitness function in the lateral tuning phase by GA (i.e. Equation (13)).
The results of this methodology represent more superior results over others in almost all datasets. Performance of this method was also compared to those of various previous cost-sensitive approaches.
6. REFERENCES
1. Tong, L.-I., Chang, Y.-C. and Lin , S.-H., Determining the optimal re-sampling strategy for a classification model with imbalanced data using design of experiments and response surface methodologies, Expert Systems with Applications, Vol. 38, (2011), 4222-4227.
2. Fernández , A., del Jesus, M. J. and Herrera, F., On the influence of an adaptive inference system in fuzzy rule based classification systems for imbalanced data-sets, Expert Systems with Applications, Vol. 36, (2009), 9805-9812.
3. Tahir, M. A, Kittler, J. and Yan, F., Inverse random under sampling for class imbalance problem and its application to multi-label classification, Pattern Recognition, Vol. 45, (2012), 3738-3750.
4. López, V., Fernández, A., Moreno-Torres, J. G. and F. Herrera, Analysis of preprocessing vs. cost-sensitive learning for imbalanced classification. Open problems on intrinsic data characteristics, Expert Systems with Applications, Vol. 39, (2012), 6585-6608.
5. Yu, H., Ni J. and Zhao J., ACOSampling: An ant colony optimization-based undersampling method for classifying imbalanced DNA microarray data, Neurocomputing , Vol. 101, (2013), 309-318.
6. Mahdizadeh, M. and Eftekhari, M., Generating Fuzzy Rule Base Classifier for Highly imbalanced datasets using a hybrid of Evolutionary Algorithms and Subtractive Clustering, Journal of Intelligent & Fuzzy Systems, Vol. 27, (2014), 3033-3046. 7. Alcalá, J., Fernández, A. , Luengo, J., Derrac, J., García, S.,
Sánchez, L. and Herrera, F., KEEL data-mining software tool: Data set repository, integration of algorithms and experimental analysis framework, Journal of Multiple-Valued Logic and Soft Computing, Vol. 17, (2010), 255-287.
8. Yen, S.-J. and Lee, Y.-S., Cluster-based under-sampling approaches for imbalanced data distributions, Expert Systems with Applications, Vol. 36, (2009), 5718-5727.
9. Sun, Y., Kamel, M. S., Wong, A. K. and Wang, Y., Cost-sensitive boosting for classification of imbalanced data, Pattern Recognition, Vol. 40, (2007), 3358-3378.
10. Izakian, H. and Abraham, A., Fuzzy C-means and fuzzy swarm for fuzzy clustering problem, Expert Systems with Applications,
Vol. 38, (2011), 1835-1838.
11. Zhang, S., Decision tree classifiers sensitive to heterogeneous costs, Journal of Systems and Software, Vol. 85, (2012), 771-779.
12. Kim, J., Choi, K., Kim, G. and Suh, Y., Classification cost: An empirical comparison among traditional classifier, Cost-Sensitive Classifier, and MetaCost, Expert Systems with Applications, Vol. 39, (2012), 4013-4019.
14. Zhang, H. and Lu, J., Creating ensembles of classifiers via fuzzy clustering and deflection, Fuzzy Sets and Systems, Vol. 161, (2010), 1790-1802.
15. Berry, M. J. and Linoff, G., Data mining techniques: for marketing, sales, and customer support: John Wiley & Sons, Inc. (1997).
16. Ishibuchi, H. and Yamamoto, T., Fuzzy rule selection by multi-objective genetic local search algorithms and rule evaluation measures in data mining,Fuzzy Sets and Systems, Vol. 141, (2004), 59-88.
17. López, V., Fernández, A. and Herrera, F., A first approach for cost-sensitive classification with linguistic genetic fuzzy systems in imbalanced data-sets, in 10th International Conference on Intelligent Systems Design and Applications (ISDA), (2010), 676-681.
18. Alcalá-Fdez, J., Alcala, R. and Herrera, F., A fuzzy association rule-based classification model for high-dimensional problems with genetic rule selection and lateral tuning, IEEE Transactions on Fuzzy Systems, Vol. 19, (2011), 857-872. 19. Sanz, J., Fernández, A., Bustince, H. and Herrera, F., A genetic
tuning to improve the performance of Fuzzy Rule-Based Classification Systems with Interval-Valued Fuzzy Sets: Degree of ignorance and lateral position, International Journal of Approximate Reasoning, Vol. 52, (2011), 751-766.
20. Ting, K. M., An instance-weighting method to induce cost-sensitive trees, IEEE Transactions on Knowledge and Data Engineering, Vol. 14, (2002), 659-665.
21. Tang, Y., Zhang, Y.-Q., Chawla, N. V. and Krasser., S., SVMs modeling for highly imbalanced classification, IEEE
Transactions on Systems, Man, and Cybernetics, Part B: Cybernetics, Vol. 39, (2009), 281-288,.
22. Hand, D. J. and Vinciotti, V., Choosing k for two-class nearest neighbour classifiers with unbalanced classes, Pattern Recognition Letter, Vol. 24, (2003), 1555-1562.
23. Zhou, Z.-H. and Liu, X.-Y., Training cost-sensitive neural networks with methods addressing the class imbalance problem,
IEEE Transactions on Knowledge and Data Engineering, Vol. 18, (2006), 63-77.
24. Galar, M., Fernandez, A., Barrenechea, E., Bustince, H. and Herrera, F., A Review on Ensembles for the Class Imbalance Problem: Bagging-, Boosting-, and Hybrid-Based Approaches,
IEEE Transactions on Systems, man and Cybernetics- Part C: Application and Reviews, Vol. 42, (2011), 463-484.
25. Berlanga, F. J., Rivera, A., del Jesús, M. J. and Herrera, F., GP-COACH: Genetic Programming-based learning of COmpact and ACcurate fuzzy rule-based classification systems for High-dimensional problems, Information Science, Vol. 180, (2010), 1183-1200.
26. López, V., Fernández, A., Jesus, M. J. D. and Herrera, F., A hierarchical genetic fuzzy system based on genetic programming for addressing classification with highly imbalanced and borderline data-sets, Knowledge-Based Systems, Vol. 38, (2013), 85-104.
27. Villar, P., Fernández, A., Carrasco, R. A. and Herrera, F., Feature Selection and Granularity Learning in Genetic Fuzzy Rule-Based Classification Systems for Highly Imbalanced Data-Sets, International Journal of Uncertainty, Fuzziness and Knowledge-Based Systems, Vol. 20, (2012), 369-397.
A Novel Cost Sensitive Imbalanced Classification Method based on New Hybrid
Fuzzy Cost Assigning Approaches, Fuzzy Clustering and Evolutionary Algorithms
M. Mahdizadeh, M. Eftekhari
Department of Computer Engineering, Shahid Bahonar University of Kerman, Kerman, Iran
P A P E R I N F O
Paper history: Received 20April 2015
Received in revised form 10June 2015 Accepted 30 July2015
Keywords:
Cost Sensitive Learning Fuzzy Clustering
Fuzzy Rule-based Classification Systems Evolutionary Algorithms
Lateral Tuning
ديكچ ه
هنیزه رایعم زین و هنیزه هب ساسح نوناقرب ینتبم متسیس کی یحارط یارب یدیدج یبیکرت شور ،هلاقم نیا رد یدیدج ی
،یپورتنا موهفم هس بیکرت ساسارب
Gini index
و
DKM
هنیزه هبساحم روظنم هب .تسا هدش داهنشیپ ی
زا ،اهوگلا رثوم
هشوخ بیکرت یدنب
FCM
و
PSO
هنومن متیروگلا نیا .تسا هدش هدافتسا هنیزه و هدرک ییاسانش ار راوشد یاه
یدنب هقبط ی
نآ هابتشا یم هبساحم یداهنشیپ رایعم زا هدافتسا اب ار اه نینچمه .دنک
، عباوت یبناج یزاس نازیم زا یدنب هقبط ییاراک دوبهب یارب
ب اب تیوضع ه کیتنژ متیروگلا یریگراک یم هدافتسا
هب ساسح متیروگلا نیدنچ اب یداهنشیپ شور ییاراک تیاهن رد و دوش
یور رب شیامزآ .تسا هدش هسیاقم رگید هنیزه
73
زا هداد هعومجم
KEEL
رایعم و لامعا
AUC
ب جیاتن یبایزرا یارب ه
راک
یم ناشن جیاتن .تسا هدش هتفرگ شور رگید هب تبسن یداهنشیپ شور هک دهد
م دروم یاه رادروخرب یرتهب درکلمع زا هسیاق
.تسا