EVALUATION OF FORMING SEVERITY AND THICKNESS
VARIATION IN DEEP DRAWING PROCESS
A. Assempour and A. Fathi
Department of Mechanical Engineering, Center of Excellence in Design Robotics and Automation, Sharif University of Technology
Tehran, Iran, [email protected]
(Received: May 25, 2002 – Accepted in Revised Form: February 9, 2003)
Abstract This paper presents a new methodology for complete solution of general shape deep drawn parts. Evaluation of forming severity, estimation of the punch load and prediction of the thickness variation are the major results obtained in this work. The punch work is the summation of the homogenous work of flange deformation and bending and frictional works. To evaluate the strain energy of the flange, the so-called matrix method of slip line is used. To overcome the weakness of slip line field in prediction of the thickness variation, the so-called genetic algorithm has been adopted. In this procedure, the actual velocity field has been computed and used in energy formulation. The predicted thickness strain, punch load and forming severity have been compared with some published experimental results.
Keywords Deep Drawing, Slip Line Field, Matrix Method, Forming Severity, Bending Model, Genetic Algorithm
ﻩﺪﻴـﻜﭼ
ﻩﺪﻴـﻜﭼ
ﻩﺪﻴـﻜﭼ
ﻩﺪﻴـﻜﭼ
ﻩﺪﻳﺩﺮﮔﻪﺋﺍﺭﺍﻲﻣﻮﻤﻋﻞﻜﺷﺎﺑﺕﺎﻌﻄﻗﻖﻴﻤﻋﺶﺸﻛﻞﻣﺎﻛﻞﻴﻠﺤﺗﻱﺍﺮﺑﺪﻳﺪﺟﻲﺷﻭﺭﻪﻟﺎﻘﻣﻦـﻳﺍﺭﺩ
ﺖـﺳﺍ .
ﻦﻳﺍﺭﺩﻩﺪﻣﺁﺖﺳﺪﺑﺞﻳﺎﺘﻧﻦﻳﺮﺘﻤﻬﻣﺯﺍﺖﻣﺎﺨﺿﺕﺍﺮﻴﻴﻐﺗﻭﭻﻧﺎﭘﻱﻭﺮﻴﻧ،ﻱﺮﻳﺬﭘﺶـﺸﻛﺪـﺣﺶﺠﻨـﺳ
ﺪﻨﺷﺎﺑﻲﻣﻪﻟﺎﻘﻣ .
ﺞﻧﻼﻓﺭﺩﻦﮕﻤﻫﻞﻜﺷﺮﻴﻴﻐﺗﺭﺩﻲﻓﺮﺼﻣﻱﺎﻫﻱﮊﺮﻧﺍﻉﻮﻤﺠﻣﺯﺍ،ﭻﻧﺎﭘﻱﻭﺮﻴﻧﺭﺎﻛ ﻕﺭﻭﺶﻤﺧ،
ﺪﻳﺁﻲﻣﺖﺳﺪﺑﻙﺎﻜﻄﺻﺍﻭﺲﻳﺮﺗﺎﻣﻪﺒﻟﺭﺩ .
ﻁﻮﻄﺧﻥﺍﺪﻴﻣﺯﺍﺞﻧﻼﻓﺭﺩﻦﮕﻤﻫﻞﻜﺷﺮﻴﻴﻐﺗﻱﮊﺮﻧﺍﻪﺒﺳﺎﺤﻣﻱﺍﺮﺑ
ﺩﻮـﺷﻲـﻣﻩﺩﺎﻔﺘـﺳﺍﻲـﺴﻳﺮﺗﺎﻣﻱﺎﻫﺮـﮕﻠﻤﻋﺵﻭﺭﻭﺵﺰـﻐﻟ .
ﺭﺩﺵﺰﻐﻟﻁﻮﻄﺧﻥﺍﺪﻴﻣﺖﻳﺩﻭﺪﺤﻣﻥﺍﺮﺒﺟﻱﺍﺮﺑ
ﺩﺩﺮﮔﻲﻣﻩﺩﺎﻔﺘﺳﺍﻲﻜﻴﺘﻧﮊﻱﺯﺎﺳﻪﻨﻴﻬﺑﻢﺘﻳﺭﻮﮕﻟﺍﺯﺍ،ﺖﻣﺎﺨﺿﺕﺍﺮﻴـﻴﻐﺗﻪﺒـﺳﺎﺤﻣ .
ﻄﺑ ﺵﻭﺭﻦﻳﺍﻚﻤﻛﻪﺑﻪﻜﻳﺭﻮ
ﺩﺩﺮﮔﻲﻣﺭﻮﻈﻨﻣﻱﮊﺮﻧﺍﻂﺑﺍﻭﺭﺭﺩﻭﻪﺒﺳﺎﺤﻣﺖﻋﺮﺳﻲﻌﻗﺍﻭﻥﺍﺪﻴﻣ،ﻱﺯﺎﺳﻪﻨـﻴﻬﺑ .
ﺭﺩﻩﺪﻣﺁﺖﺳﺪﺑﺞﻳﺎﺘﻧﻥﺎﻳﺎﭘﺭﺩ
ﺪﻧﺮﻴﮔﻲﻣﺭﺍﺮﻗﻪﺴﻳﺎﻘﻣﺩﺭﻮﻣﻲﺑﺮﺠﺗﺞﻳﺎﺘﻧﺎﺑﻱﺮﻳﺬﭘﺶﺸﻛﻂﻳﺍﺮﺷﻭﭻﻧﺎﭘﻱﻭﺮﻴﻧ،ﺖﻣﺎﺨﺿﺕﺍﺮﻴﻴﻐﺗﺩﺭﻮﻣ .
1. INTRODUCTION
In modern metal stamping technology, process control plays an increasingly important role. The process control may relate to some variables such as material properties, tooling geometry, blank holder force, blank size etc. Estimating the influences of such variables on sheet metal forming processes will provide a better understanding of sheet metal formability and finally reduce the die try-out costs.
The effects of process variable have been so far investigated by many different analytical and numerical methods. Upper bound, slip line field, finite difference and the energy methods have been the most common tools during 1980’s [1-12].
Due to high-speed computers during 1990’s, the most of the numerical techniques in modeling of sheet metal forming are based on finite element method [13-17]. Dynamic, quasi static and one-step are the major finite element approaches in the commercial available software. Some of these codes are quite capable of providing the details of strain distribution and forming severity. However, general FEM analyses of three-dimensional forming processes require extensive data preparation.
user would try many iterations to optimize the process. Accordingly, the specification of the system is such that the total time required to produce an answer, including the time to input the geometry be limited to minutes, as opposed to hours (such as FEM). The methodology is based on matrix method of slip line fields (SLF) and energy method. Also an optimization technique is used for determination of the actual velocity field and ultimately gaining the thickness distribution all over the deep drawn part.
2. THEORY
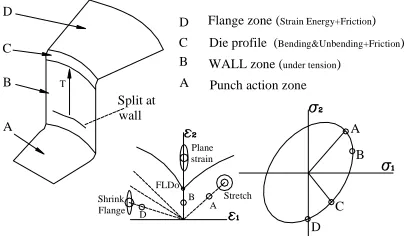
Figure 1 explains qualitatively the mechanics of deformation on a segment of a deep drawn part. The figure shows four distinct regions on the part. In the flange zone the strain energy and frictional resistance are the major sources of energy consumption. The force transmitted to the wall mainly depends on the strain energy spent for deformation at the flange region. The strain energy highly depends on the blank geometry, material properties and thickness. The bending effects and die frictional conditions are other influencing factors on the wall resistant force. With this view, the force on the wall at every stage of punch movement can be obtained by summation of the homogeneous work of deformation at the flange, the bending-unbending work at die profile and the frictional work. In such a case, the balance of energy can be obtained by the following expression:
fdu
=
∫
∫
d
dv
+
W
b+
W
f∫
(
σ ε
)
(1)Where " f " is the force required to draw the wall by the incremental distance "du", "
σ
" and "ε
" represent the caushy stress and logarithmic strain tensors currently in the flange. "W
b" is the work required for bending and unbending at the die radius. "W
f " is the contribution of the frictional work. If draw bead exists, its contributing work can be added to the total work. Once the wall resistant force is obtained, the stress value and therefore forming severitycan be evaluated.
2.1 Slip Line Field
To estimate the homogenous work at the flange area, SLF has been used. The so-called matrix operator method [6] was the base of the SLF calculation in the present work. In this technique, the radius of curvature of a slip line is expressed as a uniformly convergent double-power series. Any slip line could be represented as a column vector of the coefficients in the series expansion of its radius of curvature. For a regular net (Figure 2) used in this work, the relations are so:R
a
n
X
X
n n
n
OA T
(
)
!
α
=
α
=
α= ∞
∑
0
(2)
β
β
β
X
X
n
b
S
OBTn
n
n
=
=
∑
∞=0
!
)
(
(3)Where
R
(
α
),
S
(
β
)
are the radii of curvatures in the slip lines,X
α,
X
βare column vectors ofβ
α
,
andX
OA,
X
OB are column vectors of constant coefficient (ai) in base slip lines. For more details of these relations it can be referred to Reference 6. Once the slip line field is constructed, the velocity at any point on the blank can be computed. Also the material flow lines can be determined by assuming the major principalFlange zone (Strain Energy+Friction) Die profile (Bending&Unbending+Friction) WALL zone (under tension) Punch action zone
T
Split at wall B
D A
B Plane strain
Stretch Shrink
Flange FLDo
C D
A
A B C D
D C
B A
Figure 1. Mechanics of deformation on a segment of deep
stress direction as the flow direction. Integrating the material flow lines in the same manner reported by Reference 7 develops assuming the constant thickness and constant volume conditions, the blank.
2.2 Strain Energy
Every region between two flow lines has been divided into some quadrilateral elements with equal surface area. Knowing all the nodal coordinates, the history of strain in every element has been calculated by the method proposed by Sowerby et al. [8]. The deformation gradient F has been evaluated from the nodal positions at the initial and final configurations:dx=FdX (4)
Where X is initial nodal position, x is final nodal position and F is deformation gradient tensor.
The Cauchy-Green deformation tensor “C“ has been computed according to the following expression:
C
=
F F
T (5)Eigenvalues of “C “ are the squares of elongation
ratios, i.e.
λ λ
12,
22, which can be expressed by the following expression:λ λ1 2
2
, 2
2 11 22 11 22
12 2
c c
2
c c
2 c
= + ± −
+ (6)
The logarithmic principal surface strains are
ε ε
11,
22=
Ln(
λ λ
1,
2)
(7)For every element,
ε
has been calculated according to the components of principal strain by using the following equation:( )
(
( ))
ε = + ε +ε + ε − ε
2
3 2
2 2 1
2 2 2
2 2
r
1 + r r 1
(8)
Where, “r” is the normal anisotropy value.
Considering the stress-strain curve in the general form of:
σ
=
f( )
ε
(9)then the strain energy for material deformation between two flow lines can be determined.
2.3 Bending
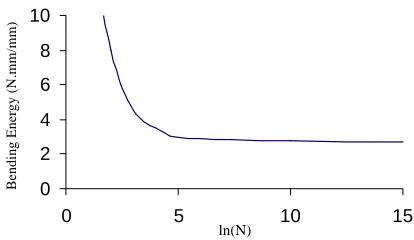
In the region of the die radius, the sheet metal undergoes bending and unbending. Figures 3 and 4 illustrate the model used in this work for computing the bending strain. Figure 3 shows the section view of the strip. In the figure the strip has been divided into some quadrilateral elements with equal surface area under the plane strain conditions. The configuration of any element that enters the die profile zone changes according to Figure 4. At the exit zone every element undergoes unbending and the element configuration changes to its original form.Knowing the nodal coordinates of every element before and after bending deformation, the bending equivalent strain energy can be calculated similar to that described for strain energy calculation in the flange zone. The strain energy calculated by this model depends on the number of elements at the bending zone. Figure 5 shows the relation between bending energy and number of elements. When the number of
elements increases, the solution converges to a specific value. Based on several numerical results, it was found that good results will be obtained when
φ ≤
+
0 05
.
R
T
(R and T are in mm). This method does not need a long computation time, because computation is done only for one element and the number of elements passing the start point at bending zone then multiplies the result.2.4 Friction
In this study, the energy contribution of friction between die, sheet and blank holder is considered according to Columb’sequation:
dwf
=
2
µAP
bhdu
(10)where “
A
” is the element surface area and “P
bh” is the blank holder pressure.The effect of coil friction at bending region is expressed as:
F
=
F e
0 µα(11)
2.5 Split
Prediction Referring to Figure 1, the splitting condition occurs on the wall under the plane strain mode.For a material having a work-hardening characteristic
σ
=
K B
(
+
ε
)
n the effective strain and stress at the instability condition can be expressed by [9]:(
r
)
n
B
r
i
−
+
+
=
0.52
1
1
ε
(12)(
)
(
)
ni
B
r
r
K
ε
σ
+
+
+
=
0.52
1
1
(13)
Also the wall thickness “t” can be expressed according to the initial thickness “
t
0” by:t
=
t e
i 0ε
(14)
Figure 3. The plane strain strip bending model.
Figure 4:The element deformation in bending area.
0 2 4 6 8 10
0 5 10 15
ln(N)
Bending Energy (N.mm/mm)
Figure 5. Bending energy converges to a single value with
With this view, the nominal stress “
σ
n” required for instability under plane strain can be expressed by:0
t
t
i
n
σ
σ =
(15)2.6 Thickness
Estimation In the preceding section, because of the plane strain assumption, we were not able to judge about thickness variation during the deformation process. However, the importance of prediction of thickness variation is as important as the forming severity prediction. To complete our theoretical work, a special methodology was adopted in prediction of thickness changes. In this methodology the so-called genetic algorithm was used for estimation of the velocity field and the thickness strains. More details are discussed below. Consider a strip of sheet that is bounded with two metal flow line. If the actual velocity field is known all over this two flow lines, we can predict the new position of each point after ∆tseconds. Then with discretizing this strip into finite number of elements we can use the methodology described in section 2.2 to compute strain energy, force and thickness variations.To evaluate the thickness variation, the actual velocity field is estimated according to the following expressions:
nonlinear linear v v
v= + (16)
B A linear (1 )v v
v = −ξ +ξ (17)
= πξ ξ
+ ⋅⋅ ⋅ + ξ + ξ +
= A
k k 2
2 1 0
nonlinear (a a a a )sin(2 )v
v
A k
0 i
i
i )sin( 2 )v
a
(
∑
ξ πξ=
(18)
A B
A
s s
s s
− − =
ξ (19)
“A” is a point in the entrance of die and “B” is in the blank edge. The magnitudes of
v
A are known (has a relation with punch speed) but the values ofB
v
anda
0−
a
k are unknown. These parameters must be so chosen to result the minimum of strain energy. For such optimization the genetic algorithm [10] has been adopted.3. Numerical
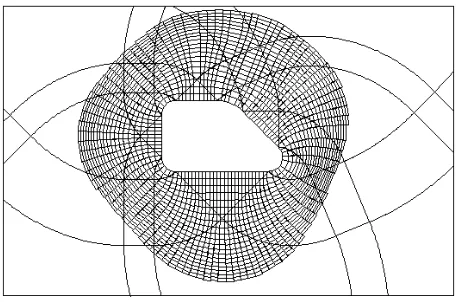
Work Based on the preceding descriptions, a general-purpose program was developed for construction of the slip lines and material flow lines. Figure 6 displays the results of the program for a polygon die cavity .The blankFigure 6. Blank development and mesh generation for a
polygon die cavity.
Figure 7. The mesh generation in a predefined rectangular
edge is computed for increments of punch movement in such a way that constructs quadrilateral elements with equal area between every pair of flow lines. Also as shown in Figure 7, integration can be carried out up to a predefined blank edge (user defined blank). Figure 7 displays the results of blank development and construction of quadrilateral elements for a prescribed rectangular blank shape in the polygon shell.
Based on discussion in section 2.2, at every increment of the punch movement, the strain energy between two flow lines is calculated according to the following expression:
W
h=
∫
∑
=
f
d
V
i n
i
( )
ε ε
ε ε
1 2
1
∆
(20)Where “
∆
V
” is the element volume and “n” is the number of elements between two material flow lines during the punch stroke.According to Equation 1, punch force is computed by equating the internal and external works. Summation of strain, friction and bending energies gives an equivalent TABLE 1. Mechanical Properties of the Sheet Material.
Material n K
(MPa) r Sheet Thickness (mm) DD HS BR 0.18 0.18 0.42 547 1059 895 1.65 0.95 0.85 0.70 0.70 0.70
TABLE 2. Tooling Parameters.
P unc h pr of ile ra dius ( m m ) D ie pr of ile ra dius ( m m ) P unc h d iam et er(m m ) Di e d iam et er
(mm) Blan
k d iam et er (mm)
13.5 1005 102.5 200
0 20 40 60 80 100
0 20 40 60 80 100
Punch Depth (mm) (a) Punch Force Experiment Model 0 20 40 60 80 100
0 20 40 60 80
Punch Depth (mm ) (b) Punch Force Experiment Model 0 40 80 120 160 200
0 10 20 30 40 50
Punch Depth (mm) (c)
Punch Force
Experiment
Model
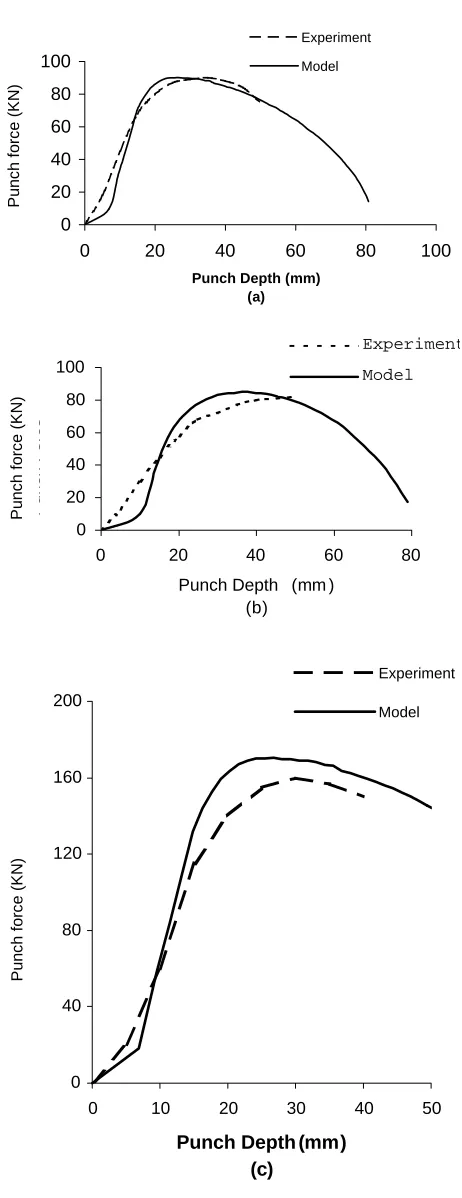
Figure 8. Comparison between theoretical and experimental
results of punch force for: (a) DD, (b) Brass and (c) HS.
horizontal force (
F
eq0) for every strip of sheet between two metal flow lines:F
W
W
W
U
eq
h b f
p 0
=
+
+
(
)
(21)
At die profile zone, displacement of this force is equal to the punch movement. “
F
eq0” is computed in the entrance of die profile radius. When the strip passes the die profile zone, the effect of coil friction must be added:F
eq=
F e
eq0 ( 2 ) µπ(22) TABLE 3. Tool Geometry for Deep Drawing of Square
Sheet.
Punch Siz
e
Punch Corner Radius Punch Profile Radius Die C
av
ity
D
ie C
o
rner
Radius Die P
rofile
Radius
Square 38.1x38.1 4.75 4.75 40.6x40.6 4.75 6.35
TABLE 4. Material Properties for Deep Rawing Square
Sheet.
Material
K
0(MPa)
ε
0ε
&
0 n m rEIDQ 620.6 0.19
2.78 × −
104 0.5 0.0067 1.0
0 10 20 30 40
0 10 20 30 40 50 60
Percentage of Side Cut -off (a)
Maximum Punch Force
Experiment Model
0 10 20 30
0 10 20 30 40 50 60
Percentage of Side Cut -off (b)
Maximum Punch Force
Experiment
Model
0 10 20 30 40
0 10 20 30 40 50 60
Percentage of Side Length Cut -off (c)
Maximum Punch Force
Experiment Model
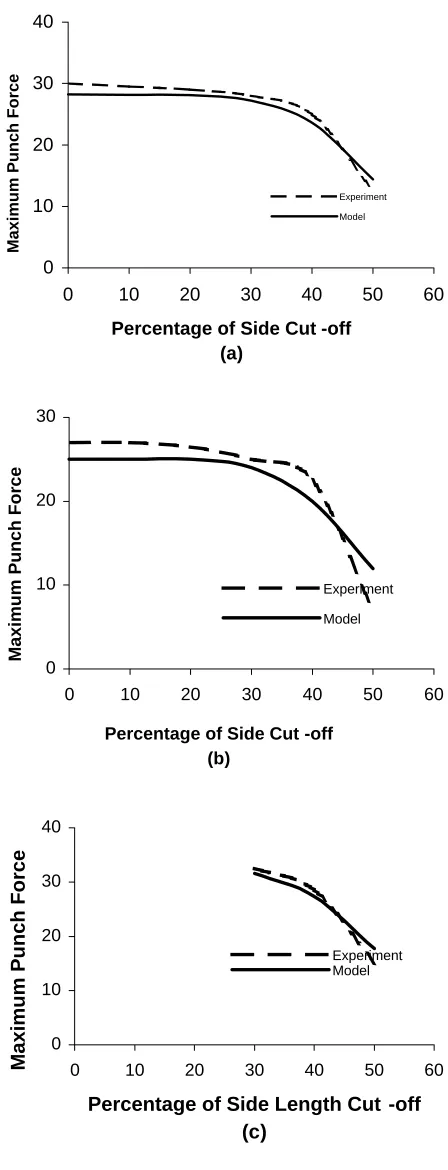
Figure 9. Comparison between theoretical and
To consider the effect of unbending the following equation is used:
F
F
W
U
pi eq ub
p
=
+
(23)blank shape: circula
0
1.5
3
4.5
6
0
50
100
150
200
Material flow line numb (a)
Nominal stress
blank Shape : Square 95 x 95
0 100 200 300
0 50 100 150 200 250 300
Material flow line num (b)
Nominal stress
Figure 10. Distribution of nominal stress over the part wall: (a) circular and (b) square cup.
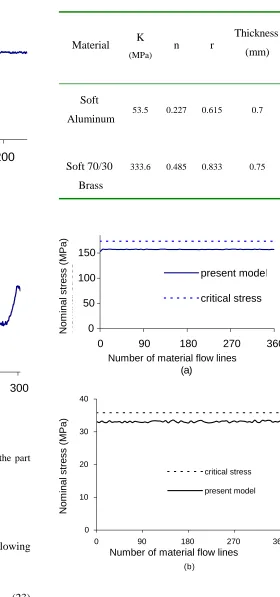
TABLE 5. Material Properties for Circular Cups.
Material K
(MPa)
n r
Thickness (mm)
Soft
Aluminum 0.22753.5 0.615 0.7
Soft 70/30 Brass
333.6
0.485 0.833 0.75
0 50 100 150
0 90 180 270 360
Number of material flow (a)
Nominal stress
present model
critical stress
0 10 20 30 40
0 90 180 270 360
Number of material flow line (b)
Nominal stress
critical stress
present model
Figure 11. Comparison between nominal stress and critical
stress in cylindrical cup: (a) brass and (b) soft AL.
No
m
in
a
l stre
ss (M
P
a
)
No
m
in
a
l stre
ss (M
P
a
)
Number of material flow lines
Where”
F
pi” is the share of the punch force for every strip between two metal flow lines. “W
ub” is the unbending work which isequal to bending work. Finally the total force can be determined with the following expression:
0 100 200 300 400
0 90 180 270 360
Number of material flow line
Nominal stress (Mpa)
present model
critical stress
Figure 12. Comparison between nominal stress and
critical stress in square cup.
-0.3
-0.2
-0.1
0
0.1
0.2
0
50
100
150
distance from cen
thickness strain
experiment
present mo
Figure 13. Thickness strain distribution for a
cylindrical cup (DD material and 30mm punch movement).
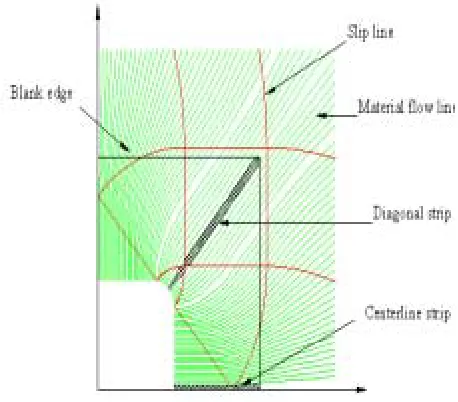
Figure 14. Blank geometry and location of diagonal and
centerline strips in square cup.
-0.2
-0.1
0
0.1
0.2
0.3
0.4
0
20
40
60
Distance from cent
Thickness strain
present mode
experiment
Figure 15. Thickness strain distribution for
F
F
pii m
=
=
∑
1
(24)
“m” is the number of flow lines around the die cavity.
For thickness calculation, Equations16-19 is used. Since
v
nonlinear has a small value for straight flow line, parameter k is considered zero for some parts like circular cups. For other parts k = 2 has been used.4. VERIFICATIONS
In this work, the published experimental results reported by Saran [11] and Majlessi [12] are adopted for verification of the results. Two types of circular and square shells have been examined as the following:
4.1 Punch Force
4.1.1 CIRCULAR CUPS In Reference 10 the experimental results of punch stroke force have
been provided for several materials in circular cup drawing. Table 1 displays the properties of materials used in these experiments. Table 2 reveals the tooling parameters used in the experiments.
For these materials stress-strain relation has been defined according to the power law:
σ
=
k
ε
n (25)Figure 8a compares the results of punch loads for both experiment and present numerical model for Deep Drawing Quality Steel (DD). The maximum force in both curves matches very well. Similar results can be observed for brass and high strength steel as shown by Figures 8.b and 8.c, respectively.
4.2 Nominal
Stress Using the method presented in this study, it is possible to evaluate the distribution of sheet nominal stress at die cavity edge for every step of punch movement. Figure 10.a shows this distribution for DD material and circular blank versus metal flow number around die cavity. In the figure, because of the circular symmetry, the stress distribution is uniform over the die profile. Also Figure 10.b shows the nominal stress distribution for DD material in square cup. The minimum stresses occur in the middle of the straight edges.The stress increases by approaching the corners. The maximum of stresses occurs at the intersecting point between the straight and corner edges. This condition of corner stress can be explained according to the shape of the material flow lines. In that region in the middle of the corners the material flow lines are approximately straight and therefore less strain energy is consumed comparing with that in the corner zone
4.3 Split Prediction
Comparing the result of the part nominal stress with plane strain limit of the stress, forming severity has been evaluated. Figures 11 and 12 show the distribution of nominal stress over circular and square cups. The experimental results indicate that in all cases split occurs on the part. The-0.6
-0.4
-0.2
0
0.2
0.4
0
50
100
Distance from center
Thickness strain
present model
experiment
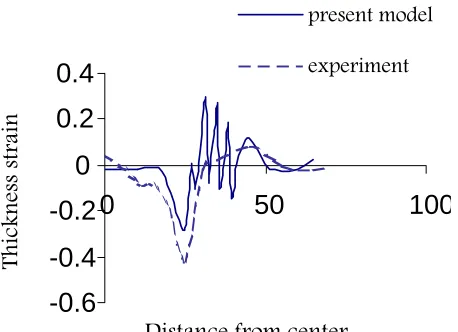
Figure 16. Thickness strain distribution for diagonal
predicted nominal stress in circular cups has less than 10% difference with the results obtained by Equation 15. Material properties for these sheets are given in Table 5. The result of stress calculation on square cups indicates the absolute condition of splitting. Figure 12 shows the condition of splitting in squared cups.
4.4 Thickness
Variation Figure 13 shows the distribution of thickness strain in circular cup after 30mm punch movement. The present model predicts a smaller strain compared with the experimental result. The main reason for this difference may be due to the neglecting of the sheet stretching over the punch profile and the existence of simplified assumption on material property and theory of deformation.Figure 14 shows the diagonal and centerline strip of a square blank that have been analyzed with genetic algorithm. Figure 15 and 16 shows the distribution of thickness strain in the strips after 20mm punch movement for diagonal and centerline strip, respectively. For centerline strip there is a good agreement between experimental results
and the present model. But in the diagonal strip there is an unstable performance. This behavior may be explained as the result of characteristic of material flow line at the corner zone in the flange area.
5.
CONCLUSIONSA methodology has been presented in the evaluation of the punch force and forming severity in deep drawn parts. The punch work was considered as the summation of the homogenous work of flange deformation and the bending and frictional works. Slip line field was the base of the strain energy calculation at the flange zone. To develop the slip lines, the matrix operator method was used. Application of this method was found very helpful in increasing both the computation speed and accuracy. The bending work was estimated by employing the grid
distortion technique at the die profile zone. The methodology is expected to be very useful at the process design and die tryout levels. The effects of blank geometry, tooling parameters, material properties, blank holder force and friction can be examined within minutes. Also to overcome the weakness of the slip line method in predicting the thickness variation, an optimization technique was used for estimation of the actual velocity field. Compared with the experimental results, the results of force calculations and split predictions are quite reasonable. With this model the maximum punch force can be determined with a very good precision. The results of thickness prediction are reasonable and can be improved by increasing the number of unknown parameters in the optimization procedure.
6. REFERENCES
1. Chung, S. Y and Swift, H. W., “Cup-Drawing f r o m a F l a t B l a n k ” , P r o c e e d i n g s I n s t i t u t e Mechanical Engineers, London, Volume 165, (1951), 199-223.
2. Yamada, Y., “Studies on Formability of Sheet Metals”, Report of the Inst. Ind. Sci., University of Tokyo, Vol. 11, No. 5, (1961).
3. Gerdeen, J. C., “An Analysis of Axisymmetric Sheet Metal Forming”, Proceedings NAMRC-II, University of Wisconsin - Madison, (May 1974), 350-365.
4. Yang, D. Y. and Lee, H. S., “Analysis of Three Dimensional Deep Drawing by the Energy Method’,
International Journal Mech. Sci., Vol. 32, No.6, (1993), 491-516.
5. Stoughton, Thomas, B., “Computer Simulation of Sheet Metal Forming”, IBC’93, Advanced Technologies and Processes, P101.
6. Johnson, W., Sowerby, R. and Venter R. D., “Plane Strain Slip Line Fields for Metal Deformation”, Oxford University Press, London, (1982).
7. Assempoor, A. and Karima, M., “Blank Development and Metal Flow Analysis for Multi-Stage Drawing of Box Shaped Stamping”, SAE Technical Paper 910516.
8. Sowerby, R., Chu, E. and Duncan, J. L., “Determination of Large Strain in Metal Forming”, J. Strain Analysis, Vol. 17, No. 2, (1982), 95-101.
10. Goldberg, D. E., “Genetic Algorithms in Searching Optimization and Machine Learning”, Addision Wesly, (1989).
11. Saran, M. J., “Numerical and Experimental Investigation of Deep Drawing of Metal Sheets”, ASME Journal of Engineering for Industry, Vol. 112, (1990), 272-277.
12. Majlessi, S. A. and Lee, D., “Deep Drawing of Square Shaped Sheet Metal Parts”, Part 2: Experimental Study,
ASME Journal of Engineering for Industry, Vol. 115, (1993), 110-117.
13. Sato, E., Shimizu, T., Sano, T. and Fuchizawa, S., “Square Cup Deep Drawing of Thick Plate by Multi-Axial Loading”, Part 1: Finite Element Analysis,
Journal of Materials Processing Technology, Vol. 48, Issue: 1-4, (1995), 69-74.
14. Meguid, S. A. and Refaat, M. H, “Finite Element Analysis of the Deep Drawing Process Using Variational
Inequalities”, Finite Elements in Analysis and Design, Vol. 28, Issue: 1, (1997), 51-67.
15. Kirby, D. S. and Wild, P. M, “Deep Drawing of Pressure Vessel end Closures: Finite Element Simulation and Validation”, Journal of Materials Processing Technology, Vol. 103, Issue: 2, (2000), 247-260.
16. Kim, J. B., Yoon, J. W., Yang, D. Y. and Barlat, F., “Investigation into Wrinkling Behavior in the Elliptical Cup Deep Drawing Process by Finite Element Analysis Using Bifurcation Theory”, Journal of Materials Processing Technology, Vol. 111, Issue: 1-3, (2001), 170-174.