© 2015 Pearson Education, Inc.
Figure 15.0-2
Early Earth and the Origin of Life
Major Events in the History of Life
Mechanisms of Macroevolution
Phylogeny and the Tree of Life
© 2015 Pearson Education, Inc.
15.1 Conditions on early Earth made the
origin of life possible
The Earth formed about 4.6 billion years ago. Early earth conditions:
• Hot
• Thick with water vapor
• No Oxygen
• Lightning
• Volcanic action
First life forms – bacteria about 3.8 billion
years ago
• The earliest evidence for life on Earth comes from
3.5-billion-year-old fossils of stromatolites, built by ancient photosynthetic prokaryotes still alive today.
• Because these 3.5-billion-year-old prokaryotes
used photosynthesis, it suggests that life first evolved earlier, perhaps as much as 3.8 billion years ago.
© 2015 Pearson Education, Inc.
The first life may have evolved
through four stages.
1. The abiotic (nonliving) synthesis of small organic
molecules such as amino acids and nitrogenous
bases.
2. The joining of these small molecules into
polymers, such as proteins and nucleic acids.
3. The packaging of these molecules into
“protocells,” membrane-enclosed droplets that
maintained an internal chemistry different from that of their surroundings.
4. The origin of self-replicating molecules that
15.2 SCIENTIFIC THINKING: Experiments
show that the abiotic synthesis of organic
molecules is possible
• In the 1920s, the Russian chemist A. I. Oparin and
the British scientist J. B. S. Haldane independently proposed that conditions on early Earth could have generated organic molecules.
• Our modern atmosphere is rich in O2, which
disrupts chemical bonds.
© 2015 Pearson Education, Inc.
15.2 SCIENTIFIC THINKING: Experiments
show that the abiotic synthesis of organic
molecules is possible
• In 1953, graduate student Stanley Miller, working
under Harold Urey, tested the Oparin-Haldane hypothesis.
• Miller identified a variety of organic molecules that
are common in organisms, including
• hydrocarbons (long chains of carbon and hydrogen)
and
Figure 15.2
Sparks simulating lightning
1
2
3
4
Water vapor
“Atmosphere”
Electrode
Condenser
Cold water
“Sea”
Sample for NH3
CH4
H2
© 2015 Pearson Education, Inc.
15.2 SCIENTIFIC THINKING: Experiments
show that the abiotic synthesis of organic
molecules is possible
• Hypotheses about the origins of life include
• deep-sea environments near submerged volcanoes
or hydrothermal vents or
15.3 Stages in the origin of the first cells
probably included the formation of polymers,
protocells, and self-replicating RNA
• The abiotic synthesis of small organic molecules
would have been a first step in the origin of life.
• But what is the evidence that the next three stages
could have occurred on early Earth?
1. Synthesis of polymers
2. Formation of protocells
© 2015 Pearson Education, Inc.
15.3 Stages in the origin of the first cells
probably included the formation of polymers,
protocells, and self-replicating RNA
• The abiotic synthesis of small organic molecules
would have been the next step in the origin of life.
• Before enzymes, hot sand, clay, or rock may have
helped monomers combine to form polymers.
• Waves may have splashed organic molecules onto
fresh lava or other hot rocks and then rinsed
15.3 Stages in the origin of the first cells
probably included the formation of polymers,
protocells, and self-replicating RNA
• A key step in the origin of life would have been the
isolation of a collection of organic molecules within a membrane-enclosed compartment.
• Laboratory experiments demonstrate that small
membrane-bounded sacs or vesicles form when lipids are mixed with water.
• These abiotically created vesicles are able to grow
© 2015 Pearson Education, Inc.
15.3 Stages in the origin of the first cells
probably included the formation of polymers,
protocells, and self-replicating RNA
• The origin of self-replicating molecules
• Today’s cells transfer genetic information from DNA to RNA to protein assembly. However, RNA molecules can assemble spontaneously from RNA monomers.
• Furthermore, when RNA is added to a solution containing a supply of RNA monomers, new RNA
molecules complementary to parts of the starting RNA sometimes assemble.
© 2015 Pearson Education, Inc.
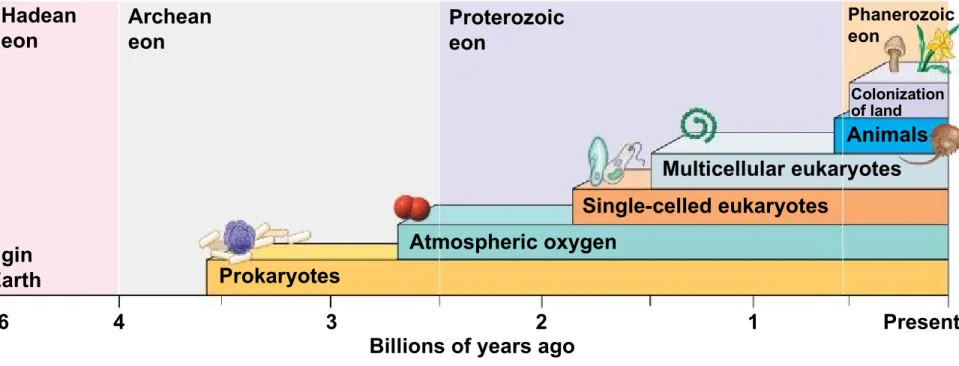
15.4 The origins of single-celled and
multicellular organisms and the colonization
of land were key events in life’s history
• Macroevolution is the broad pattern of changes in
life on Earth.
• The entire 4.6 billion years of Earth’s history can
be divided into three eons of geologic time.
• The Archaean and Proterozoic eons lasted about 4
billion years.
• The Phanerozoic eon includes the last half billion
Figure 15.4-0
Hadean eon
Archean eon
Proterozoic eon
Phanerozoic eon
Origin
of Earth Prokaryotes
Atmospheric oxygen
Single-celled eukaryotes
Multicellular eukaryotes Animals
Colonization of land
Present Billions of years ago
© 2015 Pearson Education, Inc.
15.4 The origins of single-celled and
multicellular organisms and the colonization
of land were key events in life’s history
• Prokaryotes lived alone on Earth for 1.5 billion
years, from 3.5 to 2 billion years ago.
• During this time, prokaryotes transformed the
atmosphere.
• Prokaryotic photosynthesis produced oxygen that
enriched the water and atmosphere of Earth.
• Aerobic cellular respiration allowed prokaryotes to
15.4 The origins of single-celled and
multicellular organisms and the colonization
of land were key events in life’s history
• The oldest fossils of eukaryotes are about 1.8
billion years old.
• The common ancestor of all multicellular
eukaryotes lived about 1.5 billion years ago.
• The oldest fossils of multicellular eukaryotes are
about 1.2 billion years old.
• The first multicellular plants and fungi began to
© 2015 Pearson Education, Inc.
15.4 The origins of single-celled and
multicellular organisms and the colonization
of land were key events in life’s history
• Humans diverged from other primates about 6 to 7
million years ago.
• Our species, Homo sapiens, originated about
195,000 years ago.
• If the clock of Earth’s history were rescaled to
15.5 The actual ages of rocks and fossils
mark geologic time
• Radiometric dating is based on the decay of
radioactive isotopes.
• The rate of decay is expressed as a half-life, the
time required for 50% of the isotope in a sample to decay.
• Carbon-14 is useful for dating relatively young
fossils—up to about 75,000 years old. Radioactive isotopes with longer half-lives are used to date
© 2015 Pearson Education, Inc.
Figure 15.5
Time (thousands of years)
15.5 The actual ages of rocks and fossils
mark geologic time
• A fossil’s age can be inferred from the ages of the
© 2015 Pearson Education, Inc.
15.6 The fossil record documents the history
of life
• The geologic record is based on the sequence
and ages of fossils in the rock strata.
• The most recent Phanerozoic eon
• includes the past 542 million years and
• is divided into three eras:
• Paleozoic,
• Mesozoic, and
• Cenozoic.
• The boundaries between eras are marked by mass
© 2015 Pearson Education, Inc.
© 2015 Pearson Education, Inc. © 2015 Pearson Education, Inc.
MECHANISMS
15.7 Continental drift has played a major role
in macroevolution
• According to the theory of plate tectonics, the
Earth’s crust is divided into giant, irregularly shaped plates that essentially float on the underlying mantle.
• In a process called continental drift, movements in
the mantle cause the plates to move.
• Since the origin of multicellular life roughly 1.5
© 2015 Pearson Education, Inc.
Figure 15.7a
Crust
Mantle
Outer core
Figure 15.7b North American Plate Caribbean Plate
Juan de Fuca Plate Cocos Plate Pacific Plate Nazca Plate South American Plate
Scotia Plate Antarctic Plate Arabian Plate Indian Plate Australian Plate Philippine Plate Eurasian Plate
Zones of violent tectonic activity Direction of movement
© 2015 Pearson Education, Inc.
15.7 Continental drift has played a major role
in macroevolution
• About 250 million years ago,
• plate movements brought all the landmasses
together and the supercontinent of Pangaea was
formed,
• the physical environment and climate changed
dramatically, and
15.7 Continental drift has played a major role
in macroevolution
• During the Mesozoic era, Pangaea started to break
apart, causing a geographic isolation of colossal proportions.
• By the end of the Mesozoic era, some 65 million
years ago, the modern continents were beginning to take shape.
• The history of continental merges and separations
© 2015 Pearson Education, Inc. Figure 15.7c-4 C e n o zo ic 1 2 3 4 M es o zo ic P re s e n t M il li o n s o f ye a rs a g o P a le o zo ic 65.5 135 251 Africa Eurasia India South America North Ame rica
Antarctica Austr
15.7 Continental drift has played a major role
in macroevolution
• Continental drift solves the mystery of marsupials,
mammals whose young complete their embryonic development in a pouch outside the mother’s body, such as kangaroos, koalas, and wombats.
• Australia and its neighboring islands are home to
© 2015 Pearson Education, Inc.
15.8 CONNECTION: Plate tectonics may
imperil human life
• Volcanoes and earthquakes result from the
movements of crustal plates.
• The boundaries of plates are hotspots of volcanic
and earthquake activity.
• California’s frequent earthquakes are a result of
movement along the infamous San Andreas Fault, part of the border where the Pacific and North
Figure 15.8-0
Pacific Plate
North
American Plate
San Francisco
Los Angeles
California
© 2015 Pearson Education, Inc.
© 2015 Pearson Education, Inc.
© 2015 Pearson Education, Inc.
15.9 During mass extinctions, large numbers
of species are lost
• Extinction is inevitable in a changing world.
• The fossil record shows that the vast majority of
species that have ever lived are now extinct.
• Over the last 500 million years, five mass
15.9 During mass extinctions, large numbers
of species are lost
• The Permian mass extinction
• occurred about 251 million years ago,
• defines the boundary between the Paleozoic and
Mesozoic eras,
• claimed 96% of marine animal species, and
© 2015 Pearson Education, Inc.
15.9 During mass extinctions, large numbers
of species are lost
• The Cretaceous mass extinction, about 65 million
years ago,
• caused the loss of more than half of all marine
species and many lineages of terrestrial plants and animals,
• resulted in the extinction of almost all of the
dinosaurs except birds, and
• was likely caused by a large asteroid that struck the
15.9 During mass extinctions, large numbers
of species are lost
• Mass extinctions affect biological diversity
profoundly.
• It took 100 million years for the number of marine
families to recover after the Permian mass extinction.
• Is a sixth extinction under way?
• The current extinction rate is 100–1,000 times the
normal background rate.
• It may take millions of years for life on Earth to
© 2015 Pearson Education, Inc.
15.10 Adaptive radiations have increased the
diversity of life
• Adaptive radiations are periods of evolutionary
15.10 Adaptive radiations have increased the
diversity of life
• Adaptive radiations have also followed each mass
extinction, when survivors became adapted to the many vacant ecological roles, or niches, in their communities.
• For example, mammals underwent a dramatic
© 2015 Pearson Education, Inc.
Figure 15.10
Extinction of dinosaurs Ancestral
mammal Reptilian ancestor
Monotremes (5 species)
Marsupials (324 species)
Eutherians (placental mammals; 5,010 species)
Time (millions of years ago)
15.11 Genes that control development play a
major role in evolution
• The fossil record can tell us
• what the great events in the history of life have
been and
• when they occurred.
• Continental drift, mass extinctions, and adaptive
radiation provide a big-picture view of how those
changes came about.
• We are now increasingly able to understand the
© 2015 Pearson Education, Inc.
15.11 Genes that control development play a
major role in evolution
• The field of evo-devo
• addresses the interface of evolutionary biology and
developmental biology and
• examines how slight genetic changes can produce
major morphological differences.
• Genes that program development control the
• rate,
• timing, and
• spatial pattern of change in an organism’s form as it
15.11 Genes that control development play a
major role in evolution
• Many striking evolutionary transformations are the
result of a change in the rate or timing of developmental events.
• Paedomorphosis
• is the retention in the adult of body structures that
were juvenile features in an ancestral species and
• occurs in the axolotl salamander, in which sexually
© 2015 Pearson Education, Inc.
15.11 Genes that control development play a
major role in evolution
• Slight changes in the relative growth of different
body parts can change an adult form substantially.
• Skulls of humans and chimpanzees are more
Figure 15.11b-0
Chimpanzee infant Chimpanzee adult
© 2015 Pearson Education, Inc.
15.11 Genes that control development play a
major role in evolution
• Homeotic genes
• are called master control genes and
• determine basic features, such as where pairs of
wings or legs develop on a fruit fly.
• Profound alterations in body form can result from
• changes in homeotic genes or
15.11 Genes that control development play a
major role in evolution
• New developmental genes that arose as a result of
gene duplications may have facilitated the origin of new body forms.
• For example, a fruit fly has a single cluster of several homeotic genes that direct the development of major body parts.
• Two duplications of these gene clusters appear to have occurred in the evolution of vertebrates from
invertebrate animals.
© 2015 Pearson Education, Inc.
15.11 Genes that control development play a
major role in evolution
• Additional evidence for this type of change in gene
regulation is seen in studies of the threespine stickleback fish.
• Researchers have identified a key gene that
15.11 Genes that control development play a
major role in evolution
• Stickleback fish that that live in the ocean have
bony plates that make up a kind of body armor and a large set of pelvic spines that help deter
predatory fish.
• Stickleback fish that that live in lakes have reduced
or absent bony plates and pelvic spines, resulting from a change in the expression of a
© 2015 Pearson Education, Inc.
15.12 EVOLUTION CONNECTION: Novel traits
may arise in several ways
• Most complex structures have evolved in
increments from simpler versions having the same basic function—a process of refinement.
• But sometimes we can trace the origin of
evolutionary novelties to the gradual adaptation of existing structures to new functions.
• As an example of the process of gradual
© 2015 Pearson Education, Inc.
15.12 EVOLUTION CONNECTION: Novel traits
may arise in several ways
• Although the eyes of vertebrates evolved
independently of those of squids, both evolved from a simple ancestral patch of photoreceptor
15.12 EVOLUTION CONNECTION: Novel traits
may arise in several ways
• There appears to have been a single evolutionary
origin of light-sensitive cells in all animals with eyes, vertebrates and invertebrates.
• They all share the same master genes that
regulate eye development.
• Figure 15.12 illustrates the range of complexity in
© 2015 Pearson Education, Inc. Figure 15.12-0 Eyecup Patch of pigmented cells Pigmented cells (photoreceptors) Nerve fibers Limpet Pigmented cells Eyecup Nerve fibers Abalone
Simple pinhole eye
Fluid-filled cavity Optic nerve Layer of pigmented cells (retina) Nautilus Eye with primitive lens Transparent protective tissue (cornea) Optic nerve Lens Retina Optic nerve Cornea
Marine snail Squid Complex
15.12 EVOLUTION CONNECTION: Novel traits
may arise in several ways
• Evolutionary novelty can also arise when
structures that originally played one role gradually acquire a different one.
• Such structures that evolve in one context but
become co-opted for another function are
sometimes called exaptations. Examples of
exaptations include
• feathers that may have first functioned for insulation
and later were co-opted for flight and
© 2015 Pearson Education, Inc.
15.13 Evolutionary trends do not mean that
evolution is goal directed
• The fossil record seems to show trends in the
evolution of many species, for example, toward larger or smaller body size.
• The evolution of horses reveals a potential
misunderstanding.
• If we select only certain species in this family tree, it
appears that there was a general trend toward the reduction in the number of toes, larger size, and teeth modified for grazing.
• However, if we consider all of the known members
Figure 15.13-0
Grazers: teeth adapted for grazing Browsers: teeth adapted for browsing
© 2015 Pearson Education, Inc.
15.13 Evolutionary trends do not mean that
evolution is goal directed
• Branching evolution can lead to real evolutionary
trends.
• The species selection model of long-term trends
compares species to individuals.
• Speciation is their birth, extinction their death, and
new species that diverge from them are their offspring.
• Unequal survival of species and unequal generation
of new species play a role in macroevolution similar to the role of unequal reproduction in
15.13 Evolutionary trends do not mean that
evolution is goal directed
• Evolutionary trends can also result directly from
natural selection. For example, when horse ancestors invaded the grasslands that spread during the mid-Cenozoic, there was strong
selection for grazers that could escape predators by running faster.
• Whatever its cause, it is important to recognize
that an evolutionary trend does not imply that evolution progresses toward a particular goal.
• Evolution is the result of interactions between
© 2015 Pearson Education, Inc. © 2015 Pearson Education, Inc.
15.14 Phylogenies based on homologies
reflect evolutionary history
• Phylogeny is the evolutionary history of a species
or group of species.
• Phylogeny can be inferred from
• the fossil record,
• morphological homologies, and
© 2015 Pearson Education, Inc.
15.14 Phylogenies based on homologies
reflect evolutionary history
• Homologies are similarities due to shared
ancestry, evolving from the same structure in a common ancestor.
• Generally, organisms that share similar
morphologies are closely related.
• However, some similarities are due to similar
adaptations favored by a common environment, a
process called convergent evolution.
• A similarity due to convergent evolution is called
15.15 Systematics connects classification
with evolutionary history
• Systematics is a discipline of biology that focuses
on
• classifying organisms and
• determining their evolutionary relationships.
• Carolus Linnaeus introduced taxonomy, a system
© 2015 Pearson Education, Inc.
15.15 Systematics connects classification
with evolutionary history
• Biologists assign each species a two-part scientific
name, or binomial, consisting of
• a genus and
• a unique part, the specific epithet, for each species
within the genus.
• Genera are grouped into progressively larger
categories.
Figure 15.15a
Species:
Felis catus
Genus: Felis
Family: Felidae
Order: Carnivora
Class: Mammalia
Phylum: Chordata
© 2015 Pearson Education, Inc.
15.15 Systematics connects classification
with evolutionary history
• Biologists traditionally use phylogenetic trees to
depict hypotheses about the evolutionary history of species.
• The branching diagrams reflect the hierarchical
classification of groups nested within more inclusive groups.
• Phylogenetic trees indicate the probable
Figure 15.15b
Order Family Genus Species
© 2015 Pearson Education, Inc.
15.16 Shared characters are used to
construct phylogenetic trees
• Cladistics
• is the most widely used method in systematics and
• groups organisms into clades.
• Each clade is a monophyletic group of species
15.16 Shared characters are used to
construct phylogenetic trees
• Cladistics is based on the Darwinian concept that
organisms share characters with their ancestors and differ from them. Thus, there are two main types of characters.
1. Shared ancestral characters, characters that originated in an ancestor.
© 2015 Pearson Education, Inc.
15.16 Shared characters are used to
construct phylogenetic trees
• An important step in cladistics is the comparison of
the ingroup (the taxa whose phylogeny is being investigated) and the outgroup (a taxon that
diverged before the lineage leading to the
15.16 Shared characters are used to
construct phylogenetic trees
• As an example, consider a frog representing the
outgroup and four other tetrapods representing the ingroup.
• The presence or absence of characters is
indicated as
• 1 if the character is present or
© 2015 Pearson Education, Inc. Figure 15.16a-0 Frog Iguana Duck-billed platypus Kangaroo Beaver Phylogenetic Tree Long gestation Gestation Hair mammary glands Amnion Character Table C H A R A C T E R S TAXA Long gestation Gestation Hair, mammary glands Amnion F ro g Ig u an a D u ck -b ill e d p la ty p u s K a n g ar o o B e av e r
0 1 1 1 1
0 0 1 1 1
0 0 0 1 1
15.16 Shared characters are used to
construct phylogenetic trees
• In our example, the phylogenetic tree is constructed
from a series of branch points (called nodes)
represented by the emergence of a lineage with a new set of derived characters.
• When constructing a phylogenetic tree, scientists
use parsimony, looking for the simplest explanation for observed phenomena.
• Systematists use many kinds of evidence.
However, even the best tree represents only the most likely hypothesis based on available
© 2015 Pearson Education, Inc.
15.16 Shared characters are used to
construct phylogenetic trees
• As new data accumulate, hypotheses are revised
and new trees drawn.
• The phylogenetic tree of reptiles shows that
crocodilians are the closest living relatives of birds.
• They share numerous features:
• they have four-chambered hearts,
• they “sing” to defend territories, and
• they build nests.
• These traits were likely present in the common
Figure 15.16b
Crocodilians Lizards
and snakes
Pterosaurs*
Ornithischian dinosaurs*
Saurischian dinosaurs* Birds
© 2015 Pearson Education, Inc.
15.17 An organism’s evolutionary history is
documented in its genome
• Molecular systematics uses DNA and other
molecules to infer relatedness.
• Scientists have sequenced more than 110 billion
bases of DNA from thousands of species.
• This enormous database has fueled a boom in the
15.17 An organism’s evolutionary history is
documented in its genome
• The more recently two species have branched
from a common ancestor, the more similar their DNA sequences should be.
• The longer two species have been on separate
evolutionary paths, the more their DNA is expected to have diverged.
• Molecular evidence has also begun to sort out the
© 2015 Pearson Education, Inc.
Figure 15.17-0
Red panda
Weasel
Raccoon
Giant panda
Spectacled bear
Sloth bear
Sun bear
American black bear
Asian black bear
Polar bear
Brown bear
Millions of years ago
15.17 An organism’s evolutionary history is
documented in its genome
• Different genes evolve at different rates.
• DNA coding for ribosomal RNA (rRNA)
• changes relatively slowly and
• is useful for investigating relationships between taxa that diverged hundreds of millions of years ago.
• In contrast, DNA in mitochondria (mtDNA)
• evolves rapidly and
© 2015 Pearson Education, Inc.
15.17 An organism’s evolutionary history is
documented in its genome
• The remarkable commonality of molecular biology
• demonstrates that all living organisms share many
biochemical and developmental pathways and
• provides overwhelming support for Darwin’s theory
15.18 Molecular clocks help track
evolutionary time
• Molecular clocks
• rely on genes that have a reliable average rate of
change,
• can be calibrated in real time by graphing the
number of nucleotide differences against the dates of evolutionary branch points known from the fossil record, and
• can be used to estimate the dates of other
© 2015 Pearson Education, Inc.
15.18 Molecular clocks help track
evolutionary time
• Molecular clocks have been used to date a wide
variety of events.
• In one fascinating example published in 2011,
researchers studied the divergence of human body lice from head lice and estimated that people
15.18 Molecular clocks help track
evolutionary time
• Some biologists are skeptical about the accuracy
of molecular clocks because the rate of molecular change may vary
• at different times,
• in different genes, and
© 2015 Pearson Education, Inc.
15.19 Constructing the tree of life is a work in
progress
• Molecular systematics and cladistics are
remodeling some trees.
• Biologists currently recognize a three-domain
system consisting of
• two domains of prokaryotes: Bacteria and Archaea,
and
• one domain of eukaryotes, called Eukarya,
including the kingdoms
• Fungi,
• Plantae, and
15.19 Constructing the tree of life is a work in
progress
• Molecular and cellular evidence indicates that
• the two lineages of prokaryotes (bacteria and
archaea) diverged very early in the evolutionary history of life and
• archaea are more closely related to eukaryotes
© 2015 Pearson Education, Inc.
Figure 15.19a
Most recent common ancestor of all living things
Bacteria
Eukarya
Archaea Gene transfer between mitochondrial ancestor
and ancestor of eukaryotes
Gene transfer between chloroplast ancestor and ancestor of green plants
Billions of years ago
4 3 2 1 0
1
1 2
2 3
15.19 Constructing the tree of life is a work in
progress
• Comparisons of complete genomes from all three
domains show that especially during the early history of life, there have been substantial interchanges of genes between organisms in different domains and
these took place through horizontal gene transfer, a
process in which genes are transferred from one genome to another through mechanisms such as plasmid exchange and viral infection.
• Some biologists suggest that the early history of life
© 2015 Pearson Education, Inc.
15.19 Constructing the tree of life is a work in
progress
• Some scientists have argued that horizontal gene
transfers were so common that the early history of life should be represented as a tangled network of connected branches.
• Other scientists have suggested that the early
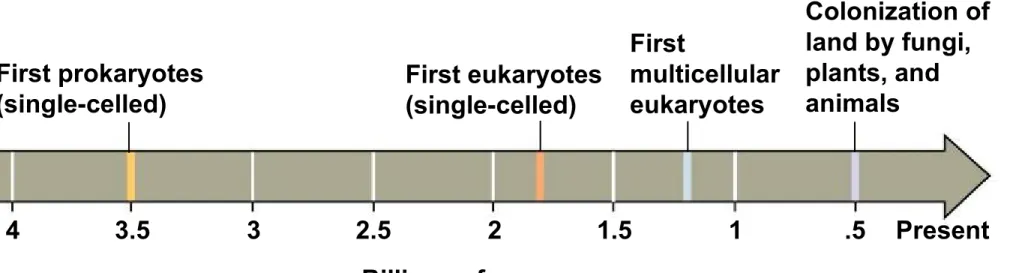
Figure 15.UN01
First prokaryotes (single-celled)
First eukaryotes (single-celled)
First
multicellular eukaryotes
Colonization of land by fungi, plants, and animals
Billions of years ago
Present 3.5