Student Preference for Spreadsheet-Based Learning
Akash Dania1, Ph.D., Bridget Anakwe1, Ph.D. & Bernadette Ruf1, Ph.D.
1
College of Business, Delaware State University, USA
Correspondence: Akash Dania, Ph.D., College of Business, Delaware State University, USA
Received: September 3, 2018 Accepted: March 7, 2019 Online Published: June 3, 2019 doi:10.5430/afr.v8n3p16 URL: https://doi.org/10.5430/afr.v8n3p16
Abstract
Spreadsheets can be used as a learning tool to explore abstract concepts in quantitative-based disciplines such as accounting and finance. Given the rapid adoption of technology in the classroom, understanding how students perceive the use of spreadsheets in quantitative-based courses is imperative. This study examines how students perceive the use of spreadsheets in applied business courses. Student preference is viewed in terms of enhanced learning of course content, usage in class lectures, increased motivation, and presentation of material. Accounting and finance students attending an institute of higher education based in the Northeastern United States were surveyed. Results from this study using a Kolmogorov-Smirnov test indicate a preference among students for the use of spreadsheets as a teaching aid in classrooms.
Keywords: spreadsheets, applied business courses, teaching aide 1. Introduction
During the last decade, business education has increasingly seen the use of spreadsheet as a teaching tool from introductory to advanced level courses at the institutes of higher learning. With the adoption of technology in day-to-day life, there is an inherent supposition that freshmen students are entering universities with a developed sense of computer literacy. This assumption has allowed instructors to adopt spreadsheets as a tool for teaching quantitative subject content. Correspondingly, business discipline educationalists are experimenting with innovative methods, such as using spreadsheets and other visual media aid for teaching applied disciplines, particularly in the areas of accounting, finance, and management science (Dania and Posey, 2012). A wave of technology adoption in classrooms has led to new editions of applied business disciplines textbooks to include spreadsheet solutions as part of instructor materials. The purpose of this study is to understand whether accounting and finance students believe that integrating spreadsheets in classroom lectures is effective in learning quantitative course content. More specifically, we address these pertinent questions focusing on technology adoption in classrooms: Do students believe that spreadsheet usage enhances their content knowledge? Do students believe that spreadsheets provide an effective tool for demonstrating course material in the classroom? Does the use of spreadsheets build interest in course content learning? Do students believe that spreadsheet usage motivates their learning process? Do students believe that spreadsheets demonstration enhances learning over traditional lecture formats?
and finance learning is mostly quantitative based and requires incremental calculations to reach results, spreadsheet use is a natural fit to teach these courses.
In addition to the benefit of a hands-on experience, business discipline educators are increasingly relying on spreadsheets to facilitate functional understanding and modeling practice for math intensive topics. This aspect is evidenced by several textbooks available currently in the areas of applied finance and accounting which use spreadsheets to explain applied subject matter (for example, “Financial Analysis with Microsoft Excel” by Timothy R. Mayes and Todd M. Shank; “Principles of Finance with Excel” by Simon Benninga and Tal Mofkadi among others). Spreadsheets also serve as an intuitive educational aid for learning and practicing applied concepts. This characteristic of spreadsheets promotes an open-ended, problem-focused and self-exploratory learning environment. The use of spreadsheets is interactive as it provides immediate feedback for dynamically changing case scenarios (such as changing source data or formulas). Accounting and finance discipline instruction, which are primarily of an applied nature, can improve active learning among students by using the intuitive and interactive features of spreadsheets.
A major challenge facing freshmen students as they pursue higher education is a lack of academic preparedness for college-level math, evidenced by high rates of referral to developmental math and low rates of college math completion (Hodara, 2013). This makes finance a challenging subject to teach, with most of its content fundamentally math based and quantitative in nature. Likewise, interrelated areas in accounting such as financial accounting, accounting management, and tax accounting require a fair level of math preparedness (Chan and Storey, 1996). An array of spreadsheet in-built functions provides an engaging and intuitive alternative to cover most of the topics in accounting and finance, such as time value of money, asset valuation, stochastic processes, min-max problems, regression analysis, amortization tables, and budgeting.
However, the use of spreadsheets and its library of functions do come with a learning curve. What do accounting and finance course students themselves perceive the integration of spreadsheets into classroom teaching? To address this issue and to understand whether the use of spreadsheets promotes understanding of accounting and finance course material, we surveyed accounting and finance students at an institute of higher education in the Northeast United States. Academicians, textbook publishers, and practitioners will find results from this survey useful. The importance of this study is threefold. First, our study provides an understanding of students’ perception of the use of spreadsheets in business courses. This will help in designing business courses to integrate spreadsheets as a teaching tool. Second, finding what student “turn-offs” are when spreadsheets are used will enable academicians to avoid such procedures and enhance the students learning experience. Third, results from our study will assist instructors and textbook publishers in effectively combining spreadsheet application and subject knowledge in courses and textbooks developmental process. Preparing students with skills that are important to prospective employers are paramount for business schools. Accounting and finance professionals and prospective employers are looking for problem-solving capability in their current and future employees. Employers’ expectations about the skill-set among the applicants applying for a job almost necessitates the use of spreadsheet in the classroom.
Results from our study indicate a predilection among student participating in our study towards the use of spreadsheets in the classroom as a teaching aid, albeit with pedagogical and classroom set-up refinements. These results are comparable with the previous literature, which suggests that instructors need dynamic improvement of their course structure and spreadsheet application knowledge for an optimal instruction and learning environment which use spreadsheets (Baker and Sugden, 2003; Peterson and Reider, 2002). The remainder of the paper is as follows. In section 2, we present a brief review of related literature on the use of spreadsheets in applied instruction. Section 3 describes the questionnaire, data, and methodology for the current research. Section 4 presents the results of the questionnaire. Section 5 provides concluding remarks and recommendations for future research.
2. Literature Review
In a study on spreadsheet usage, Ghani & D'Mello (1993) examined learning experience for a sample of graduate students who were assigned a spreadsheet-based finance case study to understand the motivational aspect of learning with spreadsheets. The authors observed that individuals who enjoyed spreadsheet-based activities were more likely to repeat it, thereby refining their understanding of the applicable subject matter and spreadsheet usage skills. The implication for instructor integrating spreadsheets as a teaching tool is that they should design instructional flow for the course which creatively blends discipline as well as spreadsheet knowledge.
The ever-increasing built-in function library of spreadsheets allow for the creation of generic worksheets customized to solve a variety of business problems. Formation of generic worksheets typically require little computing expertise and once created may be reprocessed with varying data. This enables businesses to automate spreadsheet-based operations, reducing back-office worktime and expense. Therefore, it does not come as a surprise that employers prefer applicants who come prepared with spreadsheet skills in addition to discipline-specific knowledge. Additionally, as computer hardware and software costs decline, the affordability factor is pushing acceptability of spreadsheets use in all levels of business operations (Pemberton and Robson 2000). Expectedly, the role of spreadsheets in business organizations has evolved from very basic use such as creating quotation estimates, bill-of-materials, expenses and departmental budgets to advanced applications such as data modeling, analytics, and forecasting.
Although not initially intended as an educational tool, spreadsheets have grown in popularity among applied course instructors (Jones, 2005). According to Lewis (2001), spreadsheet assignments create avenues to explore and learn abstract notions, which are mathematical in nature. Students who have a high expertise level in use of spreadsheets prior to taking applied or mathematical courses generally exhibit a distinct advantage in understanding course concepts (Evans, 2000). As a problem-solving tool, spreadsheets enable student’s visualization of underlying mathematical concepts, permitting an intuitive approach for solving problems and understanding what-if scenarios (Sinclair, 1998). For teaching accounting and finance, spreadsheets provide an intuitive learning platform to teach customarily problematic concepts such as time value of money, asset valuation, balance sheets, cash flow and income statements (Sutherland and Rojano 1993, Rojano 1996, Jones 2005).
According to Microsoft, there are over 300 million paid users of their popular version of the spreadsheet program, Excel (Window Central, 2016). With the unpaid users (using pirated versions) put together, the total number of users of the Excel program is even higher. Excel is widely used to model real-life business situations and to make critical business decisions (Condon 2006). Excel is by far the leading version of spreadsheet software today. Over 90 percent of respondents surveyed indicated that they used Excel for business functions (Pemberton and Robson 2000). Excel is becoming a preferred tool among accountants and auditors. According to Gray (2006), only 8% of the surveyed accountants or auditors indicated that their departments did not use Excel at all.
Despite the increasing popularity of spreadsheets, opportunities for improvement in its application in the classroom scenario still exist (Baker and Sugden, 2003). Kolb’s (1984) four-stage cycle of learning, and Marriott (2003) highlight evidence to suggest that accountancy and finance students (Baldwin and Reckers, 1984; Baker et al., 1986) and practitioners (Brown and Burke, 1987; Collins and Milliron, 1987) fall in a “convergers” category. “Convergers” are individuals who test theory and practice and often combining conceptualization and experimentation. Individuals who prefer this style of learning method historically have known to be successful in their careers (Togo and Baldwin, 1990). Convergers also prefer to deal with things rather than people and respond best to the situation, which will have one correct solution (Marriott, 2003; Wilson and Hill, 1994).
3. Data and Methodology
As the research setting, we developed a questionnaire based on a previous study done by Dania and Posey (2012), Dania et al. (2007) and Simpson et al. (2003), which investigate student opinions towards the use of Excel in classroom lectures (see appendix 1). Students answered questions focused on the use of spreadsheet in accounting and finance courses, based on a five-point scale ranging from “strongly agree” to “strongly disagree.” Questions in the questionnaire for our study have been grouped into five core focus areas:
Learning (Q1, Q2, and Q3) – questions focus on understanding whether Excel enhances learning of accounting and finance disciplines over traditional learning methods.
Lecture (Q4, Q5, Q6, Q7, and Q8) – questions related to lecturing and teaching methods instructors use Excel in the classroom.
Motivation (Q9 and Q10) – questions pertaining to interest and motivation towards learning accounting and finance concepts when Excel is used.
Perception (Q11, Q12, Q13, Q14, Q15, Q16 and Q17) - student perception towards the use of Excel as a learning aid based on their experience.
Presentation (Q18 and Q19) – questions related to aesthetics and presentation of Excel during lectures. Data collection is through a self-administered questionnaire administered to students in accounting and a finance class at an institute of higher learning based in the Northeastern United States. The questionnaire was submitted to the institutional review board (IRB), to review instrument and research ethics proposed by authors. Once approved, the questionnaire was handed to students during their scheduled class. Responses were completely anonymous, and students had the option to not fill out the questionnaire. Participation was at the student’s own accord and no monetary or other incentive was promised or given to the participants. In all, nineteen accounting students and twenty-four finance student completed the questionnaire. The responses were entered in SPSS software for analysis. The Kolmogorov-Smirnov One-Sample Test is utilized to evaluate the student opinion towards the use of spreadsheets in accounting and finance courses. Considering the response size, a non-parametric analysis is appropriate for the current study. The responses were tested at an alpha level of .05.
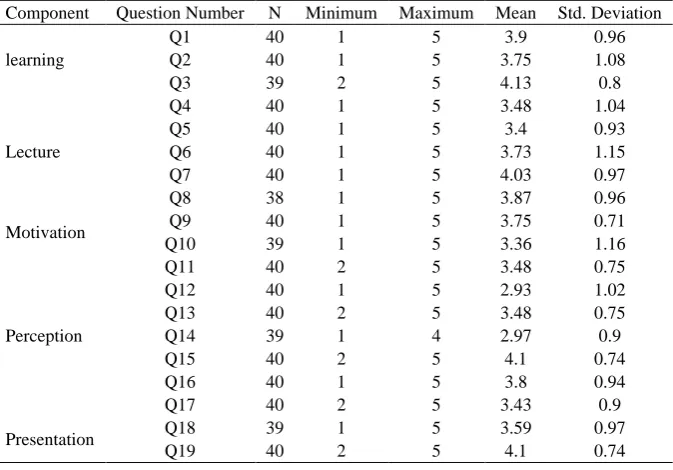
Table 1. Descriptive Statistics
Descriptive statistics for the student response to their opinion regarding the use of spreadsheets as a teaching aid in accounting and finance classes. The variables Q1 – Q19 are questions on the questionnaire. N is the number of responses found usable for analysis. Mean, Median, Std. Deviation, Maximum and Minimum represent individual descriptive statistics for each variable. The descriptive statistics represent a cumulative group of accounting and finance students.
Component Question Number N Minimum Maximum Mean Std. Deviation
learning
Q1 40 1 5 3.9 0.96
Q2 40 1 5 3.75 1.08
Q3 39 2 5 4.13 0.8
Lecture
Q4 40 1 5 3.48 1.04
Q5 40 1 5 3.4 0.93
Q6 40 1 5 3.73 1.15
Q7 40 1 5 4.03 0.97
Q8 38 1 5 3.87 0.96
Motivation Q9 40 1 5 3.75 0.71
Q10 39 1 5 3.36 1.16
Perception
Q11 40 2 5 3.48 0.75
Q12 40 1 5 2.93 1.02
Q13 40 2 5 3.48 0.75
Q14 39 1 4 2.97 0.9
Q15 40 2 5 4.1 0.74
Q16 40 1 5 3.8 0.94
Q17 40 2 5 3.43 0.9
Presentation Q18 39 1 5 3.59 0.97
Non-parametric tests place less stringent demands on the data being analyzed, especially due to its low sample size. Standard parametric procedures place strict underlying assumptions, particularly for sample sizes. The one-sample t-test, for example, requires that sample observations be drawn from a normally distributed population. If there is a violation of the normality condition then we may not rely on the resulting P-values and confidence intervals. However, normality is not a core assumption for the Kolmogorov-Smirnov test to produce valid inferences. When Kolmogorov-Smirnov one-sample test (Daniel 1990) is applied, the focus is on two cumulative distribution functions: a hypothesized cumulative distribution and the observed cumulative distribution. To assume that student response is going to be normally distributed would place bias in research. Furthermore, a Kolmogorov-Smirnov test is appropriate when response data are nominal in structure (Note 1).
4. Results
The result of the Kolmogorov-Smirnov test for the accounting and finance group, respectively are shown in Table 2 and Table 3. Table 4 reports on the results of the combined accounting and finance groups. Columns Q1 through Q19 represent the results of the student’s responses.
Table 2. Analysis of Student Questionnaire: Accounting Group (One-Sample Kolmogorov-Smirnov Test) Kolmogorov-Smirnov test result for the student response on their opinion regarding the use of spreadsheets as a teaching aid in accounting and finance classes. Table 2 represents results of the accounting group. The variables Q1 – Q19 are questions on the questionnaire. Q1, Q2, Q3 pertains to Learning, Q4, Q5, Q6, Q7 and Q8 pertains to Lecture, Q9 and Q10 pertains to Motivation, Q11, Q12, Q13, Q14, Q15, Q16 and Q17 pertains to Perception, and Q18 and !9 pertains to Presentation. Asymp. Sig. (2-tailed) indicates the statistical significance. When a
Kolmogorov-Smirnov (K-S) test (Daniel 1990) is applied; the focus is placed on two cumulative distribution functions: a hypothesized cumulative distribution (in this study, a uniform distribution) and the observed cumulative distribution (questionnaire response).
Component Learning Lecture Motivation Perception Presentation
Q1 Q2 Q3 Q4 Q5 Q6 Q7 Q8 Q9 Q10 Q11 Q12 Q13 Q14 Q15 Q16 Q17 Q18 Q19
Normal Parameters
Mean 4.167 4.056 4.222 3.611 3.667 3.556 3.778 3.611 3.722 3.556 3.667 2.667 3.5 2.833 4.056 3.944 3.556 3.5 4.222
Std.
Deviation 0.924 1.162 0.943 1.037 1.085 1.199 1.215 1.092 0.826 1.042 0.594 0.97 0.707 0.857 0.725 0.802 0.984 1.043 0.808
Most Extreme Differences
Absolute 0.261 0.292 0.295 0.222 0.232 0.256 0.35 0.195 0.409 0.221 0.324 0.254 0.26 0.244 0.358 0.305 0.23 0.295 0.281
Positive 0.183 0.208 0.205 0.222 0.157 0.133 0.157 0.157 0.313 0.168 0.258 0.254 0.26 0.201 0.308 0.25 0.159 0.205 0.219
Negative -0.261 -0.292 -0.295 -0.222 -0.232 -0.256 -0.35 -0.195 -0.409 -0.221 -0.324 -0.19 -0.26 -0.244 -0.358 -0.305 -0.23 -0.295 -0.281
Test Statistic 0.261 0.292 0.295 0.222 0.232 0.256 0.35 0.195 0.409 0.221 0.324 0.254 0.26 0.244 0.358 0.305 0.23 0.295 0.281
Asymp. Sig. (2-tailed) 0.002 0 0 0.019 0.012 0.003 0 0.07 0 0.021 0 0.003 0.002 0.006 0 0 0.013 0 0.001
Table 3. Analysis of Student Questionnaire: Finance Group (One-Sample Kolmogorov-Smirnov Test)
Kolmogorov-Smirnov test result for the student response on their opinion regarding the use of spreadsheets as a teaching aid in accounting and finance classes. Table 3 represents the results of the finance group. The variables Q1 – Q19 are questions on the questionnaire. Q1, Q2, Q3 pertains to Learning, Q4, Q5, Q6, Q7 and Q8 pertains to Lecture, Q9 and Q10 pertains to Motivation, Q11, Q12, Q13, Q14, Q15, Q16 and Q17 pertains to Perception, and Q18 and !9 pertains to Presentation. Asymp. Sig. (2-tailed) indicates statistical significance. When a Kolmogorov-Smirnov (K-S) test (Daniel 1990) is applied; the focus is placed on two cumulative distribution functions: a hypothesized cumulative distribution (in this study, a uniform distribution) and the observed cumulative distribution (questionnaire response).
Component Learning Lecture Motivation Perception Presentation
Q1 Q2 Q3 Q4 Q5 Q6 Q7 Q8 Q9 Q10 Q11 Q12 Q13 Q14 Q15 Q16 Q17 Q18 Q19
Normal Parameters
Mean 3.682 3.5 4.048 3.364 3.182 3.864 4.227 4.1 3.773 3.19 3.318 3.136 3.455 3.095 4.136 3.682 3.318 3.667 4 Std.
Deviation 0.945 0.964 0.669 1.049 0.733 1.125 0.685 0.788 0.612 1.25 0.839 1.037 0.8 0.944 0.774 1.041 0.839 0.913 0.69
Most Extreme Differences
Absolute 0.223 0.211 0.29 0.273 0.325 0.253 0.266 0.223 0.327 0.218 0.284 0.189 0.298 0.26 0.294 0.302 0.246 0.309 0.273
Positive 0.186 0.198 0.29 0.181 0.325 0.188 0.266 0.2 0.264 0.163 0.284 0.189 0.202 0.169 0.252 0.198 0.193 0.215 0.273
Negative -0.223 -0.211 -0.281 -0.273 -0.266 -0.253 -0.234 -0.223 -0.327 -0.218 -0.216 -0.175 -0.298 -0.26 -0.294 -0.302 -0.246 -0.309 -0.273 Test Statistic 0.223 0.211 0.29 0.273 0.325 0.253 0.266 0.223 0.327 0.218 0.284 0.189 0.298 0.26 0.294 0.302 0.246 0.309 0.273
Asymp. Sig. (2-tailed) 0.006 0.012 0 0 0 0.001 0 0.01 0 0.011 0 0.04 0 0.001 0 0 0.001 0 0
The next group of questions relates to understanding student responses to lecturing methods when Excel is used. These questions include: Q4 (I feel that the pace of the course is faster in Excel based lecture than compared to chalkboard-based lecture, Q5 (Excel-based lecture motivate more subject matter based discussion compared to chalkboard based lecture, Q6 (I prefer when the instructor balances Excel examples with chalkboard based lecture), Q7 (I prefer when the instructor combines Excel examples with other class activities in a lecture. For example, discussion, classroom work on projects, exercises, etc.), and Q8 (I prefer when Excel examples that are to be used in the lecture are handed out to me before the lecture). For the accounting group, student responses lean towards agreement, that is, the pace, of course, is faster, motivated more discussion, balancing of Excel and class activities, and handing out material prior to class. Interestingly, finance student group’s responses were similar to the accounting group, but the finance students inclined their preference more toward balancing excel with class activities and handing out material prior to class. The responses for this group of questions reveal important information and implication for accounting and finance instructors who use Excel for instructional purposes. As the accounting and finance application function library increases in Excel, (Lacher, 1997), instructors should find ways to enhance their own expertise in adapting these functions for instructional purposes.
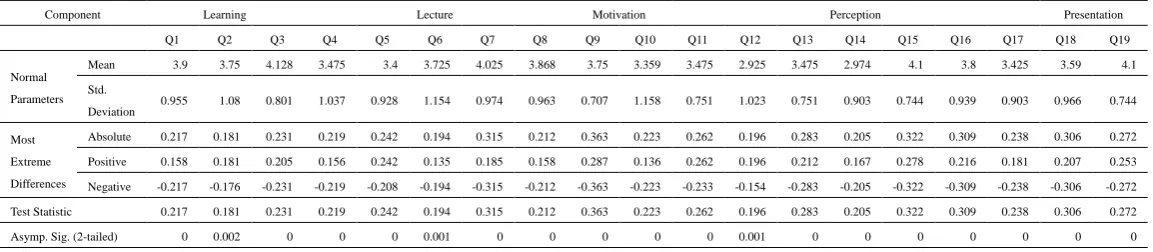
Table 4. Analysis of Student Questionnaire: Accounting and Finance Group (One-Sample Kolmogorov-Smirnov Test)
Kolmogorov-Smirnov test result for the student response on their opinion regarding the use of spreadsheets as a teaching aid in accounting and finance classes. Table 4 represents the results of the accounting and finance group. The variables Q1 – Q19 are questions on the questionnaire. Q1, Q2, Q3 pertains to Learning, Q4, Q5, Q6, Q7 and Q8 pertains to Lecture, Q9 and Q10 pertains to Motivation, Q11, Q12, Q13, Q14, Q15, Q16 and Q17 pertains to Perception, and Q18 and !9 pertains to Presentation. Asymp. Sig. (2-tailed) indicates statistical significance. When a Kolmogorov-Smirnov (K-S) test (Daniel 1990) is applied; the focus is placed on two cumulative distribution functions: a hypothesized cumulative distribution (in this study, a uniform distribution) and the observed cumulative distribution (questionnaire response).
Component Learning Lecture Motivation Perception Presentation
Q1 Q2 Q3 Q4 Q5 Q6 Q7 Q8 Q9 Q10 Q11 Q12 Q13 Q14 Q15 Q16 Q17 Q18 Q19
Normal Parameters
Mean 3.9 3.75 4.128 3.475 3.4 3.725 4.025 3.868 3.75 3.359 3.475 2.925 3.475 2.974 4.1 3.8 3.425 3.59 4.1
Std. Deviation
0.955 1.08 0.801 1.037 0.928 1.154 0.974 0.963 0.707 1.158 0.751 1.023 0.751 0.903 0.744 0.939 0.903 0.966 0.744
Most Extreme Differences
Absolute 0.217 0.181 0.231 0.219 0.242 0.194 0.315 0.212 0.363 0.223 0.262 0.196 0.283 0.205 0.322 0.309 0.238 0.306 0.272
Positive 0.158 0.181 0.205 0.156 0.242 0.135 0.185 0.158 0.287 0.136 0.262 0.196 0.212 0.167 0.278 0.216 0.181 0.207 0.253
Negative -0.217 -0.176 -0.231 -0.219 -0.208 -0.194 -0.315 -0.212 -0.363 -0.223 -0.233 -0.154 -0.283 -0.205 -0.322 -0.309 -0.238 -0.306 -0.272
We now focus our attention on questions pertaining to student interest and motivation towards learning when using Excel. Motivating students to learn is an important aspect of teaching quantitative courses such as accounting and finance. These questions include Q9 (Excel examples add interest to the subject matter) and Q10 (Long solutions of Excel examples are simple to read). Responses from students only marginally lean towards an agreement for excel adding interest in subject matter and examples are simple to read, for the accounting, finance and aggregate groups. This result is consistent with the contention that the use of Excel itself has a learning curve (Dania and Posey, 2012). A possible reason for students not finding long solutions in Excel simple to read maybe their own proficiency in Excel. Thus, students who are not proficient in the use of Excel may find its use in a classroom not as interesting or easy to work with. A recommendation is to integrate Excel throughout the curriculum.
The next set of questions focused on student perception towards the use of Excel as a learning aid based on their own experience. These include: Q11 (The use of Excel examples in lecture helps me pass a course), Q12 (I prefer when the instructor uses chalkboard lecture compared to Excel-based lecture), Q13 (Use of Excel examples in lecture help me ask relevant questions about the subject matter), Q14 (Compared to Excel-based lecture, there is less face-to-face instructor-student interaction when the instructor uses chalkboard for lecturing), Q15 (All things considered, I would regard the use of Excel as a positive aspect of a course), Q16 (All things considered, I would take another course that uses Excel for lecturing) and Q17 (Overall, I prefer lecture that uses Excel over a lecture using chalkboard). The accounting group leans towards agreement on questions dealing with helping them pass the course, ask relevant questions, use of excel examples, and overall preference of Excel use. The accounting group disagrees that there is less face-to-face with chalkboard lecture compared to Excel-based lecture. This reaffirms the assertion, that this student group prefers the use of Excel for teaching accounting lectures. The finance group marginally leans towards agreement on questions dealing with helping them pass the course, ask relevant questions, use of excel examples, and overall preference of Excel use. The finance group is marginally indifferent to less face-to-face with chalkboard lecture compared to Excel-based lecture. These results suggest that students do not find any less face-to-face interactions with Excel spreadsheets compared to lecture chalkboard. Both the accounting and the finance groups agree that use of Excel is a positive aspect of a course. A similar response is observed when finance and accounting responses are aggregated.
Finally, the last two questions are related to the aesthetics and presentation of Excel during lectures. These are Q18 (Excel text on the screen is large enough to read) and Q19 (The lighting in the classroom is bright enough for taking notes when using Excel on an overhead projector). Students marginally agree that the Excel text size should be large enough for reading purposes. Too small of font size in Excel when used for teaching may be a turn-off which instructors want to avoid. Students respondents, in general, seem to be satisfied with the lighting condition in classrooms when Excel is used.
5. Conclusion
The purpose of this research was to analyze whether the use of spreadsheets in applied courses such as accounting and finance stimulates conceptual understanding and application of course material by students. The results from our study seem to indicate a preference among students for the use of Excel in classrooms as a teaching aid. To provide credibility we used two different groups, one from an undergraduate accounting course and another from an undergraduate finance course at an institute of higher education. Statistical analysis of our study suggests that sampled students indicate a preference for a spreadsheet-amalgamated instruction for applied business courses in accounting and finance compared to teaching these courses using strictly traditional lecture techniques.
While there are several benefits of using spreadsheets, in applied courses such as accounting and finance, a customized balanced approach between traditional lecture and spreadsheets is preferred by respondents. Students often express concerns that with the use of spreadsheets in the classroom, there needs to be a balance between a spreadsheet and other class activities. It is also to be noted that the use of spreadsheets themselves requires a conceptual understanding of computing and may present a steep learning curve (of spreadsheet software) for students and instructors. Students who may not have been exposed to computers may feel left behind in classrooms using spreadsheets extensively. Instructors who have not been exposed to the use of computing or related software may find it difficult to design courses based on spreadsheets. A recommendation may be to take a pre-assessment of the skill level of students in the knowledge of spreadsheets. Another recommendation is to hold classes using spreadsheets in computer labs with help of research assistants who are well conversed with the use of computers and spreadsheets.
learning tool. We also recommend studying students from different demographic backgrounds and countries. Finally, it would be interesting to analyze the same research questions from the perspective of the instructors of applied courses.
References
Baker, J. E. & Sugden, S.J. (2003). Spreadsheets in education: The first 25 years. Spreadsheets in Education, 1(1), 19-43.
Baker, R. A., Simon, J.R., & Bazeli, F.P. (1986). An assessment of the learning style preferences of accounting majors. Issues in Accounting Education, 1(1), 1-12.
Baldwin, B.A. & Reckers (1984). Exploring the role of learning style research in accounting education policy.
Journal of Accounting Education, 2(2), 63-76. https://doi.org/10.1016/0748-5751(84)90006-X
Beare, R. (1992). Software tools in science classrooms. Journal of Computer Assisted Learning, 8, 221-230. https://doi.org/10.1111/j.1365-2729.1992.tb00407.x
Beare, R. (1993). How spreadsheets can aid a variety of mathematical learning activities from primary to tertiary level. Technology in Mathematics Teaching: A Bridge Between Teaching and Learning, B. Jaworski. Birmingham, U.K.: 117-124.
Brown, H.D. & Burke, R.C. (1987). Accounting education: A learning styles study of professional-technical and
future adaptation issues. Journal of Accounting Education, 5(2), 187-206.
https://doi.org/10.1016/0748-5751(87)90018-2
Chan, Y.E., & Storey, V.C. (1996). The use of spreadsheets in organizations: Determinants and consequences.
Information Management, 31, 119-134. https://doi.org/10.1016/S0378-7206(96)00008-0
Collins, J. H. & Milliron, V.C. (1987). A measure of professional accountants’ learning style. Issues in Accounting Education, 2(2), 193-206.
Condon, R. (2006, Oct.). Spreadsheet mayhem. Management Today, 59-63.
Dania, A., & Posey, C. (2012), Accounting Students Opinions towards use of Spreadsheets as an Instructional Tool.
Journal of Business, Industry and Economics, 17, 47-61.
Dania, A., Simpson, C.L., Hurt, K. & Johnk, D. (2007). Student Opinion towards Spreadsheets as a Teaching Tool. National Business and Economics Society Chapter Papers and Proceedings.
Daniel, W.W. (1990). Applied nonparametric statistics. Boston, MA: Houghton Mifflin.
Evans, J.R. ( 2000). Spreadsheets as a tool for teaching simulation. INFORMS Transactions on Education, 1(1), 27-37. Retrieved December 24, 2006, from http://ite.pubs.informs.org/Vol1No1/Evans/Evans.pdf
Goddard, J. A. Romilly, P.J. & Tavakoli, M. (1995). Macroeconomics and information technology applications.
Computers in Higher Education Review, 9(1), Retrieved December 15, 2006, from http://www.economics.ltsn.ac.uk/cheer/ch9_1/ch9_1p06.htm
Gray, G.L. (2006). An array of technology tools. Internal Auditor, 63(4), 56-62.
Ghani, J. A., & D'Mello, J. P. (1993). Spreadsheets in financial education: Balancing the challenges. Financial Practice & Education, 3(1), 65-71.
Hodara, M. (2013). Improving Students’ College Math Readiness – A review of the evidence. Northwest
Education. Retrieved September, 2, 2018, from
https://educationnorthwest.org/sites/default/files/resources/improving%20college%20math%20readiness_0.pdf Jones, K. (2005). Using spreadsheets in the teaching and learning of mathematics: A research bibliography.
MicroMath, 21(1), 30-31.
Kolb, D. (1984). Experiential learning. Englewood Cliffs, NJ: Prentice Hall.
Lacher, J. (1997). The power of spreadsheets. Journal of Accountancy, 183(5), 66-72. Lewis, P. (2001). Use Spreadsheets to Teach Mathematics and Meet Standards. NECC2001.
Mayes, T.R. & Shank, T.M. (2010). Financial Analysis with Microsoft Excel. Mason, OH: South-Western Cengage Learning.
Pemberton, J.D. & Robson, A.J. (2000). Spreadsheets in business. Industrial and Data Management Systems, 100(8), 379-388. https://doi.org/10.1108/02635570010353938
Peterson, B. and Reider, B. (2002). Perceptions of Computer Based Testing: A Focus on CFM Examination. Journal of Accounting Education, 20(3), 265-284. https://doi.org/10.1016/S0748-5751(02)00015-5
Powell, S.G. (1997). Leading the Spreadsheet Revolution. OR/MS Today, 24, 6, 8-9.
Powell, S.G. (1997). The Teachers’ Forum: From Intelligent Consumer to Active Modeler, Two MBA Success Stories. Interfaces, 27(3), 88-98. https://doi.org/10.1287/inte.27.3.88
Ramsden, P., & Entwistle, N. J. (1981). Effects of academic departments on students’ approaches to studying. British Journal of Educational Technology, 34(1). https://doi.org/10.1111/j.2044-8279.1981.tb02493.x
Rojano, T. (1996). Developing algebraic aspects of problem solving within a spreadsheet environment. In: N. Bednarz, C. Kieran, & L. Lee (Eds.). Approaches to Algebra: perspectives for research and teaching (pp. 137-145). Dordrecht: Kluwer Academic Publishers. https://doi.org/10.1007/978-94-009-1732-3_9
Savage, S. (1997). Weighting the PROS and CONS of Decision Technology in Spreadsheets. OR/MS Today, 24(1), 42-45.
Simpson, C.L., Pollacia, L., Speers, J., Willis, T.H., & Tarver, R. (2003), An analysis of certain factors related to the use of Powerpoint. Communications of the International Information Management Association, 3(2). Retrieved January 5, 2007, from http://www.iima.org/CIIMA/CIIMA%20V3%20N2%205%20Simpson.pdf
Sinclair, M. (1998), Algebraic problem solving using spreadsheets: A unit for grade 9,
http://mathforum.org/workshops/sum98/participants/sinclair/problem/intro.html.
Sutherland, R. & Rojano, T. (1993). A spreadsheet approach to solving algebra problems. Journal of Mathematical Behaviour, 12(4), 351-383.
Thiriez, H. (2001). Improved OR education through the use of spreadsheet models. European Journal of Operational Research, 135, 461-476. https://doi.org/10.1016/S0377-2217(01)00099-6
Togo, D.F. & Baldwin, B.A. (1990). Learning style: A determinant of student performance for the introductory financial accounting course. Advances in Accounting, 8, 189-190.
Wilson, R.M.S. & Hill, A.P. (1994). Learning styles: A literature guide. Accounting Education: An International Journal, 3(4), 349-358.https://doi.org/10.1080/09639289400000033
Windows Central. (2016). There are now 1.2 billion Office users and 60 million Office 365 commercial customers.
Retrieved September, 2, 2018, from
https://www.windowscentral.com/there-are-now-12-billion-office-users-60-million-office-365-commercial-cust omers.
Notes
Appendix 1: Student questionnaire
Student questionnaire is designed to assess student opinion towards the use of spreadsheets in accounting classes. The questionnaire is based on a previous study done by Dania et al. (2007), and Simpson et al. (2003). A five-point ordinal scale ranging from “strongly agree” to “strongly disagree” is used, (SA – Strongly agree, A – Agree, N – Neutral, D – Disagree, and SA – Strongly disagree).
I. Learning
Question SA (5) A (4) N (3) D (2) SD (1)
1
Lecture using Excel examples help me understand the subject matter better compared to the lecture using the chalkboard method.
2
I understand the subject matter better by means of a lecture using Excel compared to a chalkboard method-based lecture.
3
Being able to review Excel solutions after the lecture helps me reinforce my understanding of the subject matter.
II. Lecture
Question SA (5) A (4) N (3) D (2) SD (1)
4
I feel that the pace of the course is faster in Excel based lecture than compared to chalkboard-based lecture.
5
Excel based lecture motivate more subject matter-based discussion compared to chalkboard-based lecture.
6
I prefer when the instructor balances Excel examples with a chalkboard based lecture.
7
I prefer when the instructor combines Excel examples with other class activities in a lecture (e.g., discussion, classroom work on projects, exercises, etc.).
8
I prefer when Excel examples that are to be used in the lecture are handed out to me before the lecture.
III. Motivation
Question SA (5) A (4) N (3) D (2) SD (1)
9
Excel examples add interest to the subject matter.
10
IV. Perception
Question SA (5) A (4) N (3) D (2) SD (1)
11
The use of Excel examples in the lecture helps me pass a course.
12
I prefer when the instructor uses a chalkboard lecture compared to the Excel-based lecture.
13
Use of Excel examples in lecture help me ask relevant questions about the subject matter.
14
Compared to the Excel-based lecture, there is less face-to-face instructor-student interaction when the instructor uses the chalkboard for lecturing.
15
All things considered, I would regard the use of Excel as a positive aspect of a course.
16
All things considered, I would take another course that uses Excel for lecturing.
17
Overall, I prefer a lecture that uses Excel over a lecture using a chalkboard.
V. Presentation
Question SA (5) A (4) N (3) D (2) SD (1)
18
Excel text on the screen is large enough to read.
19
The lighting in the classroom is bright enough for taking notes when using Excel on an overhead projector.