Dynamic time warping for classifying lameness in cows
Apinan, A.
1*, and S. Kuankid
2(1.Faculty of Engineering, Mahasarakham University, Kantharawichai district, Maha Sarakham, 44150, Thailand
2.Faculty of Science and Technology Nakhon Pathom Rajabhat University 85 Malaiman Road, Muang, Nakhon Pathom 73000 Thailand)
Abstract: Lameness in dairy cows is one of the most significant welfare and productivity issue. This work is mainly concerned with an automated detecting system for classifying lameness in dairy cows. In the proposed system, Dynamic Time Warping (DTW) is used to measure the similarity between two-time series. The first time series is the behavioral time periods of the cow used as the templates, which was collected while the cow was sound. The second time series is the behavioral time periods of the cow on each day used for testing. This process results in accumulated distance that is compared with a threshold value for classifying lameness. In the case of studies, three cows were used in experiments. The classified results show that the proposed algorithm can correctly classify lame and non-lame cows.
Keywords: lameness, behavioral time periods of cows, dynamic time warping.
Citation: Apinan, A., and S. Kuankid. 2016. Dynamic time warping for classifying lameness in cows. Agricultural Engineering International: CIGR Journal, 18(3):350-357.
1 Introduction
1Lameness in
dairy cows is highly prevalent andpainful. These impacts potentially affect not only animal
welfare (Klaas et al., 2003) but also farm economies
(Enting et al., 1997). Lameness causes losses in milk
production and leads to an early culling of animals
(Green et al., 2002).
Nowadays, the most common methods used for
lameness detection and assessment are various visual
locomotion scoring systems (Winckler and Willen, 2001;
Flower and Weary, 2006). However, such method
requires experience to be conducted properly, this is very
labor intensive as an on-farm method, and the results are
subjective (Winckler and Willen, 2001).
In literature, several authors have addressed the
problems of lameness by developing the automated
system.
The first automated system used a force plate to
measure the ground reaction forces when cows walking
Received date: 2016-03-05 Accepted date: 2016-05-26
*Corresponding author: Apinan, A., Faculty of Engineering, Mahasakham University, Thailand 44150, Email: [email protected]
(Rajkondawar et al., 2002) and was developed to measure
weight distribution while standing (Neveux et al., 2006;
Pastell et al., 2006; Rushen et al., 2007; Pastell and
Madsen, 2008). Due to lameness reflects pain while
walking, weight distribution during the cow standing
might not always reflect the lameness while walking
(Leach et al., 2010).
In further studies, Flower et al. (2005) were the first
to use vision techniques with body markers to measure
temporal and spatial gait characteristics in cows related to
lameness. Song et al. (2008) used video images of
walking cows without body markers to automatically
measure step overlap as a relevant gait characteristic for
lameness detection. There has been related studies using
computer vision to analyze gait feature and posture
variables that are back arch curvature (Poursaberi et al.,
2010; Viazzi et al, 2014), step overlap (Pluk et al., 2010),
hoof release angles (Pluk et al., 2012), the body
movement pattern (Poursaberi et al., 2011) and was
developed by a three-dimensional (3D) camera (Van
hertem, et al., 2014). However, such systems are limited
to measure a single or few steps and need fixed location
to perform measurements, which are difficult in practice.
improved in the case of measurement of the gait features
from several consecutive steps from a walking cow.
In a different way, accelerometers were used to
measure the activity or gait features of cows and their
relation to lameness. Pastell et al. (2009) used a
custom-made wireless 3D accelerometer system to
measure temporal gait characteristics on all 4 limbs of the
cows. Differences in symmetry variance and forward
acceleration were observed between lame and non-lame
cows. Although this technique does not need to fix
location, it requires four embedded systems to measure
the gait characteristics. Alsaaod et al. (2012) used
accelerometer attached to one of the front legs of the
cows to measure activity and lying behavior. They were
able to predict lameness in cows with an accuracy of 76%
based on deviations from normal behavior. However, this
technique needs many parameters in a process such as
step impulses, lying time, numbers of bouts, the median
of the duration for one bout period, the minimal and
maximal duration of one bout.
From the literature above, the aim of this work is
intended to diagnose the lameness of cows. The behavioral
time periods of the cow in each day are measured the
similarity with those of the cow collected while the cow
was sound by using DTW. The results of this process can
predict that cow is lame or non-lame.
This paper is organized as follows: Section II gives the
material for measuring the behavioral time periods of a
cow and the method for classifying lameness in cows.
Section III shows the experimental results for the
classification success rate. Finally, Section IV concludes
the studied results of the proposed system.
2 Material and method
2.1 Measuring the behavioral time periods of a cow
In this subsection, we explain the method for
measuring the behavioral time periods of a cow based on
a simple classification technique (Apinan et al. 2015).
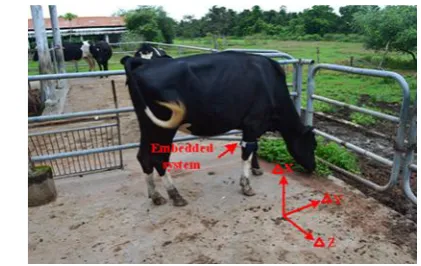
The embedded system was fitted around a leg of the cow
as shown in Figure 1. For the relationship between the
acceleration and the angle of each axis, when the cow is
standing, the Y and Z-axis are perpendicular to a leg
while the X-axis is perpendicular to the ground.
Figure 1 Embedded system attached around a leg of the
cow.
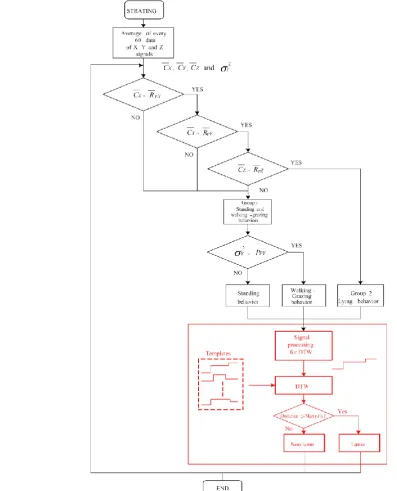
Considering the flowchart in Figure 2, every 60 data
(60 seconds) the average of each axis is found as ̅̅̅, ̅̅̅,
and ̅̅̅ and then is compared with references of each
axis ̅ ̅ , and ̅ , respectively. Thus, the results
of decision tree process, the cow behaviors are classified
into two groups: 1) standing and walking-grazing
behaviors and 2) lying behavior. While the behavioral
classification in group 1, the acceleration signals of
standing behavior are similar to those of walking-grazing
behavior. Therefore, it is difficult to use the average of
the accelerometer signals in classification. However, the
variance of the acceleration signal of Y-axis, , while
the cow is walking-grazing is higher than while standing.
Thus, the variance of the Y-axis is used for classifying
the both behaviors.
2.2 Classification of lameness in cows
2.2.1 Signal preprocessing for DTW
After the accelerometer data were classified into
behaviors in the form of time as shown black boxes of the
flowchart in Figure 2.
Let us consider the red boxes in Figure 2, we start at
the behavioral time periods of the cow that are converted
2.3 Classification of lameness in cows
2.3.1 Signal preprocessing for DTW
(1)
Figure 3 shows the transform of the behavioral time
periods of the cow. The vertical and horizontal axes are
the voltage level and time, respectively.
Time (minute) V
0 1.5
1 2 3
2.5 3
Lying
Standing
Walking-grazing
480
Figure 3 Behavioral time periods of the cow.
2.2.2 Dynamic time warping
Dynamic time warping is an algorithm for
measuring the similarity between two-time series, which
the path through the observations that would lead to the
minimum global cost by minimizing the local cost. By
continually minimizing the local cost through using
dynamic programming, a global minimal error
measurement is achieved. In mathematical terms, the
global cost matrix D between two-time series is created
by the Equation:
( ) ( ) ( )* , (
,( ) ( )-+ (2)
Where ( ) is the local cost between frame of the
first series and frame of the second series, ( ) is
the set of possible previous costs to and is the cost
function (Giorgino. 2009). Each element in matrix
contains the minimum error between frames and
based on adding the local cost ( ) to the minimum
error of frames ( ), ( ) and ( ).
Hence, the bottom-right value of the matrix would
yield the minimum global error between the two-time
series and that is reached by minimizing the local errors
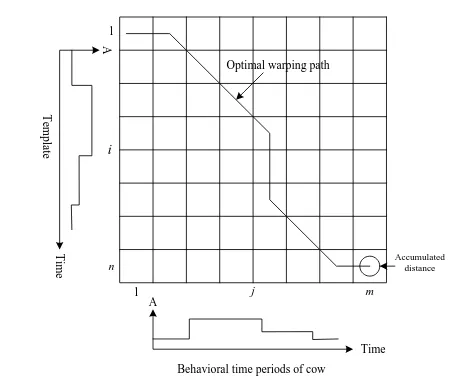
between the two-time series. Figure 4 shows the
accumulated cost matrix and optimal warping path of
DTW where the vertical axis is the template or the
behavioral time periods of the cow collected while the
cow was sound and the horizontal axis is the behavioral
time periods of the cow for testing. For the data number,
we set the behavioral time periods of the cow at 480
minutes ( ).
i 1 n T em p la te T im e A j 1 m
Behavioral time periods of cow Time A
Accumulated distance Optimal warping path
Figure 4 Accumulated cost matrix and optimal warping
path
.
2.2.3 Threshold for classifying lameness
The templates of behavioral time periods of the cow
were measured while the cow was sound. One template
can be used for processing in classification. However, in
each day, the sound cow may little change the behavioral
time periods. This may cause errors in classified
processing. Therefore, to improve an accuracy of
classification rate, N templates should be used. Each
template is measured similarity to another template. This
process results the set of accumulated distances,
where n is 1, 2… ( ) .
The value of accumulated distances in the set of
should be low because it indicates similarity of all
templates. Thus, the maximum value of accumulated
distances in the set of could be used as a threshold for
classifying lameness.
2.2.4 Templates versus behavioral time periods for testing
The behavioral time periods of the cow in each day
or signal for testing are measured similarity to each
template. If there is an accumulated distance lower than
the threshold, it means that the signal for testing is similar
to a template. The result is that the cow is normal. On the
other hand, if all results of accumulated distance are
higher than the threshold, it means that the signal for
testing is different from the templates. The result of the
system will be shown that the cow is developing in
lameness.
3 Experimental results
The experiments were tested at the Mahasarakarm
University in Thailand with three cows. The cows were
released from the corral for looking for grass in the field
during 8.00 AM - 4.00 PM. In the first step, the reference
voltage averages of each axis for classifying the standing
and walking-grazing activities from the lying activity
were found as ̅ , ̅ , and ̅ .
While the reference variance value of the Y-axis for
classifying the standing and the walking-grazing activities
In the second step, we examine the experiments of
the proposed algorithm for classifying lameness by three
cases as follows:
1) The first case with the cow#1, the behavioral time
periods of the cow while cow#1 was sound recorded to be
templates. Figure 5 shows the examples of the behavioral
time periods on the first and second day. These signals
were measured similarity by using DTW. The result of
this process shows that the accumulated distance is equal
to 1.25 as shown in Figure 6. While on the third-tenth day,
the cow was still sound. The behavioral time periods of
the cow during these days shows little changed. Therefore,
the DTW process results in the maximum of accumulated
distance as 1.45. This value can be used as the threshold
for classifying its lameness.
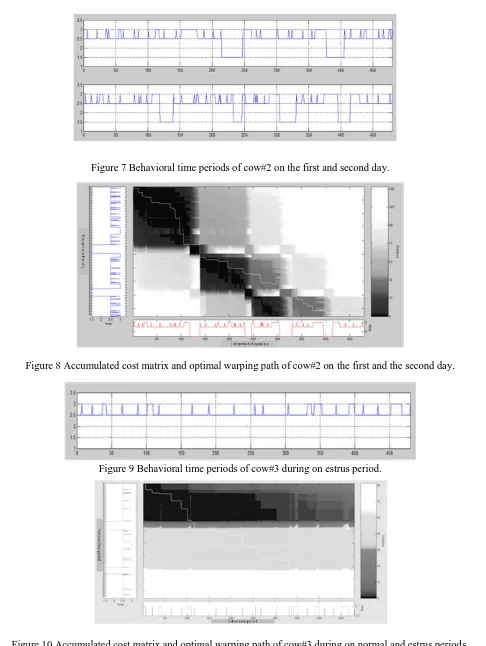
2) The second case with cow#2, the behavioral time
periods during the first and second day is shown in Figure
7. While Figure 8 shows accumulated cost matrix and
optimal warping path. In this case, we know that the cow
was developing lameness during the first-fourth day. We
used DTW for measuring the similarity of the behavioral
time periods on these days. We found that the maximum
of accumulated distance is 36.75. This value is high
because of the difference of signals.
Figure 5 Behavioral time periods of cow#1 on the first and second day.
On the fifth day, the cow became normal. We used
DTW measuring the similarity between the behavioral
time periods on the fifth day with those on the first-fourth
day. The results of these processes, the accumulated
distances are 4.75, 30.35, 20.75 and 5.55 respectively.
While the maximum value of accumulated distances of
the behavioral time periods during the fifth-tenth day is Figure 7 Behavioral time periods of cow#2 on the first and second day.
Figure 8 Accumulated cost matrix and optimal warping path of cow#2 on the first and the second day.
Figure 9 Behavioral time periods of cow#3 during on estrus period.
1.55. This result shows that it could be used as the
threshold for classifying lameness.
3) In the third case with cow#3, we recorded the
behavioral time periods for 5 days before the cow is in
estrus period. The behavioral time periods of these days
were processed by the proposed algorithm resulting in the
maximum value of accumulated distances as 1.45. This
value is used as the threshold for classifying lameness.
Furthermore, it can be used as the threshold for
classifying estrus. Figure 9 shows the behavioral time
periods of the cow during estrus period. Note that when a
cow is an estrus, not lying. Figure 10 shows the
accumulated cost matrix and optimal warping path during
the cow is normal and in estrus period.
The accumulated distance is much higher than 1.45.
4 Conclusions
This paper presented the technique for classifying
lameness by using behavioral time periods of a cow. In
the proposed technique, the behavioral time periods of the
cow used as the templates which were recorded while the
cow was sound. These templates are used to measure
similarity with the behavioral time periods of the cow on
each day by using Dynamic Time Warping. The
maximum of accumulated distances, the threshold value
for classifying lameness, is found by measuring the
similarity of all templates. The results of classification
show that the proposed algorithm can correctly classify
lameness in cows. Furthermore, it can be still used for
classifying cow in estrus period.
Acknowledgments
This research was financially supported by
Mahasarakham University (2015).
References
Alsaaod, M., C. Romer, J. Kleinmanns, K. Hendriksen, S. Rose-Meierhofer, L. Plumer, and W. Buscher. 2012. Electronic detection of lameness in dairy cows through measuring pedometric activity and lying behavior. Applied Animal Behaviour Science, 142(3-4): 134-141.
Apinan, A., T. Rattanawong, and S. Kaunkid. 2015. Classification of the cattle behaviors by using magnitude and variance of accelerometer signal. Agricultural Engineering International: CIGR Journal, 17(4): 415-420.
Enting, H., D. Kooij, A. A. Dijkhiuzen, R. B. M. Huirne, and E. N. Noordhuizen-Stassen. 1997. Economic losses due to clinical lameness in dairy cattle. Livestock Production Science, 49(3): 259-267.
Flower, F. C., D. J., Sanderson, and D. M. Weary. 2005. Hoof pathologies influence kinematic measures of dairy cow gait.
Journal of Dairy Science,88(9): 3166-3173.
Flower, F. C. and D. M. Weary. 2006. Effect of hoof pathologies on subjective assessments of dairy cow gait. Journal of Dairy Science,89(1): 139-146.
Giorgino, T. 2009. Computing and Visualizing Dynamic Time Warping Alignments in R: The dtw Package. Journal of Statistical Software, 31(7): 1-24.
Green, L. E., V. J. Hedges, Y. H. Schukken, R. W. Blowey, and A. J. Packington. 2002. The impact of clinical lameness on the milk yield of dairy cows. Journal of Dairy Science, 85(9): 2250-2256.
Klaas, I. C., T. Rousing, C. Fossing, J. Hindhede, and J. T. Sørensen. 2003. Is lameness a welfare problem in dairy farms with automatic milking systems? Animal Welfare,
12(4): 599-603.
Leach, K. A., H. R. Whay, C. M. Maggs, Z. E. Barker, E. S. Paul, A. K. Bell, and D. C. J. Main. 2010. Working towards a reduction in cattle lameness: 1. Understanding barriers to lameness control on dairy farms. Research in Veterinary Science, 89(2): 311-317.
Neveux, S., D. M. Weary, J. Rushen, M. A. von Keyserlingk, and A. M. de Passillé. 2006. Hoof discomfort changes how dairy cattle distribute their body weight. Journal of Dairy Science,
89(7): 2503-2509
Pastell, M. A. M. Aisla, M. Hautala, V. Poikalainen, J. Praks, I. Veermae, and J. Ahokas. 2006. Contactless measurement of cow behavior in a milking robot. Behavior Research Method, 38(3): 479-483.
Pastell, M. and H. Madsen. 2008. Application of CUSUM charts to detect lameness in a milking robot. Expert System with Application, 35(4): 2032-2040.
Pastell, M., M. J. Tiusanen, M. Hakojärvi, and L. Hänninen. 2009. A wireless accelerometer system with wavelet analysis for assessing lameness in cattle. Biosystems Engineering, 104(4): 545-551.
Pluk, A., C. Bahr, A. Poursaberi, W. Maertens, A. van Nuffel, and D. Berckmans. 2012. Automatic measurement of touch and release angles of the fetlock joint for lameness detection in dairy cattle using vision techniques. Journal of Dairy Science, 95(4): 1738-1748.
Poursaberi, A., C. Bahr, A. Pluk, A. Van Nuffel, and D. Berckmans. 2010. Real-time automatic lameness detection based on back posture extraction in dairy cattle: shape analysis of cow with image processing techniques. Computers and Electronics in Agriculture, 74(1): 110-119.
Poursaberi, A., C. Bahr, A. Pluk, D. Berckmans, I. Veermäe, E. Kokin, and V. Pokalainen. 2011. Online lameness detection in dairy cattle using Body Movement Pattern (BMP). In Proceedings of the 11th International Conference on Intelligent Systems Designs and Applications, Cordoba, Spain, 22–24 November 2011: 732-736.
Rajkondawar P. G., U. Tasch, A. M. Lefcourt, B. Erez, R. M. Dyer, and M. A. Varner. 2002. A system for identifying lameness in dairy cattle. Applied Engineering Agriculture, 18(1): 87-96.
Rushen, J., E. Pombourcq, and A. M. de Passille. 2007. Validation of two measures of lameness in dairy cows. Applied Animal Behaviour Science, 106(1-3): 173-177.
Song, X. Y., T. Leroy, E. Vranken, W. Maertens, B. Sonck, and D. Berckmans. 2008. Automatic detection of lameness in dairy cattle – vision-based track way analysis in cow’s locomotion. Computers and Electronics in Agriculture,
64(1): 39-44.
Van Hertem, T., M. Steensels, S. Viazzi, C. Bahr, C. E. B. Romanini, C. Lokhorst, A. Schlageter-Tello, E. Maltz, I. Halachmi, and D. Berckmans. 2014. Effect if cow traffic on an implemented automatic 3D vision monitor for dairy cow locomotion. In Proceedings of the 65th Annual Meeting of the European Federation of Animal Science, Copenhagen, Denmark, 25-29. August 2014.
Viazzi, S., C. Bahr, T. Van Hertem, A. Schlageter-Tello, C. E. B. Romanini, I. Halachmi, C. Lokhorst, and D. Berckmans. 2014. Comparison of a three-dimensional and two-dimensional camera system for automated measurement of back posture in dairy cows. Computers and Electronics in Agriculture, 100(1): 139-147.