RESEARCH
MYC deregulates TET1 and TET2 expression
to control global DNA (hydroxy)methylation
and gene expression to maintain a neoplastic
phenotype in T-ALL
Candace J. Poole
1, Atul Lodh
1, Jeong‑Hyeon Choi
2and Jan van Riggelen
1*Abstract
Background: While aberrant DNA methylation is a characteristic feature of tumor cells, our knowledge of how these DNA methylation patterns are established and maintained is limited. DNA methyltransferases and ten‑eleven translo‑ cation methylcytosine dioxygenases (TETs) function has been found altered in a variety of cancer types.
Results: Here, we report that in T cell acute lymphoblastic leukemia (T‑ALL) the MYC oncogene controls the expres‑ sion of TET1 and TET2 to maintain 5‑methylcytosine (5mC) and 5‑hydroxymethylcytosine (5hmC) patterns, which is associated with tumor cell‑specific gene expression. We found that cellular senescence and tumor regression upon MYC inactivation in T‑ALL was associated with genome‑wide changes in 5mC and 5hmC patterns. Correlating with the changes in DNA (hydroxy)methylation, we found that T‑ALL overexpress TET1, while suppressing TET2 in a MYC‑ dependent fashion. Consequently, MYC inactivation led to an inverse expression pattern, decreasing TET1, while increasing TET2 levels. Knockdown of TET1 or ectopic expression of TET2 in T‑ALL was associated with genome‑wide changes in 5mC and 5hmC enrichment and decreased cell proliferation, suggesting a tumor promoting function of TET1, and a tumor suppressing role for TET2. Among the genes and pathways controlled by TET1, we found ribosomal biogenesis and translational control of protein synthesis highly enriched.
Conclusions: Our finding that MYC directly deregulates the expression of TET1 and TET2 in T‑ALL provides novel evidence that MYC controls DNA (hydroxy)methylation in a genome‑wide fashion. It reveals a coordinated interplay between the components of the DNA (de)methylating machinery that contribute to MYC‑driven tumor maintenance, highlighting the potential of specific TET enzymes for therapeutic strategies.
Keywords: MYC, TET1, TET2, DNA methylation, DNA hydroxymethylation, Leukemia/lymphoma
© The Author(s) 2019. This article is distributed under the terms of the Creative Commons Attribution 4.0 International License (http://creat iveco mmons .org/licen ses/by/4.0/), which permits unrestricted use, distribution, and reproduction in any medium, provided you give appropriate credit to the original author(s) and the source, provide a link to the Creative Commons license, and indicate if changes were made. The Creative Commons Public Domain Dedication waiver (http://creat iveco mmons .org/ publi cdoma in/zero/1.0/) applies to the data made available in this article, unless otherwise stated.
Background
The MYC oncogene is involved in the pathogenesis of 60–70% of all human cancers, including T cell acute lymphoblastic leukemia (T-ALL) (reviewed in [1, 2]). MYC encodes for a transcription factor that controls the expression of a large number of genes, thereby deregulat-ing a variety of cellular processes, ultimately leadderegulat-ing to autonomous cell proliferation, growth, and angiogenesis,
while blocking cellular differentiation (reviewed in [3, 4]). Its wide implications in human tumorigenesis and the notion that tumors can be dependent on enhanced MYC expression, exhibiting oncogene addiction, make the oncogene and its network a highly promising target for therapeutic strategies [5–7].
While the many functions of MYC were first attrib-uted to its ability to both activate and repress transcrip-tion of a large number of genes through direct binding to their promoters, more and more reports challenge this dogma. In the classic model, MYC, heterodimerized with MAX, recognizes a DNA-motif named E-box (CAC GTG
Open Access
*Correspondence: [email protected]
1 Department of Biochemistry and Molecular Biology, Augusta University, 1410 Laney‑Walker Blvd., Augusta, GA 30912, USA
), thereby transactivating canonical target genes through recruitment of chromatin-modifying cofactors [8, 9]. At the same time, through interactions with other tran-scription factors such as MIZ-1, the transactivating func-tion of MYC-MAX can be fine-tuned, or even inverted to repress the transcription of genes harboring an INR DNA-motif (reviewed in [10]). Furthermore, MYC has been demonstrated to bind virtually all active promot-ers and many enhancpromot-ers, thereby boosting the transcrip-tional output of a given cell through various mechanisms [11–14]. In parallel, it has been emerging that MYC regulates chromatin structure in a genome-wide fashion [15–18], suggesting a mechanism that extends beyond the classic model of a site-specific transcription factor (reviewed in [19]).
We and others have demonstrated that cellular senes-cence accompanied by extensive chromatin remod-eling is an important mechanism of tumor regression upon MYC inactivation in T-ALL, and other cancer types [16, 20, 21]. During this process, broad changes occur in histone methylation (increase of H3K9me3) and acetylation (decrease of H4ac), suggesting that dur-ing tumor maintenance MYC maintains large areas of active chromatin. Consequently, MYC inactivation is associated with genome-wide changes in the epigenetic landscape. Indeed, there is growing evidence that MYC induces genome-wide alterations in chromatin in order to elicit its neoplastic properties (reviewed in [19]). As first evidence, N-MYC transcriptional upregulation of the histone acetyltransferase, GCN5, was reported to cause genome-wide acetylation of histones [15]. Simi-larly, we reported that MYC inactivation in T-ALL trig-gers genome-wide changes in histone acetylation and methylation associated with cellular senescence and tumor regression [16]. Furthermore, MYC recently has been shown to suppress chromatin regulators, SIN3B, HBP1, SUV420h1, and BTG via the miR-17-92 cluster [17]. Together, these results indicate that MYC controls genome-wide chromatin domains through modulating the expression of chromatin-modifying enzymes in order to create an epigenetic landscape that favors neoplastic gene expression programs.
Despite the recent reports teasing out the function of MYC as global regulator of transcription, it remains elu-sive how MYC establishes and maintains DNA methyla-tion as an important component of chromatin structure. Tumor cells typically display global hypomethylation of repetitive DNA elements which contributes to genomic instability, while promoter and CpG island hypermethyl-ation extinguish transcription of tumor suppressor genes. DNA methylation as 5-methylcytosine (5mC) is estab-lished by de novo DNA methyltransferases (DNMTs), DNMT3A and DNMT3B, while DNMT1 preferentially
binds hemi-methylated DNA and maintains methyla-tion to prevent passive demethylamethyla-tion (reviewed in [22]). Aberrant DNA methylation is a characteristic feature of tumor cells and is known to contribute to tumorigen-esis in human neoplasia [23–25]. Shedding light on how MYC controls DNA methylation in T-ALL and Burkitt lymphoma, we recently reported that MYC causes the overexpression of DNMT3B, maintaining specific 5mC and thus gene expression patterns which are important for tumor maintenance [26]. However, the role of ten-eleven translocation methylcytosine dioxygenases (TETs) in this context remained elusive.
TET enzymes convert 5mC to 5-hydroxymethylcyto-sine (5hmC) and other cyto5-hydroxymethylcyto-sine intermediates (5-for-mylcytosine (5fC) and 5-carboxycytosine (5caC)), which contribute to the process of active DNA demethylation through base excision repair processes. Opposite to the repressive effects 5mC often has at promoters, the enrichment of 5hmC at gene promoters correlates with increased gene expression [27–30]. It has been reported that genome-wide distribution of 5hmC is overall reduced in neoplastic tissue and tumor cell-specific 5hmC occurs at specific gene coding regions, revealing the importance of 5hmC in modulating gene expression [27, 31]. However, much remains elusive how 5mC and 5hmC patterns contribute to the deregulation of gene expression during MYC-driven tumorigenesis and tumor maintenance.
Understanding the molecular mechanisms how tumor cell-specific DNA (hydroxy)methylation patterns are established and maintained by MYC may provide novel therapeutic strategies, aiming at specific components of the DNA (de)methylating machinery. Here, we report that in T-ALL, the MYC oncogene controls the expres-sion of both TET1 and TET2, which in turn contribute to tumor cell-specific 5mC and 5hmC patterns in a genome-wide fashion with importance for tumor maintenance.
Results
Tumor regression upon MYC inactivation in T‑ALL
is associated with genome‑wide changes in DNA (hydroxy) methylation patterns
MYC deregulates the expression of methylation modifi-ers, DNMT3B and DNMT1, essential for tumor mainte-nance [26]. Together, these findings suggest that during tumor maintenance MYC maintains large domains of active chromatin, and that tumor regression upon MYC inactivation is tightly linked to changes in expression of chromatin modifiers resulting in genome-wide changes to chromatin structure.
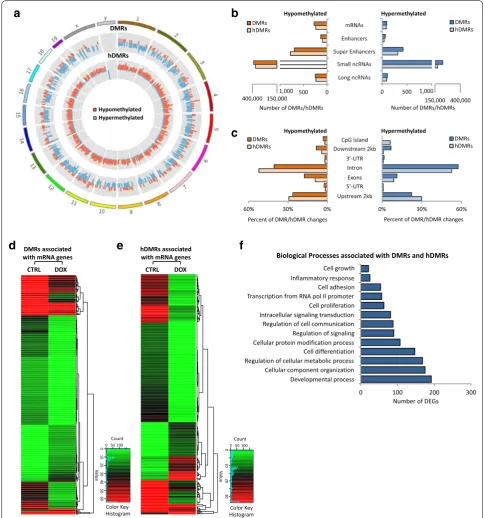
To determine the effect MYC inactivation in tumors has on DNA methylation (5mC) and hydroxymethyla-tion (5hmC), we carried out methylated DNA immuno-precipitation (MeDIP- and hMeDIP-seq, respectively) analysis, taking advantage of the tetracycline-regu-lated c-myc allele in T-ALL cells derived from EµSRα -tTAα;tet-o-MYC mice (Fig. 1). We compared mouse T-ALL cells (6780) in vitro before (CTRL) and upon inactivation of MYC by adding 20 ng/mL doxycycline (+DOX) to the culture medium for 2 days. MYC inacti-vation was validated by RT-qPCR (Additional file 1: Fig. S1). For each sample, 45–60 million Illumina sequenc-ing reads were generated. Of these, ~ 45–80% were suc-cessfully mapped to either strand of the mouse genome (mm10). To identify significantly differentially methyl-ated regions (DMRs) and differentially hydroxymethyl-ated regions (hDMRs), we performed a genome-wide, unbiased DMR and hDMR detection using a complete tiling of the mouse genome using a cutoff of log2FC ≥ 1 with a P value of ≤ 10−4.
We identified a total of 615,875 DMRs and 545,504 hDMRs that become significantly hypo- or hypermeth-ylated upon MYC inactivation for 2 days. The genomic location of DMRs and hDMRs between MYC on and off states, displayed as circular plot, indicates genome-wide changes in 5mC and 5hmC distribution (Fig. 1a). We next mapped the DMRs and hDMRs (both hypo- and hyper-methylated) to the annotated RefSeq genes in the mouse genome. We found 366 and 323 DMRs and hDMRs asso-ciated with mRNAs, 186 and 123 with enhancers, 1113 and 1093 with super-enhancers, 613,839 and 543,625 with small noncoding RNAs (ncRNAs), and 358 and 326 with long ncRNAs, respectively (Fig. 1b). We further annotated DMRs and hDMRs associated with protein-coding genes for cis-regulatory elements. Of the those DMRs and hDMRs, we found 3.11% and 1.78% associated with CpG islands, 17.46% and 9.20% with exons, 40.67% and 52.23% introns, 4.07% and with 3.26% 5′- or 3′-UTRs, and 34.69% and 33.53% with sequences 2 kbp or more upstream or downstream of the nearest gene, respec-tively (Fig. 1c). The fold change of DMRs and hDMRs associated with protein coding genes is displayed as heat-map, respectively (Fig. 1d, e). Of the 366 and 323 genes associated with DMRs and hDMRs, we found 275 and
240 to increase, and 91 and 83 to decrease in (hydroxy) methylation, respectively.
To determine the biological processes associated with DNA methylation changes upon MYC inactivation in T-ALL, we performed gene ontology analysis using the Database for Annotation, Visualization and Integrated Discovery (DAVID). Consistent with MYC’s broad reach, we found a wide variety of processes associated with DMRs and hDMRs, ranging from regulation of cell growth and proliferation, to differentiation and metabo-lism (Fig. 1f and Additional file 3). Taken together, the MeDIP- and hMeDIP-seq analyses reveal genome-wide changes in 5mC and 5hmC distribution associated with a wide variety of biological processes upon MYC inactiva-tion, indicating that MYC maintains tumor cell-specific DNA (hydroxy)methylation patterns in T-ALL.
TET1 and TET2 expression levels in T‑ALL are
MYC‑dependent and are inversed upon MYC inactivation
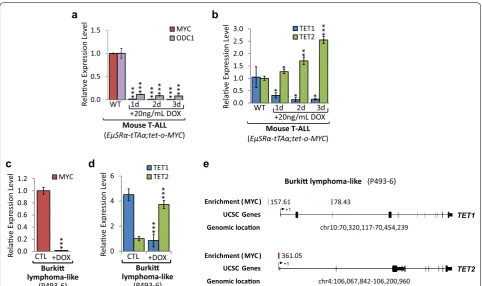
We previously reported that MYC causes the overex-pression of DNMT1 and DNMT3B in T-ALL, thereby establishing and maintaining specific 5mC and thus gene expression patterns [26]. To further investigate the mechanism underlying global 5mC and 5hmC changes upon MYC inactivation, we performed gene expres-sion profiling for TET enzymes (Fig. 2). We compared T-ALL cells (6780) derived from EµSRα-tTAα;tet-o-MYC mice, harboring a tetracycline-regulated c-myc allele, before (CTRL) and upon MYC inactivation (+DOX) over the course of 3 days. RT-qPCR analysis for MYC and its canonical target gene, Ornithine Decarboxy-lase 1 (ODC1), verified MYC inactivation (96.17-fold, P= 8.41 × 10⁻⁹, and 12.36-fold, P= 1.2 × 10⁻⁵ lower on
day 3, respectively) in EµSRα-tTAα;tet-o-MYC-derived T-ALL cells (Fig. 2a). Subsequently, RT-qPCR for TET1 and TET2 revealed a direct correlation between MYC and TET1 expression levels, while showing an inverse correlation between MYC and TET2 levels (Fig. 2b). In mouse T-ALL, TET1 mRNA levels decreased signifi-cantly (6.63-fold, P= 0.021), while TET2 mRNA levels increased significantly (2.55-fold, P= 9.4 × 10⁻⁵) upon
MYC inactivation after 3 days.
Furthermore, to validate our results in mouse T-ALL we used P493-6 cells as model for high and low MYC expression in human lymphocytes, allowing for MYC inactivation. We compared human Burkitt lymphoma-like cells (P493-6), harboring a tetracycline-regulated c-myc allele, before (CTL) and upon MYC inactivation (+DOX) over the course of 2 days. RT-qPCR showed a significant decrease (64.39-fold, P= 7.67 × 10⁻⁶) in
a
b
c
d
e
f
Fig. 1 Tumor regression upon MYC inactivation in T‑ALL is associated with genome‑wide changes in DNA (hydroxy)methylation. MeDIP‑ and
levels increased (3.72-fold, P= 2.20 × 10⁻⁵) (Fig. 2d). Together, these results indicate that TET1 expression is high, while TET2 is low in T-ALL derived from EµSRα -tTAα;tet-o-MYC and in human Burkitt lymphoma, revealing a direct correlation between MYC and TET1, and an inverse correlation between MYC and TET2 expression levels.
To further determine whether MYC directly binds to the TET1 and TET2 genes and controls their tran-scription, we analyzed chromatin immunoprecipitation (ChIP-seq) data for P493-6 cells generated by Sabo et al. [13] (see Fig. 2e). We found MYC binding to the genomic TET1 and TET2 loci to be significantly enriched in P493-6 cells, revealing that MYC occupies sequences at the TET1 locus upstream of exon 1 (enrichment 157.61) and exon 3 (enrichment 78.43), as well as the TET2 locus downstream of exon 1 (enrichment 361.05). We con-clude that high TET1 and low TET2 expression levels in
mouse T-ALL and human Burkitt lymphoma-like cells are directly MYC-dependent and are inversed upon MYC inactivation.
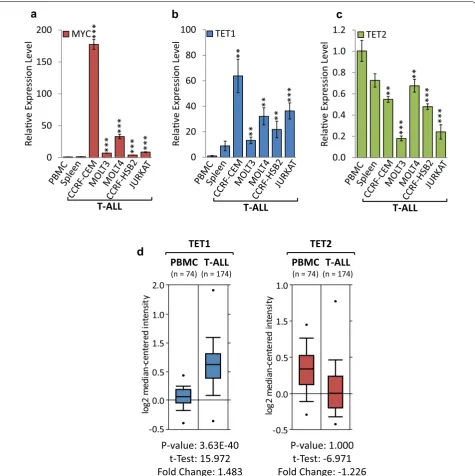
TET1 is overexpressed, while TET2 is suppressed in human T‑ALL cell lines and clinical specimens
To translate our results from transgenic models to patient-derived cell lines overexpressing endog-enous MYC, we performed gene expression profil-ing for TET1 and TET2, comparing a panel of human T-ALL cell lines to peripheral blood mononuclear cells (PBMCs) and spleen obtained from healthy donors (Fig. 3a–c). RT-qPCR analysis indicated that MYC mRNA levels were significantly higher in CCRF-CEM (177.43-fold), MOLT3 (7.04-fold), MOLT4 (32.93-fold), CCRF-HSB2 (3.89-fold), and JURKAT (8.08-fold), compared to normal PBMCs. RT-qPCR analysis indi-cated that TET1 mRNA levels were significantly higher in CCRF-CEM (63.80-fold), MOLT3 (13.23-fold), 0.0 0.5 1.0 1.5 2.0 2.5 3.0 TET1 TET2 Re lave Expr ession Level
b
* * ** ** * * *WT 1d 2d 3d +20ng/mL DOX Mouse T-ALL (EµSRα-tTAα;tet-o-MYC) Burki lymphoma-like (P493-6) 0 2 4
6 TET1TET2
+DOX CTL ** * ** *
d
Re lave Expr essionLevel Burki lymphoma-like (P493-6)
e
0.0 0.5 1.0 1.5 MYC ODC1WT 1d 2d 3d +20ng/mL DOX Mouse T-ALL (EµSRα-tTAα;tet-o-MYC) Re lave Expr ession Level ** * ** * *** ** * *** ***
a
c
0.0 0.2 0.4 0.6 0.8 1.0 1.2 MYC Re lave Expr ession Level Burki lymphoma-like (P493-6) +DOX CTL ** * chr10:70,320,117-70,454,239 TET1 TET2 chr4:106,067,842-106,200,960Enrichment (MYC ) UCSC Genes
Enrichment (MYC ) UCSC Genes Genomic loca on
Genomic loca on
361.05
157.61 78.43 +1
+1
Fig. 2 TET1 and TET2 levels are dependent on MYC expression. MYC inactivation in T‑ALL cells (6780) derived from EµSRα‑tTAα;tet‑o‑MYC mice, and
human Burkitt lymphoma‑like (P493‑6) cells, harboring a tetracycline‑regulated c‑MYC allele, in a time‑dependent manner for 1, 2, and 3 days using 20 ng/mL DOX. Mouse T‑ALL cells: a RT‑qPCR analysis of MYC and its canonical target gene Ornithine Decarboxylase 1 (ODC1), and b of TET1 and
MOLT4 (32.07-fold), CCRF-HSB2 (21.83-fold), and JURKAT (36.34-fold), compared to normal PBMCs. In contrast, we found TET2 expression to be significantly
lower in CCRF-CEM (1.83-fold), MOLT3 (5.56-fold), MOLT4 (1.48-fold), CCRF-HSB2 (2.09-fold), and JURKAT (4.14-fold). To test whether clinical T-ALL specimens resemble our results from established cell
TET2
T-ALL
(n = 174)PBMC
(n = 74)
P-value: 1.000
t-Test: -6.971
Fold Change: -1.226
TET1
T-ALL
(n = 174)PBMC
(n = 74)
P-value: 3.63E-40
t-Test: 15.972
Fold Change: 1.483
- 50.0.0 0.5 2 0.
1.5 1.0
log
2m
ed
ia
n-cen
te
red
in
te
ns
ity
- 50. 0.0 0.5 1.5
1.0
lo
g2
m
ed
ia
n-ce
nt
er
ed
in
te
ns
ity
d
0 50 100 150
200 MYC
a
T-ALL
***
***
***
*** ***
0 20 40 60 80
100 TET1
b
T-ALL
**
**
**
**
***
c
0.0 0.2 0.4 0.6 0.8 1.0
1.2 TET2
T-ALL
**
***
**
***
***
Re
lave Expr
ession Leve
l
Relave Expr
ession Leve
l
Relave Expr
ession Leve
l
Fig. 3 TET1 is overexpressed, while TET2 is suppressed in human T‑ALL cell lines and clinical specimens. Expression profiling of TET1 and TET2 in
human T‑ALL cell lines and clinical specimens compared to non‑malignant tissue. RT‑qPCR of a MYC, b TET1 and c TET2 in human T‑ALL (CCRF‑CEM, MOLT3, MOLT4, CCRF‑HSB2, JURKAT) compared to peripheral blood mononuclear cells (PBMCs) and spleen obtained from healthy donors. RT‑qPCR data were normalized to RPL13A. Error bars represent mean ± SEM; n= 3; two‑tailed Student’s t test: *P < 0.05; **P < 0.01; ***P < 0.001. d TET1 and
TET2 expression profiles in clinical specimens obtained though Oncomine (http://www.oncom ine.org) from Haferlach et al. [33]. TET1 and TET2
lines, we analyzed publically available expression data obtained from Haferlach et al. [33] via Oncomine (Fig. 3d). We found that TET1 mRNA expression lev-els are elevated (1.483-fold, P = 3.63 × 10−40), while
TET2 expression levels are lower (1.226-fold, P = 1.0) in clinical T-ALL (n= 174) than in normal PBMCs (n= 74), which is consistent with our findings in cell lines. Taken together, the expression profiling reveals that TET1 is overexpressed, while TET2 is suppressed in patient-derived T-ALL cell lines and clinical speci-mens, mimicking the above results from transgenic models.
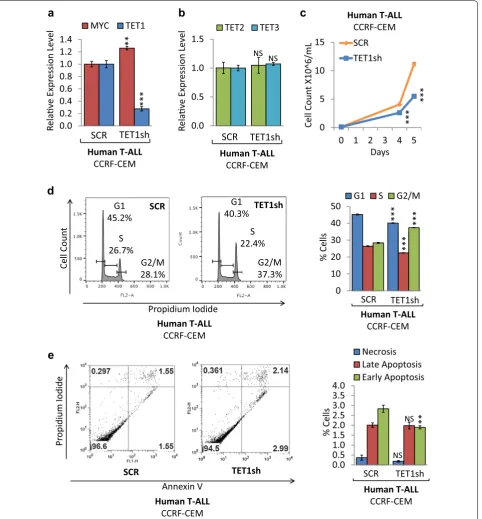
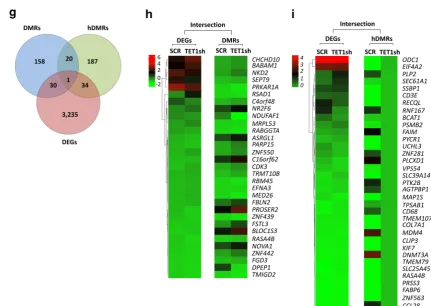
TET1 knockdown reduces cell proliferation of human T‑ALL cells
To determine whether loss of TET1 function affects tumor cell proliferation and viability, we carried out shRNA-mediated TET1 knockdown (KD) in human T-ALL cells (CCRF-CEM). CCRF-CEM is an estab-lished T-ALL cell line, exhibiting high MYC expression. We compared CCRF-CEM cells upon shRNA-mediated knockdown of TET1 to a shRNA control (Fig. 4). First, we validated TET1 KD as well as MYC, TET2, and TET3 expression levels by RT-qPCR (Fig. 4a, b). Compared to scrambled (SCR) control, CCRF-CEM cells expressing TET1sh show 3.63-fold less TET1 mRNA levels, while MYC, TET2, and TET3 levels were similar. The corre-sponding growth curve indicates that TET1 KD in CCRF-CEM decreased cell proliferation (Fig. 4c). To determine a mechanism underlying reduced cell proliferation, flow cytometric cell viability and cell cycle analysis were per-formed. Cell cycle analysis based on propidium iodide (PI) confirmed a decrease in CCRF-CEM cell prolifera-tion, indicating a significant decrease in G1 phase cells from 45.2% for SCR to 40.3% for TET1sh, and an increase in G2/M phase cells from 28.1% for SCR to 37.3% for TET1sh (Fig. 4d). In parallel, we quantified cell death by Annexin V and PI staining followed by flow cytometric analysis (Fig. 4e). While we did not detect significant changes in the fraction of necrotic cells, we found a small decrease in apoptotic cells for TET1sh. We furthermore validated our findings in mouse T-ALL cells, where TET1 KD using a different shRNA reduced tumor cell prolifera-tion through cell cycle arrest (Addiprolifera-tional file 2: Fig. S2). We conclude that loss of TET1 expression in both mouse and human T-ALL cells leads to reduced cell prolifera-tion primarily through cell cycle arrest mechanisms.
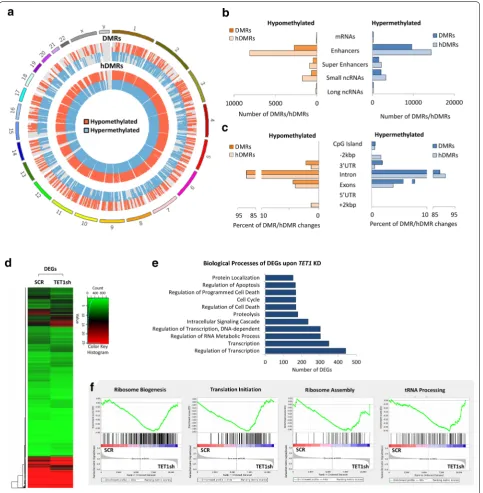
Knockdown of TET1 in human T‑ALL cells alters DNA (hydroxy)methylation patterns and gene expression programs
To investigate the molecular mechanisms underly-ing reduced tumor cell proliferation upon TET1 KD in
human T-ALL cells, we measured DNA (hydroxy)meth-ylation and RNA expression changes, using MeDIP-, hMeDIP-, and RNA-seq analysis, comparing CCRF-CEM cells before (SCR) and upon TET1 KD (TET1sh) (Fig. 5). For each sample, we generated 30–40 million Illumina sequencing reads, of which ~ 40–85% were successfully mapped to either strand of the human genome (hg19). To identify statistically significant DMRs and hDMRs, we used a cutoff of log2FC ≥ 1 with a P value of ≤ 10−4.
We identified a total of 17,712 DMRs and 31,253 hDMRs that increased or decreased significantly upon TET1 KD in CCRF-CEM cells. The chromosome-based circular plot reveals genome-wide changes in the 5mC and 5hmC patterns upon loss of TET1 expression (Fig. 5a). Annotating DMRs and hDMRs (both hypo- and hypermethylated) with the nearest gene, we found 259 and 277 DMRs and hDMRs associated with mRNAs, 12,386 and 22,786 with enhancers, 2011 and 3068 with super-enhancers, 2770 and 5054 with small ncRNAs, and 295 and 378 with long ncRNAs, respectively (Fig. 5b). By further annotating DMRs and hDMRs associated with protein-coding genes with cis-regulatory elements, we found 3.23% and 2.76% of the DMRs and hDMRs associ-ated with CpG islands, 91.58% and 93.40% with introns, 6.04% and 3.91% with exons, 2.05% and 0.93% with 5′- or 3′-UTRs, and 0% and 1.49% with sequences 2 kbp upstream or downstream of the nearest gene, respec-tively (Fig. 5c). Thus, TET1 KD in human T-ALL cells leads to genome-wide changes in DNA (hydroxy)meth-ylation patterns associated mostly with introns.
0 5 10 15
0 1 2 3 4 5 SCR
TET1sh
0.0 0.5 1.0 1.5 2.0 2.5 3.0 3.5 4.0
Necrosis Late Apoptosis Early Apoptosis
SCR
Human T-ALL
CCRF-CEM
**
% Cell
s
NS NS
0.0 0.2 0.4 0.6 0.8 1.0 1.2 1.4
MYC TET1
TET1sh SCR
**
*
**
Human T-ALL
CCRF-CEM
Re
lave Expr
ession Leve
l
a
Cell Coun
t X10^6/mL
Days
***
**
*
Human T-ALL
CCRF-CEM
c
TET1sh
Human T-ALL
CCRF-CEM
SCR
Pr
opidium Iodid
e
Annexin V
e
G1 40.3%
S 22.4%
G2/M 37.3%
TET1sh
d
G1 45.2%
S 26.7%
G2/M 28.1%
SCR
Cell Coun
t
Propidium Iodide
Human T-ALL
CCRF-CEM 0.0 0.5 1.0
1.5 TET2 TET3
TET1sh SCR
Re
lave Expr
ession Leve
l
NS NS
Human T-ALL
CCRF-CEM
b
0 10 20 30 40
50 G1 S G2/M
Human T-ALL
CCRF-CEM
***
**
* ***
TET1sh SCR
% Cells
TET1sh
Fig. 4 TET1 KD reduces cell proliferation of human T‑ALL. Human T‑ALL cells (CCRF‑CEM) were compared before (SCR) and upon TET1 KD (TET1sh).
Fig. 5 TET1 KD in human T‑ALL cells alters gene expression by changing DNA (hydroxy)methylation. MeDIP‑, hMeDIP‑, and RNA‑seq analysis of human T‑ALL cells (CCRF‑CEM) before (SCR) and upon TET1 KD (TET1sh). a Genomic distribution of DMRs and hDMRs is displayed as
eliciting cellular senescence and tumor regression [16,
34].
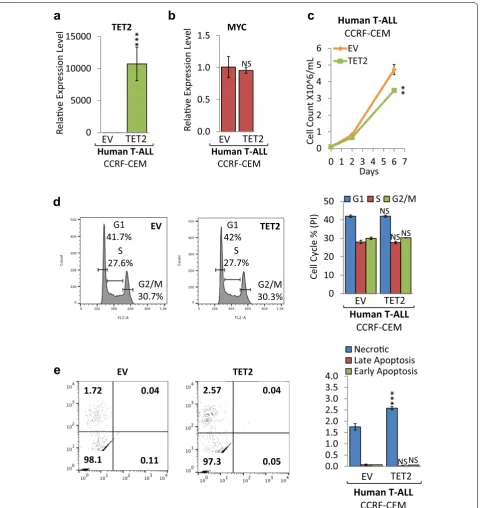
To further determine the relationship between DNA (hydroxy)methylation and gene expression changes in CCRF-CEM cells upon TET1 KD, we selected for DEGs that are associated with changes in 5mC or 5hmC enrichment. We plotted DMRs, hDMRs, and DEGs in a Venn diagram (Fig. 5g). The intersection graph shows a total of 3300 DEGs, as well as 209 DMRs and 242 hDMRs that are associated with protein cod-ing genes. Of the 3300 DEGs, we identified 31 to be associated with DMRs and 35 with hDMRs (Fig. 5h, i). We found that 21 DMRs and hDMRs overlap with each other. One gene, RASA4B (RAS P21 Protein Activa-tor 4B), was significantly changed in all three catego-ries, DEGs, DMRs, and hDMRs. We conclude that in T-ALL, MYC-driven overexpression of TET1 contrib-utes to tumor cell-specific 5mC and 5hmC patterns and thus gene expression programs that are important for enhanced global protein synthesis and tumor cell proliferation.
Ectopic expression of TET2 decreased tumor cell proliferation of human T‑ALL cells
To determine whether reconstitution of TET2 expression in human T-ALL cells affects tumor cell proliferation and viability, we retrovirally introduced full-length TET2 cDNA into CCRF-CEM cells (Fig. 6). RT-qPCR analysis confirmed ectopic TET2 mRNA expression in CCRF-CEM (TET2) compared to empty vector (EV) control cells (Fig. 6a), while MYC expression levels remained unchanged (Fig. 6b). The corresponding growth curve revealed that ectopic TET2 expression significantly decreases proliferation of CCRF-CEM cells (Fig. 6c). To determine the cellular mechanism underlying reduced cell proliferation, we performed flow cytometric cell via-bility and cell cycle analysis. Cell cycle analysis based on propidium iodide (PI) indicated no significant change in G1, S, or G2/M phase of the cell cycle (Fig. 6d). In paral-lel, we quantified cell death by Annexin V and PI staining followed by flow cytometric analysis (Fig. 6e). While we did not detect significant changes in the fraction of apop-totic cells, we found a significant increase in necrotic cells (from 1.7% to 2.6%) upon ectopic TET2 expression. We conclude that ectopic TET2 expression in human T-ALL disrupts tumor cell growth and results in reduced cell proliferation primarily through necrosis.
0.0 0.5 1.0 1.5 2.0 2.5 3.0 3.5 4.0
Necroc Late Apoptosis Early Apoptosis 0
10 20 30 40
50 G1 S G2/M
Cell Cycle % (PI)
EV
TET2
Human T-ALL
CCRF-CEM
a
d
b
0 1 2 3 4 5 6
0 1 2 3 4 5 6 7 EV
TET2
**
Cell Coun
t X10^6/mL
Human T-ALL
CCRF-CEM
Days
c
e
G1 41.7%
S 27.6%
G2/M 30.7%
98.1 0.11 0.04 1.72
97.3 0.05
0.04 2.57
NS
NS NS
EV
TET2
Human T-ALL
CCRF-CEM
NS***
NS
EV TET2
EV TET2
S 27.7%
G1 42%
G2/M 30.3% 0.0
0.5 1.0 1.5
NS
EV TET2
Human T-ALLCCRF-CEM
Relave Expr
ession Level
MYC
0 5000 10000 15000
***
EV TET2
Human T-ALLCCRF-CEM
Relave Expr
ession Level
TET2
Fig. 6 Ectopic TET2 expression reduces cell proliferation of human T‑ALL. Human T‑ALL cells (CCRF‑CEM), engineered to ectopically express TET2
Ectopic expression of TET2 in human T‑ALL cells alters gene expression programs by changing DNA (hydroxy) methylation
To determine the effect ectopic TET2 expression has on DNA (hydroxy)methylation and RNA expression in human T-ALL cells, we carried out MeDIP-, hMeDIP-, and RNA-seq analysis, comparing CCRF-CEM cells before (EV) and upon ectopic expression of TET2 using cDNA (TET2) (Fig. 7). For each MeDIP/hMeDIP sample, 30–40 million Illumina sequencing reads were generated, of which ~ 40–85% were successfully mapped to either strand of the human genome (hg19). To identify DMRs and hDMRs, we performed a genome-wide, unbiased detection by complete tiling of the human genome using a (hydroxy)methylation difference cutoff of log2FC ≥ 1 with a P value of ≤ 10−4.
We identified a total of 16,666 DMRs and 28,681 hDMRs that were significantly hypo- or hypermethyl-ated upon ectopic TET2 expression in CCRF-CEM cells. The genomic location of DMRs and hDMRs indicates genome-wide changes in 5mC and 5hmC distribution upon ectopic TET2 expression (Fig. 7a). Annotating DMRs and hDMRs (hypo- and hypermeth-ylated) with the nearest gene, we found 158 and 238 DMRs and hDMRs associated with mRNAs, 11,746 and 21,224 with enhancers, 1957 and 2665 with super-enhancers, 2588 and 4272 with small ncRNAs, and 226 and 292 with long ncRNAs, respectively (Fig. 7b). We further annotated DMRs and hDMRs associated with mRNA genes with cis-elements. Of the total DMRs and hDMRs, we found 86.96% and 91.93% associated with introns, 4.21% and 3.39% with exons, 3.80% and 2.57% with 5′- or 3′-UTRs, and 3.80% and 2.11% with sequences 2 kbp or more upstream or downstream of
the nearest gene, respectively (Fig. 7c). Thus, similar to TET1 KD, ectopic expression of TET2 in human T-ALL cells led to genome-wide changes in 5mC and 5hmC patterns associated mostly with intron sequences.
To determine the effect of alterations in DNA (hydroxy) methylation upon ectopic TET2 expression on RNA expression in CCRF-CEM cells, we next performed RNA-seq. We identified 1771 statistically significant DEGs, of which 917 genes decreased, while 854 increased in expression upon ectopic TET2 expression (Fig. 7d). To determine the biological processes associated with the DEGs, we performed gene ontology analysis using DAVID (Fig. 7e). We found regulation of transcription, negative regulation of cell proliferation, and positive regulation of apoptosis among the processes associated with ectopic TET2 expression in T-ALL. We further performed gene enrichment analysis to associate RNA expression with biological processes. The results indicate that upon ectopic TET2 expression, there is a decreasing trend for genes involved in cell cycle arrest (n= 84), neg-ative regulation of extrinsic apoptotic signaling (n= 66), positive regulation of endothelial cell proliferation (n= 77), and regulation of transcription from RNA Pol II promoter in response to stress (n= 58) (Fig. 7f).
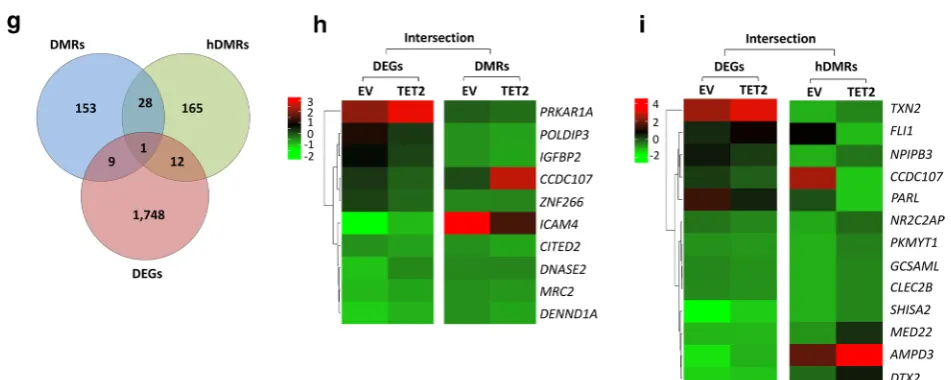
To determine the relationship between DNA (hydroxy) methylation and gene expression changes in CCRF-CEM cells upon ectopic TET2 expression, we selected for DEGs that are associated with changes in 5mC or 5hmC enrichment. We plotted DMRs and hDMRs asso-ciated with mRNAs, as well as DEGs in a Venn diagram (Fig. 7g). The intersection graph shows a total of 1771 DEGs, as well as 150 DMRs and 200 hDMRs that are associated with protein-coding genes. Of the 1771 DEGs, we identified 10 to be associated with DMRs and 13 with
hDMRs (Fig. 7h, i). We found that 25 DMR- and hDMR-associated protein-coding genes overlap. CCDC107 (coiled-coil domain-containing protein 107), was sig-nificantly changed in all three categories: DEGs, DMRs, and hDMRs. Taken together, we conclude that ectopic expression of TET2 in T-ALL alters 5mC and 5hmC pat-terns and thus gene expression programs resulting in reduced tumor cell proliferation.
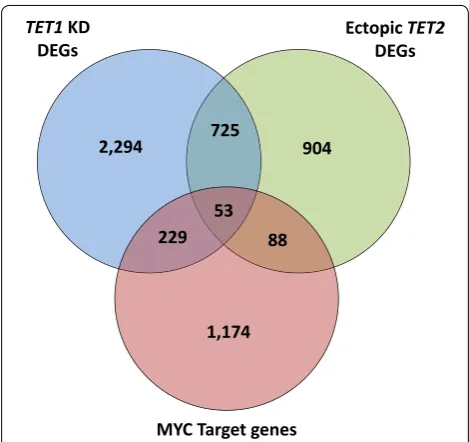
TET1, TET2, and MYC target genes overlap
To determine the overlap between TET1, TET2, and MYC target genes in T-ALL, we used the DEGs upon TET1 KD and ectopic expression of TET2 in human T-ALL cells (CCRF-CEM) and compared them with pre-viously identified MYC target genes [35–37] (Fig. 8). Of the 3300 DEGs identified upon TET1 KD and the 1771 DEGs identified upon ectopic expression of TET2, we found 778 genes overlap with each other. At the same time, we found 282 genes that were both regulated by TET1 and MYC, and 141 genes that were both regulated between TET2 and MYC. Lastly, we found 53 genes that all three data sets had in common. Taken together, this indicates that there is some overlap between TET1 and TET2 targets, even though the two enzymes have dis-tinct functions in T-ALL. At the same time, fewer TET1 and TET2 targets overlap with MYC, revealing that the majority of TET targets are not directly occupied by
MYC, but rather regulated indirectly highlighting an indirect genome-wide mechanism.
Discussion
This study demonstrates for the first time that the MYC oncogene deregulates the expression of TET methylcy-tosine dioxygenases and thereby global DNA (hydroxy) methylation and gene expression programs to maintain tumor cell proliferation. While aberrant DNA meth-ylation is a characteristic feature of tumor cells, the mechanisms of how tumor cell-specific DNA (hydroxy) methylation patterns are written, maintained, and erased through the coordinated action of DNA methylating and demethylating enzymes are poorly understood. Here, we reveal a novel mechanism through which MYC estab-lishes and maintains tumor cell-specific DNA (hydroxy) methylation and gene expression programs in a genome-wide fashion.
By carrying out a comprehensive genome-wide DNA (hydroxy)methylation analysis, we show that cellular senescence and tumor regression upon MYC inactivation in a mouse model of T-ALL (EµSRα-tTAα;tet-o-MYC) is associated with genome-wide changes in 5mC and 5hmC patterns. Using this T-ALL model, we have previously reported that tumor regression depends on activation of cellular senescence pathways associated with genome-wide changes in chromatin structure including histone acetylation and methylation, associated with heterochro-matin formation [3, 18, 30]. Together, our MeDIP- and hMeDIP-seq analyses reveal genome-wide changes in 5mC and 5hmC patterns associated with a wide variety of biological processes upon MYC inactivation, cellular senescence, and tumor regression, indicating that MYC maintains tumor cell-specific DNA (hydroxy)methylation patterns in T-ALL.
Shedding light on the underlying molecular mecha-nism, we found that in T-ALL, TET1 is overexpressed, while TET2 transcription is repressed in a MYC-depend-ent fashion across all human T-ALL cell lines and clini-cal specimens we analyzed. Consistently, we were able to demonstrate that MYC inactivation in T-ALL arising in EµSRα-tTA;tet-o-MYC mice leads to an inverse expres-sion pattern, decreasing TET1 levels, while increasing TET2 levels. Together with the ChIP data indicating that MYC binds to the TET1 and TET2 loci, our results implicate a direct transcriptional regulation. However, we cannot exclude that, besides being controlled by MYC directly, TET1 and TET2 expression might also be regu-lated indirectly through changes in other MYC target genes. Both DNMT and TET expression and activity have been found deregulated in various cancer types, includ-ing hematologic malignancies [38–40]. We conclude that the MYC oncogene upregulates TET1 while suppressing
2,294 904
1,174 725
53 88 229
Ectopic TET2 DEGs TET1KD
DEGs
MYC Target genes
Fig. 8 TET1, TET2, and MYC target genes overlap. Overlap between
TET2 expression in T-ALL, and speculated whether TET function was essential for tumor maintenance. Simi-larly, we previously reported that in T-ALL and Burkitt lymphoma MYC directly controls the overexpression of DNMT3B for tumor maintenance, maintaining specific 5mC and thus gene expression patterns [26].
Indeed, we found that TET1 KD or ectopic expres-sion of TET2 decreased cell proliferation in T-ALL and was associated with genome-wide changes in 5mC and 5hmC, suggesting a tumor promoting function of TET1, and a tumor suppressing role for TET2. Our findings are consistent with recent reports that TET1 acts as an onco-gene in acute myeloid leukemia (AML) development and that high TET1 levels are predictive of poor overall sur-vival in AML [41]. Oncogenic TET1 plays an important role in the development of MLL-rearranged leukemia [42–44]. TET1 is also overexpressed in 40% of patients with triple-negative breast cancer, where it is associated with DNA hypomethylation and activation of oncogenic pathways, leading to poor overall survival [45]. However, TET1 expression has been found low in many other solid tumor types including colon, gastric, and ER-negative breast cancer [46–49], where TET1 is downregulated through miR-29, HMGA2, or NF-ĸB activation [50, 51]. Thus, TET1 may act as either tumor promotor or sup-pressor dependent on the context, a notion that also has been reported for other epigenetic regulators, including DNMTs.
In T-ALL, we found loss of TET1 function to be asso-ciated with decreased ribosome biogenesis and assembly, translational regulation, and tRNA processing. Indeed, MYC is well known to regulate ribosome biogenesis and translation through multiple mechanisms (reviewed in [52]), and we previously demonstrated that MYC inac-tivation leads to shutdown of global protein synthesis resulting in cellular senescence and tumor regression [16, 34]. Our finding that in T-ALL loss of TET1 expression is linked to a decrease in ribosome biogenesis and trans-lational regulation might provide a novel mechanism of how MYC regulates protein synthesis through alterations in DNA (hydroxy)methylation patterns. Consistent with our findings in T-ALL, high TET1 expression also corre-lated with upregulation of RNA transport and ribosome biogenesis pathways in AML [41]. In contrast to TET1, our results show that TET2 acts as a tumor suppressor in T-ALL. We found ectopic expressing of TET2 to be asso-ciated with a decrease in cell cycle regulation, negative regulation of apoptosis, and positive regulation of cell proliferation. While the absence of TET2 in MYC-driven tumors does not automatically mean it reinforces the tumor state, our ectopic TET2 expression experiments indicate a role as tumor suppressor. Similarly, TET2 has
been reported to be a tumor suppressor in B-cell lym-phomagenesis [53].
TET1 KD and ectopic TET2 expression in T-ALL causes genome-wide changes in both 5mC and 5hmC patterns. TET1 KD in T-ALL causes differential hydroxymethyla-tion at KLF4, critical for regulation of proliferation, dif-ferentiation, apoptosis, and somatic cell reprogramming [54]. There are several TET2 targets in T-ALL that over-lap with AML, such as CCDC84, CHKA, GNGT2, GPS2, IL20RB, LIN7B, PPAN, PROCA1, RECQL4, TMSB10, CHKB (fusion), and PABPN1 (fusion). It is noteworthy that restoration of TET2 in AML promotes DNA dem-ethylation, cell differentiation, and cell death, leading to a block in self-renewal of hematopoietic stem cells, causing myeloid differentiation [55].
While the exact role of TET1 and TET2 in regulating DNA (hydroxy)methylation outside of developmental processes is not well understood, our findings indicate distinct functions of TET1 and TET2 in MYC-driven tumor maintenance. In our working model (Fig. 9), the MYC oncogene directly drives the transcription of TET1 (as well as DNMT1 and DNMT3B [26]), while suppressing TET2. Inactivation of MYC inverts the expression pattern of both DNMTs and TETs, elicit-ing cellular senescence and tumor regression. Loss of TET1 and overexpression of TET2 cause genome-wide changes in 5mC and 5hmC patterns. We found a majority of changes in DNA (hydroxy)methylation patterns occurred in intron sequences. These observa-tions are consistent with other studies, indicating that TET1 localizes to gene bodies and introns of a large number of genes [56–58]. Our data suggest that TET1 and TET2 have distinct sets of genomic targets in turn affecting distinct cellular processes, despite some over-lap in differentially expressed genes. In this regard, it would be of interest to uncover which of the differen-tially (hydroxy)methylated genes are directly bound by TET1 or TET2 in T-ALL using genome-wide loca-tion analysis. Furthermore, it would be interesting to determine whether the genomic targets of DNMT1 and DNMT3B in this context overlap with TET1 or TET2, and whether there is any synergistic effect between the components of the DNA methylating and demeth-ylating enzymes contributing to MYC-driven tumor maintenance.
Conclusions
establishes and maintains tumor cell-specific DNA (hydroxy)methylation patterns on a genome-wide level by modulating the expression of individual components of the DNA methylating and demethylating machinery. Our working model indicates a coordinated interplay between the components of the DNA methylating and demethylating machinery contributing to MYC-driven tumor maintenance, highlighting the potential of spe-cific TET enzymes for therapeutic strategies. Targeting DNMTs or TET enzymes pharmacologically for thera-peutic anticancer strategies may be a promising concept, even though specific small molecule inhibitors are cur-rently still elusive.
Methods
Cell culture and treatment
Mouse T-ALL cell lines, derived from the transgenic T-ALL mouse model (EµSRα-tTAα;tet-o-MYC), were kindly provided by Dr. Dean W. Felsher, Stanford Uni-versity [5]. Human Burkitt lymphoma-like cells (P493-6) [59], T cell leukemia/lymphoma cell lines (JURKAT, CCRF-CEM, MOLT3, MOLT4, and CCRF-HSB-2), and adherent packaging cell lines (HEK293T and Phoenix-ampho) were obtained from American Type Culture Collection (ATCC). To turn off expression of the tetracy-cline-regulated MYC in the mouse model and in P493-6 cells, 20 ng/mL doxycycline (DOX) was added to the cell culture medium for the indicated times. All leukemia/ lymphoma cell lines were passaged less than 8 times, maintained in RPMI1640 supplemented with 10% FBS, 1% penicillin/streptomycin, 1% l-glutamine, and 50 μM 2-mercaptoethanol, and incubated at 37 °C humidi-fied with 5% CO2. Adherent cell lines were passaged less
than 8 times, maintained in DMEM supplemented with 10% FBS, 1% penicillin/streptomycin, 1% l-glutamine, and 50 μM 2-mercaptoethanol, and incubated at 37 °C humidified with 5% CO2. Routine mycoplasma detection
is done on all cell lines to eliminate risk of contamination.
shRNA‑mediated knockdown
Cell lines were infected with lentiviral vectors (pLKO.1-puro) containing either scrambled control (SCR) or spe-cific shRNA directed against TET1. The specific oligo sequences of shRNA are: Hs. TET1sh CCG GAC ACA ACT TGC TTC GAT AAT TCT CGA GAA TTA TCGA AGC AAG TTG TGT TTT TTG and Mm. TET1sh CCG GCA ACT TGC ATC CAC GAT TAA TCT CGA GAT TAA TCG TGG ATG CAA GTT GTT TTTG. Briefly, HEK293T cells were transfected using Lipofectamine 2000 (Invitrogen) with pLKO.1-puro, pPAX2, and pMD.G plasmids. Virus particles were collected for spinoculation at 2400 rpm for 2 h at 32 °C. Upon selection of positive cells with 2–4 µg of puromycin, knockdown of TET1 was confirmed by RT-qPCR.
Ectopic gene expression
Cell lines were infected with retroviral vectors (pMSCV-PIG) containing either empty vector (EV) or a mouse TET2 full-length cDNA. pcDNA3-Tet2 (#60939) and MSCV PIG (Puro-IRES GFP) (#18751) were obtained from Addgene. Mm TET2 cDNA was subcloned from pCDNA3-Tet2 using SnaBI/NotI restriction sites, into adapted pMSCV-PIG (Puro-IRES-GFP) plasmid using HpaI/NotI restriction sites. Adapted pMSCV-PIG plas-mid vector was modified with destroyed second EcoRI site and introduced NotI site and was a gift from Dr. Honglin Li, Augusta University. pMSCV-PIG-MmTET2
MYC
DNMT1
Tumor Cell
5mC / De novo / Maintenance Methylaon
DNMT3B DNMT1 DNMT3B
5hmC / Demethylaon MYC
TET1
DNMT1 DNMT3B TET1 TET2
DNMT1 DNMT3B
TET1 DNMT1
DNMT3B TET1
TET2
TET2 MYC
TET2 TET2
X
TET1shRNA
cDNA
Non-malignant Cell
MYC ON MYC OFF
Regressing Tumor
Cell Cycle Arrest
Fig. 9 Working model: The MYC oncogene controls DNMT1 and DNMT3B, as well as TET1 and TET2 expression in T‑ALL. Non‑malignant cells: MYC
levels are low, corresponding with low TET1, as well as DNMT1 and DNMT3B expression. Tumor cells: MYC levels are constitutively high, driving the expression of TET1 as well as DNMT1 and DNMT3B, while suppressing TET2. Regressing tumor: MYC inactivation in T‑ALL causes tumor regression through cellular senescence. This is associated with diminished DNMT1, DNMT3B, and TET1 levels, while TET2 expression is increased. Loss of TET1
clone was verified via DNA sequencing. Briefly, Phoenix-Ampho cells were transfected using Lipofectamine 2000 (Invitrogen) with pMSCV-PIG plasmid. Virus particles were collected for spinoculation at 2400 rpm for 2 h at 32 °C. Upon selection of positive cells with 2–4 µg of puromycin, cDNA expression was detected using RT-qPCR for TET2.
Tissue collection
Human spleen (total RNA) obtained from a healthy donor was purchased from Zyagen Inc. Human PBMCs (total RNA) were obtained from the Augusta University Biorepository.
RNA extraction and analysis of gene expression
Total RNA was isolated using the NucleoSpin RNA Kit including DNase-I digest (Machery-Nagel Inc.) follow-ing the manufacturer’s protocol. 0.5 μg RNA was reverse transcribed into cDNA using the iScript cDNA Kit (Bio-Rad). Quantitative PCR (qPCR) was performed using iTAQ Universal SYBR GREEN (BioRad) in an ABI Ste-pOne Plus analyzer (Applied Biosystems). Specific primer sequences are as follows: Mm MYC F: TCT CCA TCC TAT GTT GCG GTC, R: TCC AAG TAA CTC GGT CAT CATCT; Mm ODC1 F: GAC GAG TTT GAC TGC CAC ATC, R: CGC AAC ATA GAA CGC ATC CTT; Mm TET1 F: ATT TCC GCA TCT GGG AAC CTG, R: GGA AGT TGA TCT TTG GGG CAAT; Mm TET2 F: TGC TTT CCC AAC ACG GAA CTA, R: GCA CCA TTA GGC ATT AGC ACAAT; Mm TET3 F: TGC GAT TGT GTC GAA CAA ATAGT, R: TCC ATA CCG ATC CTC CAT GAG; Mm UBC F: AGC CCA GTG TTA CCA CCA AG, R: ACC CAA GAA CAA GCA CAA GG; Hs MYC F: CTG CGA CGA GGA GGA GAA , R: GGC AGC AGC TCG AAT TTC TT; Hs TET1 F: CAT CAG TCA AGA CTT TAA GCCCT, R: CGG GTG GTT TAG GTT CTG TTT; Hs TET2 F: GAT AGA ACC AAC CAT GTT GAGGG, R: TGG AGC TTT GTA GCC AGA GGT; Hs TET3 F: TCC AGC AAC TCC TAG AAC TGAG, R: AGG CCG CTT GAA TAC TGA CTG; Hs RPL13A F: CGG ACC GTG CGA GGTAT, R: CAC CAT CCG CTT TTT CTT GTC.
RNA sequencing
Total RNA was extracted as described above, and sam-ples were quantified using Nanodrop and qualified by agarose gel electrophoresis. Briefly, mRNA was isolated from total RNA with NEBNext PolyA mRNA Magnetic Isolation Module. Alternatively, rRNA was removed from the total RNA with a RiboZero Magnetic Gold Kit. The enriched mRNA or rRNA-depleted RNA was used for RNA-seq library preparation using KAPA Stranded RNA-Seq Library Prep Kit (Illumina). The completed libraries were qualified on Agilent 2100 Bioanalyzer for concentration, fragment size distribution between 400
and 600 bp, and adapter dimer contamination. The DNA fragments in mixed libraries were denatured with 0.1 M NaOH to generate single-stranded DNA molecules, loaded onto channels of the flow cell at 8 pM concentra-tion, and amplified in situ using TruSeq SRCluster Kit v3-cBot-HS (#GD-401-3001, Illumina). Sequencing was carried out by running 150 cycles with paired-end reads, using the Illumina HiSeq 4000 according to the manufac-turer’s instructions. RNA sequencing was performed by Arraystar Inc. (Rockville, MD).
RNA‑seq data analysis
After quality control, the fragments were 5′,3′ -adaptor-trimmed and filtered ≤ 20 bp reads with cutadapt soft-ware. The trimmed reads were aligned to reference genome with Hisat 2 software [60]. The expression level (FPKM value) of known genes and transcripts were cal-culated using ballgown through the transcript abun-dances estimated with StringTie [61, 62]. The number of identified genes and transcripts per group was calculated based on the mean of FPKM in group ≥ 0.5. Principal component analysis (PCA), correlation analysis, hierar-chical clustering, gene ontology (GO), pathway analysis, scatter plots, and volcano plots are performed for the dif-ferentially expressed genes in R or Python environment for statistical computing and graphics. RNA sequencing data analysis was performed by Arraystar Inc. (Rockville, MD). Data sets are deposited in GEO under accession number GSE126029.
Cell cycle analysis using propidium iodide
Cells were fixed in 70% methanol at − 20 °C for a mini-mum of 72 h and stained using a propidium iodide (PI) solution containing PBS + 0.5% BSA, 50 µg/mL PI (Acros Organics), and 200 µg/mL RNase A (Thermo Fisher). Cells were then analyzed immediately on a FACScalibur flow cytometer (Becton–Dickinson). FACS data were analyzed using FlowJo software (Tree Star).
Apoptosis analysis using Annexin V/propidium iodide
MeDIP and hMeDIP sequencing
Genomic DNA was isolated using the Nucleospin Tis-sue Kit with RNase A (Macherey-Nagel Inc.). Purified genomic DNA was sonicated to ~ 200–800 bp fragments, and 1 µg of fragmented DNA was ligated to Illumi-na’s genomic adapters with Genomic DNA Sample Kit (#FC-102-1002, Illumina), following the manufacturer’s instructions. ~ 300–900 bp ligated DNA fragments were further immunoprecipitated using an anti-5-Methylcyto-sine antibody (for MeDIP) or an anti-5-Hydroxymethyl-cytosine antibody (for hMeDIP). The enriched DNA was amplified by PCR and purified by AMPure XP beads. The DNA fragments in mixed libraries were denatured with 0.1 M NaOH to generate single-stranded DNA mol-ecules, loaded onto channels of the flow cell at 8 pM con-centration, and amplified in situ using HiSeq 3000/4000 PE Cluster Kit (#PE-410-1001, Illumina). Sequencing was carried out by running 150 cycles with paired-end reads, using HiSeq 3000/4000 SBS Kit (#FC-410-1003, Illumina) on Illumina HiSeq 4000 according to the manufacturer’s instructions. MeDIP and hMeDIP sequencing was per-formed by Arraystar Inc. (Rockville, MD).
MeDIP‑ and hMeDIP‑seq data analysis
Raw sequencing data generated from Illumina HiSeq 4000 that pass the Illumina chastity filter are used for following analysis. The fragments were 5′, 3′ -adaptor-trimmed and filtered ≤ 16 bp reads with cutadapt soft-ware. Trimmed reads (trimmed 5′,3′-adaptor bases) are mapped to reference genome (hg19 or mm10) with Hisat2 software. The mapped reads were used for sta-tistically significant unbiased methylation/hydroxym-ethylation region detection. LncRNA-, mRNA-, and small ncRNA-associated DMRs- and hDMRs-enriched regions (peaks) with statistically significant were identi-fied by diffReps (cutoff: log2FC ≥ 1, P value ≤ 10−4) [63]. LncRNA-, mRNA-, and small ncRNA-associated DMRs and hDMRs within promoter were annotated by the nearest gene using the UCSC RefSeq database. Promoter peaks were defined as 2000 bp upstream and down-stream from the transcription start site (TSS); gene body peaks were defined as +2000 bp downstream of the tran-scription start site (TSS) to the trantran-scription termination site (TTS); and intergenic peaks were defined as the other genomic regions not included in either promoters or gene body. MeDIP and hMeDIP analysis was performed by Arraystar Inc. (Rockville, MD). Data sets are deposited in GEO under accession number GSE126029.
Gene set enrichment analysis (GSEA)
GSEA (version 2.2.4) was performed using Java-based software (http://softw are.broad insti tute.org/gsea/
index .jsp) to distinguish important biological processes
pathways enriched between two samples [36]. Enrich-ment score was calculated for gene sets within a pathway and was selected based on nominal P≤ 0.05.
Functional annotation of biological processes Database for Annotation, Visualization and Integrated Discovery (DAVID) (version 6.8) analysis was performed based on online software (https ://david .ncifc rf.gov/
home.jsp) [64]. Gene ontology (GO) analysis of
biologi-cal processes was performed to indicate genes expressed differentially in biological pathways between two sam-ples. Statistical parameters were based on default DAVID parameters including a threshold count of 2 with EASE of 0.1, P value ≤ 0.05, and Benjamini threshold ≤ 1.
Clinical specimen data analysis
Gene expression analysis in clinical specimens was per-formed using Oncomine (http://www.oncom ine.org) data sets.
Statistical analysis
All experiments were performed on biological replicates unless otherwise specified. Sample size is reported in the respective figure legends. All quantitative PCR were run in triplicates, and standard deviation is shown in the figures. Two-tailed unpaired student’s t test was used to calculate P values; statistically significant values are specified in the figure legends. Statistical significance: NS = not significant *P < 0.05, **P < 0.01, ***P < 0.001.
Additional files
Additional file 1: Fig. S1. MYC inactivation in T‑ALL. T‑ALL cells (6780) derived from EµSRα‑tTAα;tet‑o‑MYC mice were treated with 20 ng/mL DOX for 2 days. RT‑qPCR analysis of MYC. RT‑qPCR data were normalized to
UBC. Error bars represent mean ± SEM; n= 3; two‑tailed Student’s t test: ***P < 0.001.
Additional file 2: Fig. S2.TET1 knockdown reduces cell proliferation of mouse T‑ALL cell lines. Mouse T‑ALL cells (EµSRα‑tTAα;tet‑o‑MYC) were compared before (SCR) and upon TET1 KD (TET1sh). RT‑qPCR analysis of
aMYC and TET1, bTET2 and TET3. RT‑qPCR data were normalized to UBC.
c Growth curve comparing viable cell counts. d Flow cytometric cell cycle analysis based on propidium iodide (PI) staining. The cell cycle distribution (G1, S, and G2/M) is displayed in percent. Error bars represent mean ± SEM;
Acknowledgements
We thank Dr. Dean W. Felsher, Stanford University, for kindly providing the mouse T‑ALL cell lines. Furthermore, we thank Dr. Honglin Li, Augusta Univer‑ sity, and the members of the van Riggelen laboratory for their support and useful suggestions.
Authors’ contributions
CJP, AL, and JvR designed the experiments; CJP and AL performed the experi‑ ments and analyzed the data; CJP, AL, JHC, and JvR provided critical feedback; and CJP and JvR wrote the manuscript. All authors read and approved the final manuscript.
Funding
This work was supported by an American Cancer Society Institutional Research Grant #IRG14‑193‑01 (J.v.R.).
Availability of data and materials
The data sets generated and/or analyzed during the current study are avail‑ able in the GEO repository, under accession number GSE126029.
Ethics approval and consent to participate
Not applicable.
Consent for publication
Not applicable.
Competing interests
The authors declare that they have no competing interests.
Author details
1 Department of Biochemistry and Molecular Biology, Augusta University, 1410 Laney‑Walker Blvd., Augusta, GA 30912, USA. 2 Georgia Cancer Center, Augusta University, 1410 Laney‑Walker Blvd., Augusta, GA 30912, USA.
Received: 6 March 2019 Accepted: 17 May 2019
References
1. Dang CV, O’Donnell KA, Zeller KI, Nguyen T, Osthus RC, Li F. The c‑Myc target gene network. Semin Cancer Biol. 2006;16:253–64.
2. Grandori C, Cowley SM, James LP, Eisenman RN. The Myc/Max/Mad net‑ work and the transcriptional control of cell behavior. Annu Rev Cell Dev Biol. 2000;16:653–99.
3. Dang CV. c‑Myc target genes involved in cell growth, apoptosis, and metabolism. Mol Cell Biol. 1999;19:1–11.
4. Eilers M, Eisenman RN. Myc’s broad reach. Genes Dev. 2008;22:2755–66. 5. Felsher DW, Bishop JM. Reversible tumorigenesis by MYC in hematopoi‑
etic lineages. Mol Cell. 1999;4:199–207.
6. Shachaf CM, Kopelman AM, Arvanitis C, Karlsson A, Beer S, Mandl S, Bach‑ mann MH, Borowsky AD, Ruebner B, Cardiff RD, et al. MYC inactivation uncovers pluripotent differentiation and tumour dormancy in hepatocel‑ lular cancer. Nature. 2004;431:1112–7.
7. Soucek L, Whitfield J, Martins CP, Finch AJ, Murphy DJ, Sodir NM, Karnezis AN, Swigart LB, Nasi S, Evan GI. Modelling Myc inhibition as a cancer therapy. Nature. 2008;455:679–83.
8. Frank SR, Parisi T, Taubert S, Fernandez P, Fuchs M, Chan HM, Livingston DM, Amati B. MYC recruits the TIP60 histone acetyltransferase complex to chromatin. EMBO Rep. 2003;4:575–80.
9. McMahon SB, Wood MA, Cole MD. The essential cofactor TRRAP recruits the histone acetyltransferase hGCN5 to c‑Myc. Mol Cell Biol. 2000;20:556–62.
10. Wolf E, Lin CY, Eilers M, Levens DL. Taming of the beast: shaping Myc‑ dependent amplification. Trends Cell Biol. 2015;25:241–8.
11. Lin CY, Loven J, Rahl PB, Paranal RM, Burge CB, Bradner JE, Lee TI, Young RA. Transcriptional amplification in tumor cells with elevated c‑Myc. Cell. 2012;151:56–67.
12. Nie Z, Hu G, Wei G, Cui K, Yamane A, Resch W, Wang R, Green DR, Tessa‑ rollo L, Casellas R, et al. c‑Myc is a universal amplifier of expressed genes in lymphocytes and embryonic stem cells. Cell. 2012;151:68–79.
13. Sabo A, Kress TR, Pelizzola M, de Pretis S, Gorski MM, Tesi A, Morelli MJ, Bora P, Doni M, Verrecchia A, et al. Selective transcriptional regula‑ tion by Myc in cellular growth control and lymphomagenesis. Nature. 2014;511:488–92.
14. Walz S, Lorenzin F, Morton J, Wiese KE, von Eyss B, Herold S, Rycak L, Dumay‑Odelot H, Karim S, Bartkuhn M, et al. Activation and repression by oncogenic MYC shape tumour‑specific gene expression profiles. Nature. 2014;511:483–7.
15. Knoepfler PS, Zhang XY, Cheng PF, Gafken PR, McMahon SB, Eisenman RN. Myc influences global chromatin structure. EMBO J. 2006;25:2723–34. 16. Wu CH, van Riggelen J, Yetil A, Fan AC, Bachireddy P, Felsher DW. Cellular
senescence is an important mechanism of tumor regression upon c‑Myc inactivation. Proc Natl Acad Sci USA. 2007;104:13028–33.
17. Li Y, Choi PS, Casey SC, Dill DL, Felsher DW. MYC through miR‑17‑92 sup‑ presses specific target genes to maintain survival, autonomous prolifera‑ tion, and a neoplastic state. Cancer Cell. 2014;26:262–72.
18. Zhu P, Martin E, Mengwasser J, Schlag P, Janssen KP, Gottlicher M. Induc‑ tion of HDAC2 expression upon loss of APC in colorectal tumorigenesis. Cancer Cell. 2004;5:455–63.
19. Poole CJ, van Riggelen J. MYC‑Master Regulator of the Cancer Epigenome and Transcriptome. Genes (Basel). 2017;8:142.
20. Secombe J, Li L, Carlos L, Eisenman RN. The Trithorax group protein Lid is a trimethyl histone H3K4 demethylase required for dMyc‑induced cell growth. Genes Dev. 2007;21:537–51.
21. van Riggelen J, Muller J, Otto T, Beuger V, Yetil A, Choi PS, Kosan C, Moroy T, Felsher DW, Eilers M. The interaction between Myc and Miz1 is required to antagonize TGFbeta‑dependent autocrine signaling during lymphoma formation and maintenance. Genes Dev. 2010;24:1281–94.
22. Brenner C, Fuks F. DNA methyltransferases: facts, clues, mysteries. Curr Top Microbiol Immunol. 2006;301:45–66.
23. Kulis M, Esteller M. DNA methylation and cancer. Adv Genet. 2010;70:27–56.
24. Jones PA, Baylin SB. The fundamental role of epigenetic events in cancer. Nat Rev Genet. 2002;3:415–28.
25. Shen H, Laird PW. Interplay between the cancer genome and epig‑ enome. Cell. 2013;153:38–55.
26. Poole CJ, Zheng W, Lodh A, Yevtodiyenko A, Liefwalker D, Li H, Felsher DW, van Riggelen J. DNMT3B overexpression contributes to aberrant DNA methylation and MYC‑driven tumor maintenance in T‑ALL and Burkitt’s lymphoma. Oncotarget. 2017;8:76898–920.
27. Bhattacharyya S, Yu Y, Suzuki M, Campbell N, Mazdo J, Vasanthakumar A, Bhagat TD, Nischal S, Christopeit M, Parekh S, et al. Genome‑wide hydroxymethylation tested using the HELP‑GT assay shows redistribution in cancer. Nucleic Acids Res. 2013;41:e157.
28. Ficz G, Branco MR, Seisenberger S, Santos F, Krueger F, Hore TA, Marques CJ, Andrews S, Reik W. Dynamic regulation of 5‑hydroxymethylcytosine in mouse ES cells and during differentiation. Nature. 2011;473:398–402. 29. Mellen M, Ayata P, Dewell S, Kriaucionis S, Heintz N. MeCP2 binds to
5hmC enriched within active genes and accessible chromatin in the nervous system. Cell. 2012;151:1417–30.
30. Song CX, Szulwach KE, Fu Y, Dai Q, Yi C, Li X, Li Y, Chen CH, Zhang W, Jian X, et al. Selective chemical labeling reveals the genome‑wide distribution of 5‑hydroxymethylcytosine. Nat Biotechnol. 2011;29:68–72.
31. Mitrea C, Wijesinghe P, Dyson G, Kruger A, Ruden DM, Draghici S, Bollig‑ Fischer A. Integrating 5hmC and gene expression data to infer regulatory mechanisms. Bioinformatics. 2018;34:1441–7.
32. Yetil A, Anchang B, Gouw AM, Adam SJ, Zabuawala T, Parameswaran R, van Riggelen J, Plevritis S, Felsher DW. p19ARF is a critical mediator of both cellular senescence and an innate immune response associated with MYC inactivation in mouse model of acute leukemia. Oncotarget. 2015;6:3563–77.
33. Haferlach T, Kohlmann A, Wieczorek L, Basso G, Kronnie GT, Bene MC, De Vos J, Hernandez JM, Hofmann WK, Mills KI, et al. Clinical utility of micro‑ array‑based gene expression profiling in the diagnosis and subclassifica‑ tion of leukemia: report from the International Microarray Innovations in Leukemia Study Group. J Clin Oncol. 2010;28:2529–37.
•fast, convenient online submission
•
thorough peer review by experienced researchers in your field
• rapid publication on acceptance
• support for research data, including large and complex data types
•
gold Open Access which fosters wider collaboration and increased citations maximum visibility for your research: over 100M website views per year
•
At BMC, research is always in progress.
Learn more biomedcentral.com/submissions
Ready to submit your research? Choose BMC and benefit from:
35. Zeller KI, Jegga AG, Aronow BJ, O’Donnell KA, Dang CV. An integrated database of genes responsive to the Myc oncogenic transcription factor: identification of direct genomic targets. Genome Biol. 2003;4:R69. 36. Subramanian A, Tamayo P, Mootha VK, Mukherjee S, Ebert BL, Gillette
MA, Paulovich A, Pomeroy SL, Golub TR, Lander ES, Mesirov JP. Gene set enrichment analysis: a knowledge‑based approach for inter‑ preting genome‑wide expression profiles. Proc Natl Acad Sci USA. 2005;102:15545–50.
37. Liberzon A, Subramanian A, Pinchback R, Thorvaldsdottir H, Tamayo P, Mesirov JP. Molecular signatures database (MSigDB) 3.0. Bioinformatics. 2011;27:1739–40.
38. Rasmussen KD, Helin K. Role of TET enzymes in DNA methylation, devel‑ opment, and cancer. Genes Dev. 2016;30:733–50.
39. Ko M, An J, Pastor WA, Koralov SB, Rajewsky K, Rao A. TET proteins and 5‑methylcytosine oxidation in hematological cancers. Immunol Rev. 2015;263:6–21.
40. Zhang W, Xu J. DNA methyltransferases and their roles in tumorigenesis. Biomark Res. 2017;5:1.
41. Wang J, Li F, Ma Z, Yu M, Guo Q, Huang J, Yu W, Wang Y, Jin J. High expression of TET1 predicts poor survival in cytogenetically normal acute myeloid leukemia from two cohorts. EBioMedicine. 2018;28:90–6. 42. Huang H, Jiang X, Wang J, Li Y, Song CX, Chen P, Li S, Gurbuxani S, Arno‑
vitz S, Wang Y, et al. Identification of MLL‑fusion/MYC dash, verticalmiR‑26 dash, verticalTET1 signaling circuit in MLL‑rearranged leukemia. Cancer Lett. 2016;372:157–65.
43. Ittel A, Jeandidier E, Helias C, Perrusson N, Humbrecht C, Lioure B, Mazurier I, Mayeur‑Rousse C, Lavaux A, Thiebault S, et al. First description of the t(10;11)(q22;q23)/MLL‑TET1 translocation in a T‑cell lymphoblastic lymphoma, with subsequent lineage switch to acute myelomonocytic myeloid leukemia. Haematologica. 2013;98:e166–8.
44. Huang H, Jiang X, Li Z, Li Y, Song CX, He C, Sun M, Chen P, Gurbuxani S, Wang J, et al. TET1 plays an essential oncogenic role in MLL‑rearranged leukemia. Proc Natl Acad Sci USA. 2013;110:11994–9.
45. Good CR, Panjarian S, Kelly AD, Madzo J, Patel B, Jelinek J, Issa JJ. TET1‑ mediated hypomethylation activates oncogenic signaling in triple‑nega‑ tive breast cancer. Cancer Res. 2018;78:4126–37.
46. Frycz BA, Murawa D, Borejsza‑Wysocki M, Marciniak R, Murawa P, Drews M, Kolodziejczak A, Tomela K, Jagodzinski PP. Decreased expression of ten‑eleven translocation 1 protein is associated with some clinicopatho‑ logical features in gastric cancer. Biomed Pharmacother. 2014;68:209–12. 47. Li Y, Shen Z, Jiang H, Lai Z, Wang Z, Jiang K, Ye Y, Wang S. MicroRNA4284
promotes gastric cancer tumorigenicity by targeting ten‑eleven translo‑ cation 1. Mol Med Rep. 2018;17:6569–75.
48. Neri F, Dettori D, Incarnato D, Krepelova A, Rapelli S, Maldotti M, Parlato C, Paliogiannis P, Oliviero S. TET1 is a tumour suppressor that inhibits colon cancer growth by derepressing inhibitors of the WNT pathway. Oncogene. 2015;34:4168–76.
49. Yang L, Yu SJ, Hong Q, Yang Y, Shao ZM. Reduced expression of TET1, TET2, TET3 and TDG mRNAs are associated with poor prognosis of patients with early breast cancer. PLoS ONE. 2015;10:e0133896.
50. Collignon E, Canale A, Al Wardi C, Bizet M, Calonne E, Dedeurwaerder S, Garaud S, Naveaux C, Barham W, Wilson A, et al. Immunity drives TET1 regulation in cancer through NF‑kappaB. Sci Adv. 2018;4:eaap7309. 51. Pei YF, Lei Y, Liu XQ. MiR‑29a promotes cell proliferation and EMT in breast
cancer by targeting ten eleven translocation 1. Biochim Biophys Acta. 2016;1862:2177–85.
52. van Riggelen J, Yetil A, Felsher DW. MYC as a regulator of ribosome bio‑ genesis and protein synthesis. Nat Rev Cancer. 2010;10:301–9.
53. Mouly E, Ghamlouch H, Della‑Valle V, Scourzic L, Quivoron C, Roos‑Weil D, Pawlikowska P, Saada V, Diop MK, Lopez CK, et al. B‑cell tumor develop‑ ment in Tet2‑deficient mice. Blood Adv. 2018;2:703–14.
54. Ghaleb AM, Yang VW. Kruppel‑like factor 4 (KLF4): what we currently know. Gene. 2017;611:27–37.
55. Cimmino L, Dolgalev I, Wang Y, Yoshimi A, Martin GH, Wang J, Ng V, Xia B, Witkowski MT, Mitchell‑Flack M, et al. Restoration of TET2 function blocks aberrant self‑renewal and leukemia progression. Cell. 2017;170(1079–1095):e1020.
56. Williams K, Christensen J, Pedersen MT, Johansen JV, Cloos PA, Rappsilber J, Helin K. TET1 and hydroxymethylcytosine in transcription and DNA methylation fidelity. Nature. 2011;473:343–8.
57. Wutz A, Smrzka OW, Schweifer N, Schellander K, Wagner EF, Barlow DP. Imprinted expression of the Igf2r gene depends on an intronic CpG island. Nature. 1997;389:745–9.
58. Zhang X, Wu M, Xiao H, Lee MT, Levin L, Leung YK, Ho SM. Methylation of a single intronic CpG mediates expression silencing of the PMP24 gene in prostate cancer. Prostate. 2010;70:765–76.
59. Pajic A, Spitkovsky D, Christoph B, Kempkes B, Schuhmacher M, Staege MS, Brielmeier M, Ellwart J, Kohlhuber F, Bornkamm GW, et al. Cell cycle activation by c‑myc in a burkitt lymphoma model cell line. Int J Cancer. 2000;87:787–93.
60. Kim D, Langmead B, Salzberg SL. HISAT: a fast spliced aligner with low memory requirements. Nat Methods. 2015;12:357–60.
61. Pertea M, Pertea GM, Antonescu CM, Chang TC, Mendell JT, Salzberg SL. StringTie enables improved reconstruction of a transcriptome from RNA‑ seq reads. Nat Biotechnol. 2015;33:290–5.
62. Frazee AC, Pertea G, Jaffe AE, Langmead B, Salzberg SL, Leek JT. Ballgown bridges the gap between transcriptome assembly and expression analy‑ sis. Nat Biotechnol. 2015;33:243–6.
63. Shen L, Shao NY, Liu X, Maze I, Feng J, Nestler EJ. diffReps: detecting dif‑ ferential chromatin modification sites from ChIP‑seq data with biological replicates. PLoS ONE. 2013;8:e65598.
64. da Huang W, Sherman BT, Lempicki RA. Systematic and integrative analy‑ sis of large gene lists using DAVID bioinformatics resources. Nat Protoc. 2009;4:44–57.