Vol. 3, No. 1 (2013): 159-163 Research Article
Open Access
Validated Specific HPLC Method for Determination of
Darifinacin during Stability Studies
V Raja Kumar
*1, B V V Ravi Kumar
1, N K Tripathy
2and Pritosh Pattanaik
31
Roland Institute of Pharmaceutical Sciences, Berhampur, Odisha.
2
Berhampur University , Berhampur, Odisha
3
Pratishta Institute of Pharmaceutical Sciences, Durajpally, Suryapet, Andhra Pradesh
* Corresponding author; email: [email protected]
ABSTRACT
The objective of the current study was to develop a validated stability-indicating assay method (SIAM) for darifinacin after subjecting it to forced degradation under hydrolysis, oxidation, photolysis and thermal stress conditions. The drug was stable under hydrolytic stress upon refluxing, and also on exposure to light. It was also stable to oxidation and thermal stress. Separation of drug from major and minor degradation products was successfully achieved on a C-18 column utilising Acetonitrile: 10mM Tetra Butyl Ammonium Hydrogen Sulphate (70:30%v/v). The detection wavelength was 285 nm. The method was validated and response was found to be linear in the drug concentration range of 5–300 µg/ml. The mean values (±R.S.D.) of slope and correlation coefficient were 4632 (±0.213) and 0.999 (±0.3323), respectively. The R.S.D. values for intra- and inter-day precision were <0.9 and <1.6%, respectively. The recovery of the drug from a mixture of degraded samples ranged between 98.987 and 100.9%. PDA peak purity test confirmed the specificity of the method. The method was also successful in analysis of drug in marketed tablets subjected to stability testing under accelerated conditions of temperature, humidity, and to thermal and photolytic stress.
Keywords:Darifinacin hydro bromide, Stress conditions, Tetra Butyl Ammonium Hydrogen Sulphate
INTRODUCTION
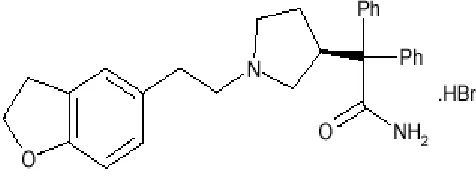
The International Conference on Harmonization (ICH) drug stability test guideline Q1A (R2) [1] requires that analysis of stability samples should be done through the use of validated stability-indicating analytical methods. It also recommends carrying out of stress testing on the drug substance to establish its inherent stability characteristics and to support the suitability of the proposed analytical procedure. The stress testing encompasses the influence of temperature, humidity, and light, oxidizing agents as well as susceptibility over a wide range of pH values. The objective of the present study was to study degradation of darifenacin under different ICH recommended stress conditions, and to establish a validated stability-indicating HPLC method Darifenacin hydrobromide which is chemically (S)-2-{1-[2-(2,3-dihydrobenzofuran-5yl)ethyl]-3-pyrrolidinyl}-2,2-diphenyl acetamide hydrobromide [2], is a potent muscarinic M3 receptor antagonist [2] that is used to treat symptoms of overactive bladder, such as frequent or urgent urination, and incontinence (urine leakage) [3].
According to our literature survey, it was revealed that, Darifenacin hydrobromide is not officially presented in IP, BP, USP and European pharmacopoeia. To the best of our knowledge there is no method reported for the stability indicating assay of Darifenacin hydrobromide in pharmaceutical dosage form by RP-HPLC.
Existing literature reveals analytical methods for the estimation of darifenacin includes less sensitive colorimetric method [4] for the determination of darifenacin, chiral separation of darifinacin by HPLC method [5] and quite expensive LC-MS/MS method [6] and a stability Indicating HPLC Method for the estimation of Darifenacin Hydrobromide in pure and tablet dosage [7] form. Hence, the object of this work is to develop a new, simple, rapid, efficient and reproducible analytical method for determination of Darifenacin hydrobromide in tablet dosage form by RP-HPLC and its stress degradation studies.
Received: 04 January 2013 Accepted: 10 January 2013 Online: 12 January 2013
Figure 1. Structure of Darifenacin Hydrobromide
MATERIALS AND METHODS
Darifenacin Hydrobromide was received from MSN Laboratories Ltd. (Hyderabad, India) and was used without further purification. Hydrogen peroxide was procured from S.D. Fine-chem Ltd. (Maharashtra). HPLC grade
methanol was purchased from Merck
(Darmstadt,Germany) and acetonitrile of the same grade was procured from Merck chemicals Ltd. All other chemicals were of analytical reagent grade. Ultra-pure water was obtained from water purification unit.
Instrumentation
A simple reverse phase HPLC method was developed for the determination of Darifenacin hydrobromide in bulk and pharmaceutical dosage forms. A Hibar® (250 x 4 mm,
5μm) LiChrosphere® 100 RP-18 is used.
Degradation Studies
All degradation studies in solution were carried out at a drug concentration of 1mg/ml. Hydrolytic reactions were carried out in water, 0.1M HCl and 0.1M NaOH under refluxing for 5 days. Oxidative studies were conducted at room temperature in 3 and 30% H2O2 for 24 and 48 h, respectively. Photo-degradation studies were carried out in water, 0.1M HCl and 0.1M NaOH in a photo stability chamber up to 15 days. Pure solid drug (in 1mm thick layer in a petri plate) was also exposed in the same chamber for 60 days. Suitable controls were kept under dark conditions. Pure drug was additionally exposed to dry heat at 50 ◦C and separately to accelerate conditions of
40◦Cand 75%RHin the stability chamber for 3 months. Samples were withdrawn periodically and analysed by HPLC after suitable dilution.
HPLC Method Development
The mobile phase Acetonitrile: 10mM Tetra Butyl Ammonium Hydrogen Sulphate in the ratio of 70:30%v/v at a flow rate of 1.0 ml/ min gave sharp peaks with minimum tailing and good resolution compared to the other one. The retention time was found to be 3.108 min. The run time was 10 minutes. In order to ascertain the wavelength of maximum absorption (λmax) of the drug, the drug solution (20 g/ml) in mobile phase i.e. Acetonitrile: TBHS (70:30) was scanned using spectrophotometer between the wavelength ranges of 200 – 400 nm against reagent blank. The resulting spectrum was shown below
Validation of the developed stability indicating method
Linearity was established by triplicate injections of solutions containing drug in the concentration range of 5– 300 µg/ml. Intra-day precision was established by making six injections of lowest, middle and highest concentration in the above range (25, 250 and 300 µg/ml) on the same day. These studies were also repeated on different days with different weightings to determine inter-day precision. Intermediate precision was established through separation studies on a different chromatographic system by a different operator. Accuracy was evaluated by fortifying a mixture of decomposed reaction solutions with three known concentrations of the drug. The recovery of added drug was determined. Specificity was established by determining peak purity for the drug peak in a mixture of stressed reaction solutions using a PDA detector. The resolution factor of the drug peak with respect to nearest resolving peaks was also determined.
Analysis of marketed tablets subjected to accelerated stability testing
Darifenacin Hydro bromide tablets were purchased from market and subjected to accelerated test conditions of 40◦C/75% RH in stability and photo stability chambers for 2 months. The tablets were also subjected to thermal stress at 50◦C for the same time period. For analysis, these were crushed and sonicated in methanol for 30 min. The contents were transferred to a 100 ml volumetric flask and the volume was made up to 100 ml with methanol. 500 µg/ml of the solution was withdrawn and diluted five times with mobile phase to obtain a concentration of 100 µg/ml. The samples were filtered through 0.22 µg/ml nylon membrane and subjected to analyses.
RESULTS AND DISCUSSION
Stress Studies
The retention times (RT) of the drug and the degradation products are listed in Table 1. The data obtained from linearity studies are given in Table 2. The representative of calibration curves are shown in Figure 1. The average % recovery of the drug was observed 101.10 and 103.05 from degradation solutions of acid hydrolysis and oxidation of DAR, respectively, confirming that the method was sufficiently precise. The precision data are given in Table 3. Good separation was achieved even when the procedure was repeated by a different person, thus confirming the reproducibility of the method. It was observed that good recoveries were made at the added
concentration of 10 and 30 μg/ml of drug for different
system suggested the following degradation behaviour. The forced degradation studies showed that the drug is resistant to all degradation. That is alkali (2.58%), acid (0.49%), oxidative (0.73%), Thermal (2.83%) and Photolysis (1.34%) degradation.
The retention time of Darifenacin hydrobromide in all degradation studies was varying by ±0.025 minutes in comparison to the retention time of pure drug. So, we conclude that the present method is specific as the drug peak separates effectively from its degradants under stress conditions.
All the proposed methods are simple, selective, reproducible, sensitive and accurate with good precision. Some of the methods were proved to be superior to most of the reported methods.
Table 1. Retention Time and Relative Retention Time of Various Peaks
PEAK RETENTION TIME (RT)
Darifeanacin Hydrobromide 3.108
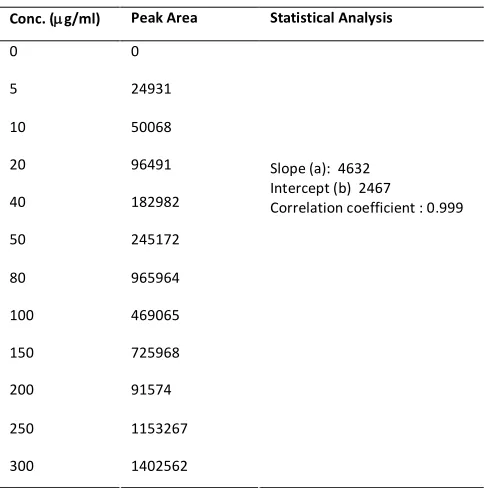
Table 2. Linearity of Darifenacin hydrobromide by RP-HPLC
Conc. (g/ml) Peak Area Statistical Analysis
0 0
5 24931
10 50068
20 96491
40 182982
50 245172
80 965964
100 469065
150 725968
200 91574
250 1153267
300 1402562
Slope (a): 4632 Intercept (b) 2467
Correlation coefficient : 0.999
Table 3. The percent relative standard deviations calculated for Darifenacin hydrobromide.
Concentration
(µg/ml) Peak area Statistical Analysis Retention time Statistical Analysis
10 50068 Mean: 50588.33 3.092 Mean: 3.096 10 51098 S.D: 515.0828 3.098 S.D: 0.0041 10 50599 %RSD: 1.018 3.100 %RSD: 0.132 20 96491 Mean: 96363 3.092 Mean: 3.097 20 95590 S.D: 717.6134 3.096 S.D: 0.0066 20 97008 %RSD: 0.7446 3.105 %RSD: 0.213 50 245172 Mean: 246198 3.100 Mean: 3.108 50 246421 S.D: 934.6695 3.108 S.D: 0.0085 50 247001 %RSD: 0.3796 3.117 %RSD: 0.273
Table 4. HPLC data
Parameter Obtained Values
Theoretical plates (N) 2135 Resolution 2.21 Assymetry 1.15
Figure 2. Calibration curve of Darifenacin hydrobromide
The retention time of Darifenacin hydrobromide in all degradation studies was varying by ±0.025 minutes in comparison to the retention time of pure drug. So, we conclude that the present method is specific as the drug peak separates effectively from its degradants under stress conditions.
All the proposed methods are simple, selective, reproducible, sensitive and accurate with good precision. Some of the methods were proved to be superior to most of the reported methods.
Studies on solid drug
Establishment of a stability-indicating method for a mixture of stressed solutions
The mobile phase comprising of Acetonitrile: 10mM Tetra Butyl Ammonium Hydrogen Sulphate in the ratio of 70:30v/v was first used to analyse individual stressed samples. It was then applied to a mixture of those stressed samples in which there was recognizable degradation and/or different degradation products were formed. The method was able to separate the drug as well as all major and minor degradation products. The resulting chromatogram is shown in Figure 3
LOD and LOQ
The parameters LOD and LOQ were determined on the basis of response and slope of the regression equation. The parameters LOD and LOQ for this method were found to be 0.329 and 0.997 respectively.
Validation of the method
The method was validated with respect to parameters like linearity, precision, accuracy, specificity and robustness.
Linearity
The linear fit of the system was illustrated graphically. The linearity range was found to be 5 - 300 g/ml. Least square regression analysis was carried out for the slope, intercept and correlation coefficient. The results are presented in Table 2.
Precision
The precision of each method was ascertained separately from the peak area obtained by actual determination of three fixed concentrations of drug in three replicates. The percent relative standard deviations were calculated for intra-day and inter-day for Darifenacin hydrobromide and presented in the Table 3.
Figure 3. A Typical Chromatogram of Darifenacin hydrobromide (100 g/ml) in pure drug
Minutes
0 1 2 3 4 5 6 7 8 9 10
V
o
lt
s
0 20 40
V
o
lt
s
0 20 40
3
.1
0
8
Detector A - 1 (285nm) PUSP
12 apr dari 1053
Retention Time
Figure 4. Typical chromatogram Darifenacin hydrobromide 100 µg/ml (3% H2O2)
Minutes
0 1 2 3 4 5 6 7 8 9 10
V
o
lt
s
0 20 40
V
o
lt
s
0 20 40
2.
050
2.
742
3.
125
Detector A - 1 (285nm) PUSP
REFERENCES
1. ICH, Stability Testing of New Drug Substances and Products. International Conference on Harmonization, IFPMA, Geneva, 2003.
2. Enablex on drugs.com.
3. www.rxlist.com/enablex-drug.htm
4. www.scientificipca.org/paper/2011/09/15/201109151131310A. doc
5. Radhakrishnanand P, Subba Rao DV and Himabindu V (2008). A Validated LC Method for Determination of the Enantiomeric Purity of Darifenacin in Bulk Drug and Extended Release Tablets. Chromatographia 68(11-12):1059-1062.
6. Thomas S, Paul SK, Shandilya S et al. (2012). Identification and structural elucidation of two process impurities and stress degradants in darifenacin hydrobromide active pharmaceutical ingredient by LC-ESI/MS(n). Analyst. 137(15):3571-82.
7. Meneghini LZ, Junqueira C, Andrade AS et al. (2011). Chemometric Evaluation of Darifenacin Hydrobromide Using A Stability-Indicating Reversed-Phase LC Method. Journal of Liquid Chromatography and Related Technologies. 34(18)
© 2013; AIZEON Publishers